
|
市場調査レポート
商品コード
1472193
HIV診断市場:モード別、検査タイプ別、最終用途別:世界の機会分析と産業予測、2023年~2032年HIV Diagnosis Market By Mode, By Test Type, By End-use : Global Opportunity Analysis and Industry Forecast, 2023-2032 |
||||||
|
|||||||

| HIV診断市場:モード別、検査タイプ別、最終用途別:世界の機会分析と産業予測、2023年~2032年 |
|
出版日: 2024年02月01日
発行: Allied Market Research
ページ情報: 英文 290 Pages
納期: 2~3営業日
|

- 全表示
- 概要
- 図表
- 目次
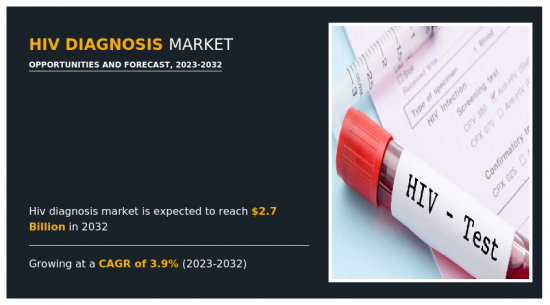
世界のHIV診断市場は、2022年に19億米ドルと評価され、2023年から2032年にかけてCAGR 3.9%で成長し、2032年には27億米ドルに達すると予測されています。
後天性免疫不全症候群(AIDS)を引き起こすウイルスであるヒト免疫不全ウイルス(HIV)に感染しているかどうかを判定する手順です。HIV検査では、血液量、唾液、尿中にHIV抗体、抗原、遺伝子(RNAまたはDNA)があるかどうかを確定するために、いくつかのアプローチや方法論が用いられます。基本的に、HIV検査の焦点は、感染者を非常に早期に発見し、適切な医療措置を提供するとともに、他の人が感染するのを防ぐことにあります。
HIV診断の動向は、地域情勢、人口動態、予防対策、医療アクセスなどの要因によって形成された多様な状況を示しています。特に、予防・治療プログラムが充実しているいくつかの高所得国では、認知度の向上、検査の普及、治療アクセスの改善、曝露前予防薬(Pre-Exposure Prophylaxis:PrEP)などの予防戦略により、新たなHIV診断が減少しています。例えば、アジア太平洋経済協力開発機構(OECD)によると、2022年のHIV感染有病率は、バングラデシュ、モンゴル、ニュージーランド、スリランカでは15~49歳の成人の0.1%未満、2020年のタイでは15~49歳の成人の1%と、重要なばらつきがあります。HIV有病率は低いが、アジア太平洋の人口が多いため、2021年の報告国・地域のHIVとともに生きる人の絶対数は220万人以上と多かった。
HIVの予防と治療には進歩が見られるが、他の男性と性交渉を持つ男性(MSM)、トランスジェンダー、人種的マイノリティなど、一部の特定集団が依然として高いHIV診断率を報告していることに注意することが重要です。こうした格差は、ケアにおける不平等を浮き彫りにしています。同時に、薬物の注射やヘルスケアサービスへのアクセス困難などの要因によって、特定の集団や地域で新たなHIV流行が発生しています。また、サハラ以南のアフリカなど特定の地域では、十分な性教育が受けられず、医療へのアクセスも限られているため、若者は依然として脆弱です。
HIV診断市場は、モード、検査タイプ、最終用途、地域に区分されます。モード別では、市場は自己検査型とラボ型に分別されます。検査タイプ別では、市場は抗体/抗原検査、ウイルス負荷検査/核酸検査、CD4検査、乳児早期診断用検査に分別されます。抗体/抗原検査はさらに、HIV-1スクリーニング検査、HIV-1抗体確認検査、HIV-2 &Group Of診断検査に分別されます。エンドユース別では、市場は診断ラボ、病院&クリニック、家庭環境に分別されます。地域別では、HIV診断市場は北米、欧州、アジア太平洋、ラテンアメリカ・中東・アフリカに区分されます。
利害関係者にとっての主なメリット
- 当レポートでは、2022年から2032年までのHIV診断市場分析の市場セグメント、現在の動向、推定・動向分析、ダイナミクスを定量的に分析し、HIV診断市場の有力な市場機会を特定します。
- 市場促進要因、市場抑制要因、市場機会に関連する情報とともに市場調査を提供します。
- ポーターのファイブフォース分析では、利害関係者が利益重視のビジネス決定を下し、サプライヤーとバイヤーのネットワークを強化できるよう、バイヤーとサプライヤーのポテンシャルを強調します。
- HIV診断市場のセグメンテーションを詳細に分析することで、市場機会を見極めることができます。
- 各地域の主要国は、世界市場への収益貢献度に応じてマッピングされています。
- 市場プレイヤーのポジショニングはベンチマークを容易にし、市場プレイヤーの現在のポジションを明確に理解することができます。
- 本レポートには、地域別および世界のHIV診断市場動向、主要企業、市場セグメント、応用分野、市場成長戦略の分析が含まれています。
レポートカスタマイズの可能性(別途費用とスケジュールが必要です。)
- 顧客の関心に応じた企業プロファイルの追加
- 国別または地域別の追加分析-市場規模と予測
- 平均販売価格分析/プライスポイント分析
- クリスクロスセグメント分析-市場規模と予測
- 企業プロファイルの拡張リスト
- 過去の市場データ
- 主要プレーヤーの詳細(所在地、連絡先、サプライヤー/ベンダーネットワークなどを含む、エクセル形式)
- 世界/地域/国別レベルでのプレーヤーの市場シェア分析
- SWOT分析
目次
第1章 イントロダクション
第2章 エグゼクティブサマリー
第3章 市場概要
- 市場の定義と範囲
- 主な調査結果
- 影響要因
- 主な投資機会
- ポーターのファイブフォース分析
- 市場力学
- 促進要因
- 抑制要因
- 機会
第4章 HIV感染症診断市場:モード別
- 概要
- 自己検査
- ラボベース
第5章 HIV診断市場:検査タイプ別
- 概要
- 抗体/抗原検査
- 抗体/抗原検査タイプ別HIV診断市場
- ウイルス量検査/核酸検査
- CD4検査
- 乳児早期診断用検査
第6章 HIV診断市場:最終用途別
- 概要
- 診断研究所
- 病院および診療所
- 在宅環境
第7章 HIV診断市場:地域別
- 概要
- 北米
- 米国
- カナダ
- メキシコ
- 欧州
- ドイツ
- フランス
- 英国
- イタリア
- スペイン
- その他
- アジア太平洋
- 日本
- 中国
- オーストラリア
- インド
- 韓国
- その他
- ラテンアメリカ・中東・アフリカ
- ブラジル
- サウジアラビア
- 南アフリカ
- その他
第8章 競争情勢
- イントロダクション
- 主要成功戦略
- 主要10社の製品マッピング
- 競合ダッシュボード
- 競合ヒートマップ
- 主要企業のポジショニング、2022年
第9章 企業プロファイル
- Abbott Laboratories
- Gilead Sciences, Inc.
- Merck & Co. Inc.
- Danaher Corporation
- Mylan N.V.
- F Hoffman La Roche Ltd
- Siemens Healthcare Private Limited
- Qiagen NV.
- Bio-Rad Laboratories, Inc.
- Hologic Inc.
LIST OF TABLES
- TABLE 01. GLOBAL HIV DIAGNOSIS MARKET, BY MODE, 2022-2032 ($MILLION)
- TABLE 02. HIV DIAGNOSIS MARKET FOR SELF-TEST, BY REGION, 2022-2032 ($MILLION)
- TABLE 03. HIV DIAGNOSIS MARKET FOR LAB-BASED, BY REGION, 2022-2032 ($MILLION)
- TABLE 04. GLOBAL HIV DIAGNOSIS MARKET, BY TEST TYPE, 2022-2032 ($MILLION)
- TABLE 05. HIV DIAGNOSIS MARKET FOR ANTIBODY/ANTIGEN TEST, BY REGION, 2022-2032 ($MILLION)
- TABLE 06. GLOBAL ANTIBODY/ANTIGEN TEST HIV DIAGNOSIS MARKET, BY TYPE, 2022-2032 ($MILLION)
- TABLE 07. HIV DIAGNOSIS MARKET FOR VIRAL LOAD TEST/NUCLEIC ACID TEST, BY REGION, 2022-2032 ($MILLION)
- TABLE 08. HIV DIAGNOSIS MARKET FOR CD4 TEST, BY REGION, 2022-2032 ($MILLION)
- TABLE 09. HIV DIAGNOSIS MARKET FOR TEST FOR EARLY INFANT DIAGNOSIS, BY REGION, 2022-2032 ($MILLION)
- TABLE 10. GLOBAL HIV DIAGNOSIS MARKET, BY END-USE, 2022-2032 ($MILLION)
- TABLE 11. HIV DIAGNOSIS MARKET FOR DIAGNOSTIC LABORATORIES, BY REGION, 2022-2032 ($MILLION)
- TABLE 12. HIV DIAGNOSIS MARKET FOR HOSPITALS AND CLINICS, BY REGION, 2022-2032 ($MILLION)
- TABLE 13. HIV DIAGNOSIS MARKET FOR HOME SETTINGS, BY REGION, 2022-2032 ($MILLION)
- TABLE 14. HIV DIAGNOSIS MARKET, BY REGION, 2022-2032 ($MILLION)
- TABLE 15. NORTH AMERICA HIV DIAGNOSIS MARKET, BY MODE, 2022-2032 ($MILLION)
- TABLE 16. NORTH AMERICA HIV DIAGNOSIS MARKET, BY TEST TYPE, 2022-2032 ($MILLION)
- TABLE 17. NORTH AMERICA HIV DIAGNOSIS MARKET, BY END-USE, 2022-2032 ($MILLION)
- TABLE 18. NORTH AMERICA HIV DIAGNOSIS MARKET, BY COUNTRY, 2022-2032 ($MILLION)
- TABLE 19. U.S. HIV DIAGNOSIS MARKET, BY MODE, 2022-2032 ($MILLION)
- TABLE 20. U.S. HIV DIAGNOSIS MARKET, BY TEST TYPE, 2022-2032 ($MILLION)
- TABLE 21. U.S. HIV DIAGNOSIS MARKET, BY END-USE, 2022-2032 ($MILLION)
- TABLE 22. CANADA HIV DIAGNOSIS MARKET, BY MODE, 2022-2032 ($MILLION)
- TABLE 23. CANADA HIV DIAGNOSIS MARKET, BY TEST TYPE, 2022-2032 ($MILLION)
- TABLE 24. CANADA HIV DIAGNOSIS MARKET, BY END-USE, 2022-2032 ($MILLION)
- TABLE 25. MEXICO HIV DIAGNOSIS MARKET, BY MODE, 2022-2032 ($MILLION)
- TABLE 26. MEXICO HIV DIAGNOSIS MARKET, BY TEST TYPE, 2022-2032 ($MILLION)
- TABLE 27. MEXICO HIV DIAGNOSIS MARKET, BY END-USE, 2022-2032 ($MILLION)
- TABLE 28. EUROPE HIV DIAGNOSIS MARKET, BY MODE, 2022-2032 ($MILLION)
- TABLE 29. EUROPE HIV DIAGNOSIS MARKET, BY TEST TYPE, 2022-2032 ($MILLION)
- TABLE 30. EUROPE HIV DIAGNOSIS MARKET, BY END-USE, 2022-2032 ($MILLION)
- TABLE 31. EUROPE HIV DIAGNOSIS MARKET, BY COUNTRY, 2022-2032 ($MILLION)
- TABLE 32. GERMANY HIV DIAGNOSIS MARKET, BY MODE, 2022-2032 ($MILLION)
- TABLE 33. GERMANY HIV DIAGNOSIS MARKET, BY TEST TYPE, 2022-2032 ($MILLION)
- TABLE 34. GERMANY HIV DIAGNOSIS MARKET, BY END-USE, 2022-2032 ($MILLION)
- TABLE 35. FRANCE HIV DIAGNOSIS MARKET, BY MODE, 2022-2032 ($MILLION)
- TABLE 36. FRANCE HIV DIAGNOSIS MARKET, BY TEST TYPE, 2022-2032 ($MILLION)
- TABLE 37. FRANCE HIV DIAGNOSIS MARKET, BY END-USE, 2022-2032 ($MILLION)
- TABLE 38. UK HIV DIAGNOSIS MARKET, BY MODE, 2022-2032 ($MILLION)
- TABLE 39. UK HIV DIAGNOSIS MARKET, BY TEST TYPE, 2022-2032 ($MILLION)
- TABLE 40. UK HIV DIAGNOSIS MARKET, BY END-USE, 2022-2032 ($MILLION)
- TABLE 41. ITALY HIV DIAGNOSIS MARKET, BY MODE, 2022-2032 ($MILLION)
- TABLE 42. ITALY HIV DIAGNOSIS MARKET, BY TEST TYPE, 2022-2032 ($MILLION)
- TABLE 43. ITALY HIV DIAGNOSIS MARKET, BY END-USE, 2022-2032 ($MILLION)
- TABLE 44. SPAIN HIV DIAGNOSIS MARKET, BY MODE, 2022-2032 ($MILLION)
- TABLE 45. SPAIN HIV DIAGNOSIS MARKET, BY TEST TYPE, 2022-2032 ($MILLION)
- TABLE 46. SPAIN HIV DIAGNOSIS MARKET, BY END-USE, 2022-2032 ($MILLION)
- TABLE 47. REST OF EUROPE HIV DIAGNOSIS MARKET, BY MODE, 2022-2032 ($MILLION)
- TABLE 48. REST OF EUROPE HIV DIAGNOSIS MARKET, BY TEST TYPE, 2022-2032 ($MILLION)
- TABLE 49. REST OF EUROPE HIV DIAGNOSIS MARKET, BY END-USE, 2022-2032 ($MILLION)
- TABLE 50. ASIA-PACIFIC HIV DIAGNOSIS MARKET, BY MODE, 2022-2032 ($MILLION)
- TABLE 51. ASIA-PACIFIC HIV DIAGNOSIS MARKET, BY TEST TYPE, 2022-2032 ($MILLION)
- TABLE 52. ASIA-PACIFIC HIV DIAGNOSIS MARKET, BY END-USE, 2022-2032 ($MILLION)
- TABLE 53. ASIA-PACIFIC HIV DIAGNOSIS MARKET, BY COUNTRY, 2022-2032 ($MILLION)
- TABLE 54. JAPAN HIV DIAGNOSIS MARKET, BY MODE, 2022-2032 ($MILLION)
- TABLE 55. JAPAN HIV DIAGNOSIS MARKET, BY TEST TYPE, 2022-2032 ($MILLION)
- TABLE 56. JAPAN HIV DIAGNOSIS MARKET, BY END-USE, 2022-2032 ($MILLION)
- TABLE 57. CHINA HIV DIAGNOSIS MARKET, BY MODE, 2022-2032 ($MILLION)
- TABLE 58. CHINA HIV DIAGNOSIS MARKET, BY TEST TYPE, 2022-2032 ($MILLION)
- TABLE 59. CHINA HIV DIAGNOSIS MARKET, BY END-USE, 2022-2032 ($MILLION)
- TABLE 60. AUSTRALIA HIV DIAGNOSIS MARKET, BY MODE, 2022-2032 ($MILLION)
- TABLE 61. AUSTRALIA HIV DIAGNOSIS MARKET, BY TEST TYPE, 2022-2032 ($MILLION)
- TABLE 62. AUSTRALIA HIV DIAGNOSIS MARKET, BY END-USE, 2022-2032 ($MILLION)
- TABLE 63. INDIA HIV DIAGNOSIS MARKET, BY MODE, 2022-2032 ($MILLION)
- TABLE 64. INDIA HIV DIAGNOSIS MARKET, BY TEST TYPE, 2022-2032 ($MILLION)
- TABLE 65. INDIA HIV DIAGNOSIS MARKET, BY END-USE, 2022-2032 ($MILLION)
- TABLE 66. SOUTH KOREA HIV DIAGNOSIS MARKET, BY MODE, 2022-2032 ($MILLION)
- TABLE 67. SOUTH KOREA HIV DIAGNOSIS MARKET, BY TEST TYPE, 2022-2032 ($MILLION)
- TABLE 68. SOUTH KOREA HIV DIAGNOSIS MARKET, BY END-USE, 2022-2032 ($MILLION)
- TABLE 69. REST OF ASIA-PACIFIC HIV DIAGNOSIS MARKET, BY MODE, 2022-2032 ($MILLION)
- TABLE 70. REST OF ASIA-PACIFIC HIV DIAGNOSIS MARKET, BY TEST TYPE, 2022-2032 ($MILLION)
- TABLE 71. REST OF ASIA-PACIFIC HIV DIAGNOSIS MARKET, BY END-USE, 2022-2032 ($MILLION)
- TABLE 72. LAMEA HIV DIAGNOSIS MARKET, BY MODE, 2022-2032 ($MILLION)
- TABLE 73. LAMEA HIV DIAGNOSIS MARKET, BY TEST TYPE, 2022-2032 ($MILLION)
- TABLE 74. LAMEA HIV DIAGNOSIS MARKET, BY END-USE, 2022-2032 ($MILLION)
- TABLE 75. LAMEA HIV DIAGNOSIS MARKET, BY COUNTRY, 2022-2032 ($MILLION)
- TABLE 76. BRAZIL HIV DIAGNOSIS MARKET, BY MODE, 2022-2032 ($MILLION)
- TABLE 77. BRAZIL HIV DIAGNOSIS MARKET, BY TEST TYPE, 2022-2032 ($MILLION)
- TABLE 78. BRAZIL HIV DIAGNOSIS MARKET, BY END-USE, 2022-2032 ($MILLION)
- TABLE 79. SAUDI ARABIA HIV DIAGNOSIS MARKET, BY MODE, 2022-2032 ($MILLION)
- TABLE 80. SAUDI ARABIA HIV DIAGNOSIS MARKET, BY TEST TYPE, 2022-2032 ($MILLION)
- TABLE 81. SAUDI ARABIA HIV DIAGNOSIS MARKET, BY END-USE, 2022-2032 ($MILLION)
- TABLE 82. SOUTH AFRICA HIV DIAGNOSIS MARKET, BY MODE, 2022-2032 ($MILLION)
- TABLE 83. SOUTH AFRICA HIV DIAGNOSIS MARKET, BY TEST TYPE, 2022-2032 ($MILLION)
- TABLE 84. SOUTH AFRICA HIV DIAGNOSIS MARKET, BY END-USE, 2022-2032 ($MILLION)
- TABLE 85. REST OF LAMEA HIV DIAGNOSIS MARKET, BY MODE, 2022-2032 ($MILLION)
- TABLE 86. REST OF LAMEA HIV DIAGNOSIS MARKET, BY TEST TYPE, 2022-2032 ($MILLION)
- TABLE 87. REST OF LAMEA HIV DIAGNOSIS MARKET, BY END-USE, 2022-2032 ($MILLION)
- TABLE 88. ABBOTT LABORATORIES: KEY EXECUTIVES
- TABLE 89. ABBOTT LABORATORIES: COMPANY SNAPSHOT
- TABLE 90. ABBOTT LABORATORIES: PRODUCT SEGMENTS
- TABLE 91. ABBOTT LABORATORIES: SERVICE SEGMENTS
- TABLE 92. ABBOTT LABORATORIES: PRODUCT PORTFOLIO
- TABLE 93. ABBOTT LABORATORIES: KEY STRATERGIES
- TABLE 94. GILEAD SCIENCES, INC.: KEY EXECUTIVES
- TABLE 95. GILEAD SCIENCES, INC.: COMPANY SNAPSHOT
- TABLE 96. GILEAD SCIENCES, INC.: PRODUCT SEGMENTS
- TABLE 97. GILEAD SCIENCES, INC.: SERVICE SEGMENTS
- TABLE 98. GILEAD SCIENCES, INC.: PRODUCT PORTFOLIO
- TABLE 99. GILEAD SCIENCES, INC.: KEY STRATERGIES
- TABLE 100. MERCK & CO. INC.: KEY EXECUTIVES
- TABLE 101. MERCK & CO. INC.: COMPANY SNAPSHOT
- TABLE 102. MERCK & CO. INC.: PRODUCT SEGMENTS
- TABLE 103. MERCK & CO. INC.: SERVICE SEGMENTS
- TABLE 104. MERCK & CO. INC.: PRODUCT PORTFOLIO
- TABLE 105. MERCK & CO. INC.: KEY STRATERGIES
- TABLE 106. DANAHER CORPORATION: KEY EXECUTIVES
- TABLE 107. DANAHER CORPORATION: COMPANY SNAPSHOT
- TABLE 108. DANAHER CORPORATION: PRODUCT SEGMENTS
- TABLE 109. DANAHER CORPORATION: SERVICE SEGMENTS
- TABLE 110. DANAHER CORPORATION: PRODUCT PORTFOLIO
- TABLE 111. DANAHER CORPORATION: KEY STRATERGIES
- TABLE 112. MYLAN N.V.: KEY EXECUTIVES
- TABLE 113. MYLAN N.V.: COMPANY SNAPSHOT
- TABLE 114. MYLAN N.V.: PRODUCT SEGMENTS
- TABLE 115. MYLAN N.V.: SERVICE SEGMENTS
- TABLE 116. MYLAN N.V.: PRODUCT PORTFOLIO
- TABLE 117. MYLAN N.V.: KEY STRATERGIES
- TABLE 118. F HOFFMAN LA ROCHE LTD: KEY EXECUTIVES
- TABLE 119. F HOFFMAN LA ROCHE LTD: COMPANY SNAPSHOT
- TABLE 120. F HOFFMAN LA ROCHE LTD: PRODUCT SEGMENTS
- TABLE 121. F HOFFMAN LA ROCHE LTD: SERVICE SEGMENTS
- TABLE 122. F HOFFMAN LA ROCHE LTD: PRODUCT PORTFOLIO
- TABLE 123. F HOFFMAN LA ROCHE LTD: KEY STRATERGIES
- TABLE 124. SIEMENS HEALTHCARE PRIVATE LIMITED: KEY EXECUTIVES
- TABLE 125. SIEMENS HEALTHCARE PRIVATE LIMITED: COMPANY SNAPSHOT
- TABLE 126. SIEMENS HEALTHCARE PRIVATE LIMITED: PRODUCT SEGMENTS
- TABLE 127. SIEMENS HEALTHCARE PRIVATE LIMITED: SERVICE SEGMENTS
- TABLE 128. SIEMENS HEALTHCARE PRIVATE LIMITED: PRODUCT PORTFOLIO
- TABLE 129. SIEMENS HEALTHCARE PRIVATE LIMITED: KEY STRATERGIES
- TABLE 130. QIAGEN NV.: KEY EXECUTIVES
- TABLE 131. QIAGEN NV.: COMPANY SNAPSHOT
- TABLE 132. QIAGEN NV.: PRODUCT SEGMENTS
- TABLE 133. QIAGEN NV.: SERVICE SEGMENTS
- TABLE 134. QIAGEN NV.: PRODUCT PORTFOLIO
- TABLE 135. QIAGEN NV.: KEY STRATERGIES
- TABLE 136. BIO-RAD LABORATORIES, INC. : KEY EXECUTIVES
- TABLE 137. BIO-RAD LABORATORIES, INC. : COMPANY SNAPSHOT
- TABLE 138. BIO-RAD LABORATORIES, INC. : PRODUCT SEGMENTS
- TABLE 139. BIO-RAD LABORATORIES, INC. : SERVICE SEGMENTS
- TABLE 140. BIO-RAD LABORATORIES, INC. : PRODUCT PORTFOLIO
- TABLE 141. BIO-RAD LABORATORIES, INC. : KEY STRATERGIES
- TABLE 142. HOLOGIC INC.: KEY EXECUTIVES
- TABLE 143. HOLOGIC INC.: COMPANY SNAPSHOT
- TABLE 144. HOLOGIC INC.: PRODUCT SEGMENTS
- TABLE 145. HOLOGIC INC.: SERVICE SEGMENTS
- TABLE 146. HOLOGIC INC.: PRODUCT PORTFOLIO
- TABLE 147. HOLOGIC INC.: KEY STRATERGIES
LIST OF FIGURES
- FIGURE 01. HIV DIAGNOSIS MARKET, 2022-2032
- FIGURE 02. SEGMENTATION OF HIV DIAGNOSIS MARKET,2022-2032
- FIGURE 03. TOP IMPACTING FACTORS IN HIV DIAGNOSIS MARKET
- FIGURE 04. TOP INVESTMENT POCKETS IN HIV DIAGNOSIS MARKET (2023-2032)
- FIGURE 05. BARGAINING POWER OF SUPPLIERS
- FIGURE 06. BARGAINING POWER OF BUYERS
- FIGURE 07. THREAT OF SUBSTITUTION
- FIGURE 08. THREAT OF SUBSTITUTION
- FIGURE 09. COMPETITIVE RIVALRY
- FIGURE 10. GLOBAL HIV DIAGNOSIS MARKET:DRIVERS, RESTRAINTS AND OPPORTUNITIES
- FIGURE 11. HIV DIAGNOSIS MARKET, BY MODE, 2022 AND 2032(%)
- FIGURE 12. COMPARATIVE SHARE ANALYSIS OF HIV DIAGNOSIS MARKET FOR SELF-TEST, BY COUNTRY 2022 AND 2032(%)
- FIGURE 13. COMPARATIVE SHARE ANALYSIS OF HIV DIAGNOSIS MARKET FOR LAB-BASED, BY COUNTRY 2022 AND 2032(%)
- FIGURE 14. HIV DIAGNOSIS MARKET, BY TEST TYPE, 2022 AND 2032(%)
- FIGURE 15. COMPARATIVE SHARE ANALYSIS OF HIV DIAGNOSIS MARKET FOR ANTIBODY/ANTIGEN TEST, BY COUNTRY 2022 AND 2032(%)
- FIGURE 16. COMPARATIVE SHARE ANALYSIS OF HIV DIAGNOSIS MARKET FOR VIRAL LOAD TEST/NUCLEIC ACID TEST, BY COUNTRY 2022 AND 2032(%)
- FIGURE 17. COMPARATIVE SHARE ANALYSIS OF HIV DIAGNOSIS MARKET FOR CD4 TEST, BY COUNTRY 2022 AND 2032(%)
- FIGURE 18. COMPARATIVE SHARE ANALYSIS OF HIV DIAGNOSIS MARKET FOR TEST FOR EARLY INFANT DIAGNOSIS, BY COUNTRY 2022 AND 2032(%)
- FIGURE 19. HIV DIAGNOSIS MARKET, BY END-USE, 2022 AND 2032(%)
- FIGURE 20. COMPARATIVE SHARE ANALYSIS OF HIV DIAGNOSIS MARKET FOR DIAGNOSTIC LABORATORIES, BY COUNTRY 2022 AND 2032(%)
- FIGURE 21. COMPARATIVE SHARE ANALYSIS OF HIV DIAGNOSIS MARKET FOR HOSPITALS AND CLINICS, BY COUNTRY 2022 AND 2032(%)
- FIGURE 22. COMPARATIVE SHARE ANALYSIS OF HIV DIAGNOSIS MARKET FOR HOME SETTINGS, BY COUNTRY 2022 AND 2032(%)
- FIGURE 23. HIV DIAGNOSIS MARKET BY REGION, 2022 AND 2032(%)
- FIGURE 24. U.S. HIV DIAGNOSIS MARKET, 2022-2032 ($MILLION)
- FIGURE 25. CANADA HIV DIAGNOSIS MARKET, 2022-2032 ($MILLION)
- FIGURE 26. MEXICO HIV DIAGNOSIS MARKET, 2022-2032 ($MILLION)
- FIGURE 27. GERMANY HIV DIAGNOSIS MARKET, 2022-2032 ($MILLION)
- FIGURE 28. FRANCE HIV DIAGNOSIS MARKET, 2022-2032 ($MILLION)
- FIGURE 29. UK HIV DIAGNOSIS MARKET, 2022-2032 ($MILLION)
- FIGURE 30. ITALY HIV DIAGNOSIS MARKET, 2022-2032 ($MILLION)
- FIGURE 31. SPAIN HIV DIAGNOSIS MARKET, 2022-2032 ($MILLION)
- FIGURE 32. REST OF EUROPE HIV DIAGNOSIS MARKET, 2022-2032 ($MILLION)
- FIGURE 33. JAPAN HIV DIAGNOSIS MARKET, 2022-2032 ($MILLION)
- FIGURE 34. CHINA HIV DIAGNOSIS MARKET, 2022-2032 ($MILLION)
- FIGURE 35. AUSTRALIA HIV DIAGNOSIS MARKET, 2022-2032 ($MILLION)
- FIGURE 36. INDIA HIV DIAGNOSIS MARKET, 2022-2032 ($MILLION)
- FIGURE 37. SOUTH KOREA HIV DIAGNOSIS MARKET, 2022-2032 ($MILLION)
- FIGURE 38. REST OF ASIA-PACIFIC HIV DIAGNOSIS MARKET, 2022-2032 ($MILLION)
- FIGURE 39. BRAZIL HIV DIAGNOSIS MARKET, 2022-2032 ($MILLION)
- FIGURE 40. SAUDI ARABIA HIV DIAGNOSIS MARKET, 2022-2032 ($MILLION)
- FIGURE 41. SOUTH AFRICA HIV DIAGNOSIS MARKET, 2022-2032 ($MILLION)
- FIGURE 42. REST OF LAMEA HIV DIAGNOSIS MARKET, 2022-2032 ($MILLION)
- FIGURE 43. TOP WINNING STRATEGIES, BY YEAR
- FIGURE 44. TOP WINNING STRATEGIES, BY DEVELOPMENT
- FIGURE 45. TOP WINNING STRATEGIES, BY COMPANY
- FIGURE 46. PRODUCT MAPPING OF TOP 10 PLAYERS
- FIGURE 47. COMPETITIVE DASHBOARD
- FIGURE 48. COMPETITIVE HEATMAP: HIV DIAGNOSIS MARKET
- FIGURE 49. TOP PLAYER POSITIONING, 2022
The global HIV diagnosis market was valued at $1.9 billion in 2022, and is projected to reach $2.7 billion by 2032, growing at a CAGR of 3.9% from 2023 to 2032.
It is a procedure that determines if a person has contracted the Human Immunodeficiency Virus (HIV), a virus that leads to acquired immunodeficiency syndrome (AIDS). Several approaches and methodologies are used in HIV testing to establish whether an individual has HIV antibodies, antigens, or gene (RNA or DNA) in his blood volumes, saliva, and urine. Essentially, the focus of HIV testing is aimed at detecting infected persons very early, offering them relevant medical attention as well as preventing others from acquiring the infection.
Trends in HIV diagnosis exhibit a diverse landscape shaped by factors including geographical location, demographics, prevention measures, and healthcare accessibility. Notably, several high-income countries with robust prevention and treatment programs have witnessed a decline in new HIV diagnoses due to heightened awareness, widespread testing, improved treatment access, and preventive strategies such as Pre-exposure prophylaxis (PrEP). For instance, in 2022, according to Organization for Economic Cooperation and Development (OECD) in Asia-Pacific, the prevalence of HIV infection varied importantly, ranging from less than 0.1% of adults aged 15 to 49 in Bangladesh, Mongolia, New Zealand, and Sri Lanka to 1% of adults aged 15 to 49 in Thailand in 2020. Although HIV prevalence was low, the absolute number of people living with HIV was high at more than 2.2 million in reporting countries and territories in 2021, owing to Asia-Pacific's large population.
Although there have been advancements in the prevention and treatment of HIV, it is important to note that some specific populations such as men who have sexual intercourse with other men (MSM), transgender people, and racial minorities continue to report high rates of HIV diagnoses. These disparities underscore prevailing inequalities in care. At the same time, new HIV epidemics are emerging within certain populations or regions, owing to factors such as injecting drugs and difficulties in accessing healthcare services. Young people also remain vulnerable in certain areas such as sub-Saharan Africa as they lack adequate sex education and limited access to health care.
The HIV diagnosis market is segmented into mode, test type, end use, and region. By mode, the market is segregated into self-test and lab based. By test type the market is segregated into antibody/antigen test, viral load test/nucleic acid test, CD4 test, and test for early infant diagnosis. Antibody/antigen test is further segregated into HIV-1 screening tests, HIV-1 antibody confirmatory tests, and HIV-2 & Group Of diagnostic tests. By end use, the market is segregated into diagnostic laboratories, hospitals & clinics, and home settings. By region, the HIV diagnosis market is segmented into North America, Europe, Asia-Pacific, and LAMEA.
Major companies operating in this market include Abbott, Gilead Sciences, Inc., Merck & Co. Inc., Beckman Coulter, Inc., Mylan N.V., F. Hoffman-La Roche Ltd., Siemens Healthcare GmbH, QIAGEN, Bio-Rad Laboratories, Inc., and Hologic. Key players have adopted product launch and collaboration as their key strategy to improve the product portfolio of the testosterone replacement therapy market.
Key Benefits For Stakeholders
- This report provides a quantitative analysis of the market segments, current trends, estimations, and dynamics of the hiv diagnosis market analysis from 2022 to 2032 to identify the prevailing hiv diagnosis market opportunities.
- The market research is offered along with information related to key drivers, restraints, and opportunities.
- Porter's five forces analysis highlights the potency of buyers and suppliers to enable stakeholders make profit-oriented business decisions and strengthen their supplier-buyer network.
- In-depth analysis of the hiv diagnosis market segmentation assists to determine the prevailing market opportunities.
- Major countries in each region are mapped according to their revenue contribution to the global market.
- Market player positioning facilitates benchmarking and provides a clear understanding of the present position of the market players.
- The report includes the analysis of the regional as well as global hiv diagnosis market trends, key players, market segments, application areas, and market growth strategies.
Additional benefits you will get with this purchase are:
- Quarterly Update and* (only available with a corporate license, on listed price)
- 5 additional Company Profile of client Choice pre- or Post-purchase, as a free update.
- Free Upcoming Version on the Purchase of Five and Enterprise User License.
- 16 analyst hours of support* (post-purchase, if you find additional data requirements upon review of the report, you may receive support amounting to 16 analyst hours to solve questions, and post-sale queries)
- 15% Free Customization* (in case the scope or segment of the report does not match your requirements, 15% is equivalent to 3 working days of free work, applicable once)
- Free data Pack on the Five and Enterprise User License. (Excel version of the report)
- Free Updated report if the report is 6-12 months old or older.
- 24-hour priority response*
- Free Industry updates and white papers.
Possible Customization with this report (with additional cost and timeline, please talk to the sales executive to know more)
- Additional company profiles with specific to client's interest
- Additional country or region analysis- market size and forecast
- Average Selling Price Analysis / Price Point Analysis
- Criss-cross segment analysis- market size and forecast
- Expanded list for Company Profiles
- Historic market data
- Key player details (including location, contact details, supplier/vendor network etc. in excel format)
- Market share analysis of players at global/region/country level
- SWOT Analysis
Key Market Segments
By Mode
- Self-test
- Lab-based
By Test Type
- Antibody/Antigen Test
- Type
- HIV-1 Screening Tests
- HIV-1 Antibody Confirmatory Tests
- HIV-2 and Group O Diagnostic Tests
- Viral load test/Nucleic Acid Test
- CD4 test
- Test for Early Infant Diagnosis
By End-use
- Diagnostic Laboratories
- Hospitals and Clinics
- Home Settings
By Region
- North America
- U.S.
- Canada
- Mexico
- Europe
- Germany
- France
- UK
- Italy
- Spain
- Rest of Europe
- Asia-Pacific
- Japan
- China
- Australia
- India
- South Korea
- Rest of Asia-Pacific
- LAMEA
- Brazil
- Saudi Arabia
- South Africa
- Rest of LAMEA
Key Market Players:
- Abbott Laboratories
- Gilead Sciences, Inc.
- Merck & Co. Inc.
- Danaher Corporation
- Mylan N.V.
- F Hoffman La Roche Ltd
- Siemens Healthcare Private Limited
- Qiagen NV.
- Bio-Rad Laboratories, Inc.
- Hologic Inc.
TABLE OF CONTENTS
CHAPTER 1: INTRODUCTION
- 1.1. Report description
- 1.2. Key market segments
- 1.3. Key benefits to the stakeholders
- 1.4. Research methodology
- 1.4.1. Primary research
- 1.4.2. Secondary research
- 1.4.3. Analyst tools and models
CHAPTER 2: EXECUTIVE SUMMARY
- 2.1. CXO perspective
CHAPTER 3: MARKET OVERVIEW
- 3.1. Market definition and scope
- 3.2. Key findings
- 3.2.1. Top impacting factors
- 3.2.2. Top investment pockets
- 3.3. Porter's five forces analysis
- 3.4. Market dynamics
- 3.4.1. Drivers
- 3.4.2. Restraints
- 3.4.3. Opportunities
CHAPTER 4: HIV DIAGNOSIS MARKET, BY MODE
- 4.1. Overview
- 4.1.1. Market size and forecast
- 4.2. Self-test
- 4.2.1. Key market trends, growth factors and opportunities
- 4.2.2. Market size and forecast, by region
- 4.2.3. Market share analysis by country
- 4.3. Lab-based
- 4.3.1. Key market trends, growth factors and opportunities
- 4.3.2. Market size and forecast, by region
- 4.3.3. Market share analysis by country
CHAPTER 5: HIV DIAGNOSIS MARKET, BY TEST TYPE
- 5.1. Overview
- 5.1.1. Market size and forecast
- 5.2. Antibody/Antigen Test
- 5.2.1. Key market trends, growth factors and opportunities
- 5.2.2. Market size and forecast, by region
- 5.2.3. Market share analysis by country
- 5.2.4. Antibody/Antigen Test HIV Diagnosis Market by Type
- 5.3. Viral load test/Nucleic Acid Test
- 5.3.1. Key market trends, growth factors and opportunities
- 5.3.2. Market size and forecast, by region
- 5.3.3. Market share analysis by country
- 5.4. CD4 test
- 5.4.1. Key market trends, growth factors and opportunities
- 5.4.2. Market size and forecast, by region
- 5.4.3. Market share analysis by country
- 5.5. Test for Early Infant Diagnosis
- 5.5.1. Key market trends, growth factors and opportunities
- 5.5.2. Market size and forecast, by region
- 5.5.3. Market share analysis by country
CHAPTER 6: HIV DIAGNOSIS MARKET, BY END-USE
- 6.1. Overview
- 6.1.1. Market size and forecast
- 6.2. Diagnostic Laboratories
- 6.2.1. Key market trends, growth factors and opportunities
- 6.2.2. Market size and forecast, by region
- 6.2.3. Market share analysis by country
- 6.3. Hospitals and Clinics
- 6.3.1. Key market trends, growth factors and opportunities
- 6.3.2. Market size and forecast, by region
- 6.3.3. Market share analysis by country
- 6.4. Home Settings
- 6.4.1. Key market trends, growth factors and opportunities
- 6.4.2. Market size and forecast, by region
- 6.4.3. Market share analysis by country
CHAPTER 7: HIV DIAGNOSIS MARKET, BY REGION
- 7.1. Overview
- 7.1.1. Market size and forecast By Region
- 7.2. North America
- 7.2.1. Key market trends, growth factors and opportunities
- 7.2.2. Market size and forecast, by Mode
- 7.2.3. Market size and forecast, by Test Type
- 7.2.4. Market size and forecast, by End-use
- 7.2.5. Market size and forecast, by country
- 7.2.5.1. U.S.
- 7.2.5.1.1. Market size and forecast, by Mode
- 7.2.5.1.2. Market size and forecast, by Test Type
- 7.2.5.1.3. Market size and forecast, by End-use
- 7.2.5.2. Canada
- 7.2.5.2.1. Market size and forecast, by Mode
- 7.2.5.2.2. Market size and forecast, by Test Type
- 7.2.5.2.3. Market size and forecast, by End-use
- 7.2.5.3. Mexico
- 7.2.5.3.1. Market size and forecast, by Mode
- 7.2.5.3.2. Market size and forecast, by Test Type
- 7.2.5.3.3. Market size and forecast, by End-use
- 7.3. Europe
- 7.3.1. Key market trends, growth factors and opportunities
- 7.3.2. Market size and forecast, by Mode
- 7.3.3. Market size and forecast, by Test Type
- 7.3.4. Market size and forecast, by End-use
- 7.3.5. Market size and forecast, by country
- 7.3.5.1. Germany
- 7.3.5.1.1. Market size and forecast, by Mode
- 7.3.5.1.2. Market size and forecast, by Test Type
- 7.3.5.1.3. Market size and forecast, by End-use
- 7.3.5.2. France
- 7.3.5.2.1. Market size and forecast, by Mode
- 7.3.5.2.2. Market size and forecast, by Test Type
- 7.3.5.2.3. Market size and forecast, by End-use
- 7.3.5.3. UK
- 7.3.5.3.1. Market size and forecast, by Mode
- 7.3.5.3.2. Market size and forecast, by Test Type
- 7.3.5.3.3. Market size and forecast, by End-use
- 7.3.5.4. Italy
- 7.3.5.4.1. Market size and forecast, by Mode
- 7.3.5.4.2. Market size and forecast, by Test Type
- 7.3.5.4.3. Market size and forecast, by End-use
- 7.3.5.5. Spain
- 7.3.5.5.1. Market size and forecast, by Mode
- 7.3.5.5.2. Market size and forecast, by Test Type
- 7.3.5.5.3. Market size and forecast, by End-use
- 7.3.5.6. Rest of Europe
- 7.3.5.6.1. Market size and forecast, by Mode
- 7.3.5.6.2. Market size and forecast, by Test Type
- 7.3.5.6.3. Market size and forecast, by End-use
- 7.4. Asia-Pacific
- 7.4.1. Key market trends, growth factors and opportunities
- 7.4.2. Market size and forecast, by Mode
- 7.4.3. Market size and forecast, by Test Type
- 7.4.4. Market size and forecast, by End-use
- 7.4.5. Market size and forecast, by country
- 7.4.5.1. Japan
- 7.4.5.1.1. Market size and forecast, by Mode
- 7.4.5.1.2. Market size and forecast, by Test Type
- 7.4.5.1.3. Market size and forecast, by End-use
- 7.4.5.2. China
- 7.4.5.2.1. Market size and forecast, by Mode
- 7.4.5.2.2. Market size and forecast, by Test Type
- 7.4.5.2.3. Market size and forecast, by End-use
- 7.4.5.3. Australia
- 7.4.5.3.1. Market size and forecast, by Mode
- 7.4.5.3.2. Market size and forecast, by Test Type
- 7.4.5.3.3. Market size and forecast, by End-use
- 7.4.5.4. India
- 7.4.5.4.1. Market size and forecast, by Mode
- 7.4.5.4.2. Market size and forecast, by Test Type
- 7.4.5.4.3. Market size and forecast, by End-use
- 7.4.5.5. South Korea
- 7.4.5.5.1. Market size and forecast, by Mode
- 7.4.5.5.2. Market size and forecast, by Test Type
- 7.4.5.5.3. Market size and forecast, by End-use
- 7.4.5.6. Rest of Asia-Pacific
- 7.4.5.6.1. Market size and forecast, by Mode
- 7.4.5.6.2. Market size and forecast, by Test Type
- 7.4.5.6.3. Market size and forecast, by End-use
- 7.5. LAMEA
- 7.5.1. Key market trends, growth factors and opportunities
- 7.5.2. Market size and forecast, by Mode
- 7.5.3. Market size and forecast, by Test Type
- 7.5.4. Market size and forecast, by End-use
- 7.5.5. Market size and forecast, by country
- 7.5.5.1. Brazil
- 7.5.5.1.1. Market size and forecast, by Mode
- 7.5.5.1.2. Market size and forecast, by Test Type
- 7.5.5.1.3. Market size and forecast, by End-use
- 7.5.5.2. Saudi Arabia
- 7.5.5.2.1. Market size and forecast, by Mode
- 7.5.5.2.2. Market size and forecast, by Test Type
- 7.5.5.2.3. Market size and forecast, by End-use
- 7.5.5.3. South Africa
- 7.5.5.3.1. Market size and forecast, by Mode
- 7.5.5.3.2. Market size and forecast, by Test Type
- 7.5.5.3.3. Market size and forecast, by End-use
- 7.5.5.4. Rest of LAMEA
- 7.5.5.4.1. Market size and forecast, by Mode
- 7.5.5.4.2. Market size and forecast, by Test Type
- 7.5.5.4.3. Market size and forecast, by End-use
CHAPTER 8: COMPETITIVE LANDSCAPE
- 8.1. Introduction
- 8.2. Top winning strategies
- 8.3. Product mapping of top 10 player
- 8.4. Competitive dashboard
- 8.5. Competitive heatmap
- 8.6. Top player positioning, 2022
CHAPTER 9: COMPANY PROFILES
- 9.1. Abbott Laboratories
- 9.1.1. Company overview
- 9.1.2. Key executives
- 9.1.3. Company snapshot
- 9.1.4. Operating business segments
- 9.1.5. Product portfolio
- 9.1.6. Business performance
- 9.1.7. Key strategic moves and developments
- 9.2. Gilead Sciences, Inc.
- 9.2.1. Company overview
- 9.2.2. Key executives
- 9.2.3. Company snapshot
- 9.2.4. Operating business segments
- 9.2.5. Product portfolio
- 9.2.6. Business performance
- 9.2.7. Key strategic moves and developments
- 9.3. Merck & Co. Inc.
- 9.3.1. Company overview
- 9.3.2. Key executives
- 9.3.3. Company snapshot
- 9.3.4. Operating business segments
- 9.3.5. Product portfolio
- 9.3.6. Business performance
- 9.3.7. Key strategic moves and developments
- 9.4. Danaher Corporation
- 9.4.1. Company overview
- 9.4.2. Key executives
- 9.4.3. Company snapshot
- 9.4.4. Operating business segments
- 9.4.5. Product portfolio
- 9.4.6. Business performance
- 9.4.7. Key strategic moves and developments
- 9.5. Mylan N.V.
- 9.5.1. Company overview
- 9.5.2. Key executives
- 9.5.3. Company snapshot
- 9.5.4. Operating business segments
- 9.5.5. Product portfolio
- 9.5.6. Business performance
- 9.5.7. Key strategic moves and developments
- 9.6. F Hoffman La Roche Ltd
- 9.6.1. Company overview
- 9.6.2. Key executives
- 9.6.3. Company snapshot
- 9.6.4. Operating business segments
- 9.6.5. Product portfolio
- 9.6.6. Business performance
- 9.6.7. Key strategic moves and developments
- 9.7. Siemens Healthcare Private Limited
- 9.7.1. Company overview
- 9.7.2. Key executives
- 9.7.3. Company snapshot
- 9.7.4. Operating business segments
- 9.7.5. Product portfolio
- 9.7.6. Business performance
- 9.7.7. Key strategic moves and developments
- 9.8. Qiagen NV.
- 9.8.1. Company overview
- 9.8.2. Key executives
- 9.8.3. Company snapshot
- 9.8.4. Operating business segments
- 9.8.5. Product portfolio
- 9.8.6. Business performance
- 9.8.7. Key strategic moves and developments
- 9.9. Bio-Rad Laboratories, Inc.
- 9.9.1. Company overview
- 9.9.2. Key executives
- 9.9.3. Company snapshot
- 9.9.4. Operating business segments
- 9.9.5. Product portfolio
- 9.9.6. Business performance
- 9.9.7. Key strategic moves and developments
- 9.10. Hologic Inc.
- 9.10.1. Company overview
- 9.10.2. Key executives
- 9.10.3. Company snapshot
- 9.10.4. Operating business segments
- 9.10.5. Product portfolio
- 9.10.6. Business performance
- 9.10.7. Key strategic moves and developments
