
|
市場調査レポート
商品コード
1447183
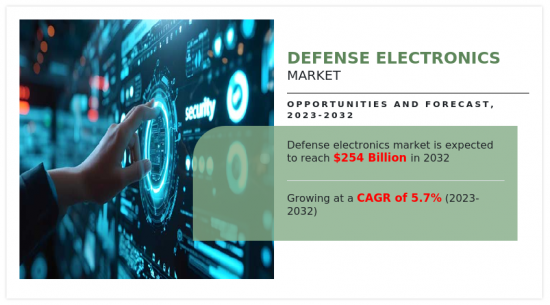
防衛用エレクトロニクス市場:プラットフォーム別、業界別、2023年~2032年の世界機会分析と産業予測Defense Electronics Market By Platform (Airborne, Space, Land, Marine), By Vertical (Optronics, Communication and Display, C4ISR, Electronic Warfare, Radar, Navigation): Global Opportunity Analysis and Industry Forecast, 2023-2032 |
||||||
|
|||||||

| 防衛用エレクトロニクス市場:プラットフォーム別、業界別、2023年~2032年の世界機会分析と産業予測 |
|
出版日: 2024年01月30日
発行: Allied Market Research
ページ情報: 英文 314 Pages
納期: 2~3営業日
|

- 全表示
- 概要
- 図表
- 目次
防衛用エレクトロニクスとは、国防における技術的優位性のために特別に設計された電子部品およびシステムを指します。
統合防衛技術がより広く使われるようになるにつれ、市場はさらに成長すると予想されます。統合防衛技術を用いた包括的な防衛システムを形成するために、いくつかのシステムや技術が統合されます。サイバー防衛、自動化、接続性、センサーなどは、こうした技術の一例です。統合は、防衛システム間の状況認識、意思決定、通信の強化を通じて、情報を効果的に共有し、防衛力を高めることを可能にします。
さらに、配備の改善とコスト削減により、統合防衛技術はコスト削減と効率の向上にもつながります。柔軟性と運用保護に対する要求の高まりにより、今後数年間は衝突回避技術の採用が増加し、防衛用エレクトロニクスの需要を牽引すると予想されます。
防衛用エレクトロニクスの世界市場は、COVID-19パンデミックの影響を受け、サプライチェーンと生産手順に障害が生じた。市場力学は、需要の変動と経済の不確実性によって影響を受けた。こうした障害にもかかわらず、防衛産業が防衛要員のために航空機、陸上車両、海上車両の購入への投資を増やしたため、市場は急速に回復しました。
産業界や主要企業は、輸送の安全性と信頼性の向上に積極的に取り組んでいます。その結果、民間航空部門は大きな成長を遂げました。ボーイングの2020年から2039年までの民間航空市場予測によると、航空輸送量は4%以上拡大し、アジア太平洋地域が成長をリードしています。また、7つの地域にわたって43,110機の民間航空機が新たに納入されると予測されており、アジア太平洋地域で最も多くの納入が見込まれています。このような市場開拓は、指定された期間を通じて、この分野とジェットエンジン市場の成長を促進すると予測されます。さらに、航空力学、材料科学、製造の分野における技術開発が、より強力で効率的なターボファンエンジンの開発を後押ししています。メーカーは、炭素排出量と騒音レベルを制限するエンジンの開発に投資しています。ハイブリッド電気推進技術や持続可能な航空燃料の人気が高まっているのは、より環境に配慮した、環境に優しい空の旅への業界のコミットメントを反映しています。さらに、定評ある航空宇宙企業と新進気鋭の企業との継続的なパートナーシップは、絶え間ない技術革新に拍車をかけています。ジェットエンジンの世界は変化しており、環境負荷の低減、エネルギー効率の向上、代替推進源の研究といった取り組みが、航空技術の方向性に影響を与えています。
燃料効率の高いエンジンへの需要が急増する中、燃料価格の上昇や環境問題への関心の高まりに伴い、業界では燃料効率の向上と低排出ガスを実現するジェットエンジンへの需要が急増しています。最先端のジェットエンジン設計などのエンジン設計における技術開発は、技術革新への揺るぎない探求のために導入されてきました。このような開発には、より軽量な素材、より優れた機能性、信頼性の向上などが含まれます。
インド政府は過去3年半の間に、国内防衛生産、技術進歩、防衛輸出能力を向上させるため、いくつかの政策に基づく施策を実施してきました。インドの「メイド・イン・インディア」イニシアチブは、防衛装備品の現地生産を中心に展開されています。最近の国防調達手続きの変更、民進党の新戦略パートナーシップ政策、オフセット政策、簡素化された「Make II」イニシアティブ、EODBイニシアティブ、産業ライセンス申請プロセスの強化はすべて、国内外のプレーヤーがMake in Indiaの可能性を生かすためのさまざまな手段を検討する動機となっています。インド国内での国防製造の推進は、国際的な防衛企業が革新的な即興技術を応用することでつかむことのできるチャンスを示しています。
市場成長を後押しする主な要因としては、通信・通信セキュリティシステムへの依存度が高まり、サイバーセキュリティが大きな関心事となっていることが挙げられます。ハードウェアシステムは、サイバー脅威からシステムを保護し、データの完全性を確保するハードウェアセキュリティと強力な暗号化システムの必要性によって推進されています。
防衛用エレクトロニクス市場は、垂直、プラットフォーム、地域に区分されます。業種別では、C4ISR、ナビゲーション、通信・ディスプレイ、電子戦、レーダー、オプトロニクスに分けられます。プラットフォーム別では、市場は空中、陸上、宇宙、海洋に分類されます。地域別では、北米(米国、カナダ、メキシコ)、欧州(英国、ドイツ、フランス、ロシア、イタリア、スペイン、その他欧州地域)、アジア太平洋(中国、インド、日本、オーストラリア、韓国、その他アジア太平洋地域)、ラテンアメリカ(中南米、中東・アフリカ)で防衛用エレクトロニクス市場の動向が分析されています。
利害関係者にとっての主なメリット
- 当レポートでは、2022年から2032年にかけての防衛用エレクトロニクス市場分析の市場セグメント、現在の動向、推定・動向分析、ダイナミクスを定量的に分析し、防衛用エレクトロニクス市場の有力な機会を特定します。
- 市場促進要因、市場抑制要因、市場機会に関連する情報とともに市場調査を提供します。
- ポーターのファイブフォース分析では、利害関係者が利益重視のビジネス決定を下し、サプライヤーとバイヤーのネットワークを強化できるよう、バイヤーとサプライヤーの潜在力を明らかにします。
- 防衛用エレクトロニクス市場のセグメンテーションを詳細に分析することで、市場機会を見極めることができます。
- 各地域の主要国は、世界市場への収益貢献度に応じてマッピングされています。
- 市場プレイヤーのポジショニングは、ベンチマーキングを容易にし、市場プレイヤーの現在のポジションの明確な理解を提供します。
- 本レポートには、地域および世界の防衛用エレクトロニクス市場動向、主要企業、市場セグメント、応用分野、市場成長戦略の分析が含まれています。
レポートカスタマイズの可能性(別途費用とスケジュールが必要です。)
- 地域別の新規参入企業
- 顧客の関心に応じた企業プロファイルの追加
- 国別または地域別の追加分析-市場規模と予測
- 過去の市場データ
目次
第1章 イントロダクション
第2章 エグゼクティブサマリー
第3章 市場概要
- 市場の定義と範囲
- 主な調査結果
- 影響要因
- 主な投資機会
- ポーターのファイブフォース分析
- 市場力学
- 促進要因
- 抑制要因
- 機会
第4章 防衛用エレクトロニクス市場:プラットフォーム別
- 概要
- 航空機
- 宇宙
- 陸上
- 海上
第5章 防衛用エレクトロニクス市場:業界別
- 概要
- オプトロニクス
- 通信・ディスプレイ
- C4ISR
- 電子戦
- レーダー
- ナビゲーション
第6章 防衛用エレクトロニクス市場:地域別
- 概要
- 北米
- 米国
- カナダ
- メキシコ
- 欧州
- 英国
- ドイツ
- フランス
- ロシア
- イタリア
- スペイン
- その他
- アジア太平洋
- 中国
- インド
- 日本
- オーストラリア
- 韓国
- その他
- ラテンアメリカ
- ラテンアメリカ
- 中東
- アフリカ
第7章 競合情勢
- イントロダクション
- 主要成功戦略
- 主要10社の製品マッピング
- 競合ダッシュボード
- 競合ヒートマップ
- 主要企業のポジショニング、2022年
第8章 企業プロファイル
- Lockhead Martin Corporation
- North Grumman Corporation
- Raytheon Technologies Corporation
- Thales Group
- BAE Systems
- Aselsan A.S.
- Curtis Wright Corporation
- L3 Harris Technologies
- Boeing
- Teledyne Defense Electronics
LIST OF TABLES
- TABLE 01. GLOBAL DEFENSE ELECTRONICS MARKET, BY PLATFORM, 2022-2032 ($BILLION)
- TABLE 02. DEFENSE ELECTRONICS MARKET FOR AIRBORNE, BY REGION, 2022-2032 ($BILLION)
- TABLE 03. DEFENSE ELECTRONICS MARKET FOR SPACE, BY REGION, 2022-2032 ($BILLION)
- TABLE 04. DEFENSE ELECTRONICS MARKET FOR LAND, BY REGION, 2022-2032 ($BILLION)
- TABLE 05. DEFENSE ELECTRONICS MARKET FOR MARINE, BY REGION, 2022-2032 ($BILLION)
- TABLE 06. GLOBAL DEFENSE ELECTRONICS MARKET, BY VERTICAL, 2022-2032 ($BILLION)
- TABLE 07. DEFENSE ELECTRONICS MARKET FOR OPTRONICS, BY REGION, 2022-2032 ($BILLION)
- TABLE 08. DEFENSE ELECTRONICS MARKET FOR COMMUNICATION AND DISPLAY, BY REGION, 2022-2032 ($BILLION)
- TABLE 09. DEFENSE ELECTRONICS MARKET FOR C4ISR, BY REGION, 2022-2032 ($BILLION)
- TABLE 10. DEFENSE ELECTRONICS MARKET FOR ELECTRONIC WARFARE, BY REGION, 2022-2032 ($BILLION)
- TABLE 11. DEFENSE ELECTRONICS MARKET FOR RADAR, BY REGION, 2022-2032 ($BILLION)
- TABLE 12. DEFENSE ELECTRONICS MARKET FOR NAVIGATION, BY REGION, 2022-2032 ($BILLION)
- TABLE 13. DEFENSE ELECTRONICS MARKET, BY REGION, 2022-2032 ($BILLION)
- TABLE 14. NORTH AMERICA DEFENSE ELECTRONICS MARKET, BY PLATFORM, 2022-2032 ($BILLION)
- TABLE 15. NORTH AMERICA DEFENSE ELECTRONICS MARKET, BY VERTICAL, 2022-2032 ($BILLION)
- TABLE 16. NORTH AMERICA DEFENSE ELECTRONICS MARKET, BY COUNTRY, 2022-2032 ($BILLION)
- TABLE 17. U.S. DEFENSE ELECTRONICS MARKET, BY PLATFORM, 2022-2032 ($BILLION)
- TABLE 18. U.S. DEFENSE ELECTRONICS MARKET, BY VERTICAL, 2022-2032 ($BILLION)
- TABLE 19. CANADA DEFENSE ELECTRONICS MARKET, BY PLATFORM, 2022-2032 ($BILLION)
- TABLE 20. CANADA DEFENSE ELECTRONICS MARKET, BY VERTICAL, 2022-2032 ($BILLION)
- TABLE 21. MEXICO DEFENSE ELECTRONICS MARKET, BY PLATFORM, 2022-2032 ($BILLION)
- TABLE 22. MEXICO DEFENSE ELECTRONICS MARKET, BY VERTICAL, 2022-2032 ($BILLION)
- TABLE 23. EUROPE DEFENSE ELECTRONICS MARKET, BY PLATFORM, 2022-2032 ($BILLION)
- TABLE 24. EUROPE DEFENSE ELECTRONICS MARKET, BY VERTICAL, 2022-2032 ($BILLION)
- TABLE 25. EUROPE DEFENSE ELECTRONICS MARKET, BY COUNTRY, 2022-2032 ($BILLION)
- TABLE 26. UK DEFENSE ELECTRONICS MARKET, BY PLATFORM, 2022-2032 ($BILLION)
- TABLE 27. UK DEFENSE ELECTRONICS MARKET, BY VERTICAL, 2022-2032 ($BILLION)
- TABLE 28. GERMANY DEFENSE ELECTRONICS MARKET, BY PLATFORM, 2022-2032 ($BILLION)
- TABLE 29. GERMANY DEFENSE ELECTRONICS MARKET, BY VERTICAL, 2022-2032 ($BILLION)
- TABLE 30. FRANCE DEFENSE ELECTRONICS MARKET, BY PLATFORM, 2022-2032 ($BILLION)
- TABLE 31. FRANCE DEFENSE ELECTRONICS MARKET, BY VERTICAL, 2022-2032 ($BILLION)
- TABLE 32. RUSSIA DEFENSE ELECTRONICS MARKET, BY PLATFORM, 2022-2032 ($BILLION)
- TABLE 33. RUSSIA DEFENSE ELECTRONICS MARKET, BY VERTICAL, 2022-2032 ($BILLION)
- TABLE 34. ITALY DEFENSE ELECTRONICS MARKET, BY PLATFORM, 2022-2032 ($BILLION)
- TABLE 35. ITALY DEFENSE ELECTRONICS MARKET, BY VERTICAL, 2022-2032 ($BILLION)
- TABLE 36. SPAIN DEFENSE ELECTRONICS MARKET, BY PLATFORM, 2022-2032 ($BILLION)
- TABLE 37. SPAIN DEFENSE ELECTRONICS MARKET, BY VERTICAL, 2022-2032 ($BILLION)
- TABLE 38. REST OF EUROPE DEFENSE ELECTRONICS MARKET, BY PLATFORM, 2022-2032 ($BILLION)
- TABLE 39. REST OF EUROPE DEFENSE ELECTRONICS MARKET, BY VERTICAL, 2022-2032 ($BILLION)
- TABLE 40. ASIA-PACIFIC DEFENSE ELECTRONICS MARKET, BY PLATFORM, 2022-2032 ($BILLION)
- TABLE 41. ASIA-PACIFIC DEFENSE ELECTRONICS MARKET, BY VERTICAL, 2022-2032 ($BILLION)
- TABLE 42. ASIA-PACIFIC DEFENSE ELECTRONICS MARKET, BY COUNTRY, 2022-2032 ($BILLION)
- TABLE 43. CHINA DEFENSE ELECTRONICS MARKET, BY PLATFORM, 2022-2032 ($BILLION)
- TABLE 44. CHINA DEFENSE ELECTRONICS MARKET, BY VERTICAL, 2022-2032 ($BILLION)
- TABLE 45. INDIA DEFENSE ELECTRONICS MARKET, BY PLATFORM, 2022-2032 ($BILLION)
- TABLE 46. INDIA DEFENSE ELECTRONICS MARKET, BY VERTICAL, 2022-2032 ($BILLION)
- TABLE 47. JAPAN DEFENSE ELECTRONICS MARKET, BY PLATFORM, 2022-2032 ($BILLION)
- TABLE 48. JAPAN DEFENSE ELECTRONICS MARKET, BY VERTICAL, 2022-2032 ($BILLION)
- TABLE 49. AUSTRALIA DEFENSE ELECTRONICS MARKET, BY PLATFORM, 2022-2032 ($BILLION)
- TABLE 50. AUSTRALIA DEFENSE ELECTRONICS MARKET, BY VERTICAL, 2022-2032 ($BILLION)
- TABLE 51. SOUTH KOREA DEFENSE ELECTRONICS MARKET, BY PLATFORM, 2022-2032 ($BILLION)
- TABLE 52. SOUTH KOREA DEFENSE ELECTRONICS MARKET, BY VERTICAL, 2022-2032 ($BILLION)
- TABLE 53. REST OF ASIA-PACIFIC DEFENSE ELECTRONICS MARKET, BY PLATFORM, 2022-2032 ($BILLION)
- TABLE 54. REST OF ASIA-PACIFIC DEFENSE ELECTRONICS MARKET, BY VERTICAL, 2022-2032 ($BILLION)
- TABLE 55. LAMEA DEFENSE ELECTRONICS MARKET, BY PLATFORM, 2022-2032 ($BILLION)
- TABLE 56. LAMEA DEFENSE ELECTRONICS MARKET, BY VERTICAL, 2022-2032 ($BILLION)
- TABLE 57. LAMEA DEFENSE ELECTRONICS MARKET, BY COUNTRY, 2022-2032 ($BILLION)
- TABLE 58. LATIN AMERICA DEFENSE ELECTRONICS MARKET, BY PLATFORM, 2022-2032 ($BILLION)
- TABLE 59. LATIN AMERICA DEFENSE ELECTRONICS MARKET, BY VERTICAL, 2022-2032 ($BILLION)
- TABLE 60. MIDDLE EAST DEFENSE ELECTRONICS MARKET, BY PLATFORM, 2022-2032 ($BILLION)
- TABLE 61. MIDDLE EAST DEFENSE ELECTRONICS MARKET, BY VERTICAL, 2022-2032 ($BILLION)
- TABLE 62. AFRICA DEFENSE ELECTRONICS MARKET, BY PLATFORM, 2022-2032 ($BILLION)
- TABLE 63. AFRICA DEFENSE ELECTRONICS MARKET, BY VERTICAL, 2022-2032 ($BILLION)
- TABLE 64. LOCKHEAD MARTIN CORPORATION: KEY EXECUTIVES
- TABLE 65. LOCKHEAD MARTIN CORPORATION: COMPANY SNAPSHOT
- TABLE 66. LOCKHEAD MARTIN CORPORATION: PRODUCT SEGMENTS
- TABLE 67. LOCKHEAD MARTIN CORPORATION: SERVICE SEGMENTS
- TABLE 68. LOCKHEAD MARTIN CORPORATION: PRODUCT PORTFOLIO
- TABLE 69. LOCKHEAD MARTIN CORPORATION: KEY STRATERGIES
- TABLE 70. NORTH GRUMMAN CORPORATION: KEY EXECUTIVES
- TABLE 71. NORTH GRUMMAN CORPORATION: COMPANY SNAPSHOT
- TABLE 72. NORTH GRUMMAN CORPORATION: PRODUCT SEGMENTS
- TABLE 73. NORTH GRUMMAN CORPORATION: SERVICE SEGMENTS
- TABLE 74. NORTH GRUMMAN CORPORATION: PRODUCT PORTFOLIO
- TABLE 75. NORTH GRUMMAN CORPORATION: KEY STRATERGIES
- TABLE 76. RAYTHEON TECHNOLOGIES CORPORATION: KEY EXECUTIVES
- TABLE 77. RAYTHEON TECHNOLOGIES CORPORATION: COMPANY SNAPSHOT
- TABLE 78. RAYTHEON TECHNOLOGIES CORPORATION: PRODUCT SEGMENTS
- TABLE 79. RAYTHEON TECHNOLOGIES CORPORATION: SERVICE SEGMENTS
- TABLE 80. RAYTHEON TECHNOLOGIES CORPORATION: PRODUCT PORTFOLIO
- TABLE 81. RAYTHEON TECHNOLOGIES CORPORATION: KEY STRATERGIES
- TABLE 82. THALES GROUP: KEY EXECUTIVES
- TABLE 83. THALES GROUP: COMPANY SNAPSHOT
- TABLE 84. THALES GROUP: PRODUCT SEGMENTS
- TABLE 85. THALES GROUP: SERVICE SEGMENTS
- TABLE 86. THALES GROUP: PRODUCT PORTFOLIO
- TABLE 87. THALES GROUP: KEY STRATERGIES
- TABLE 88. BAE SYSTEMS: KEY EXECUTIVES
- TABLE 89. BAE SYSTEMS: COMPANY SNAPSHOT
- TABLE 90. BAE SYSTEMS: PRODUCT SEGMENTS
- TABLE 91. BAE SYSTEMS: SERVICE SEGMENTS
- TABLE 92. BAE SYSTEMS: PRODUCT PORTFOLIO
- TABLE 93. BAE SYSTEMS: KEY STRATERGIES
- TABLE 94. ASELSAN A.S.: KEY EXECUTIVES
- TABLE 95. ASELSAN A.S.: COMPANY SNAPSHOT
- TABLE 96. ASELSAN A.S.: PRODUCT SEGMENTS
- TABLE 97. ASELSAN A.S.: SERVICE SEGMENTS
- TABLE 98. ASELSAN A.S.: PRODUCT PORTFOLIO
- TABLE 99. ASELSAN A.S.: KEY STRATERGIES
- TABLE 100. CURTIS WRIGHT CORPORATION: KEY EXECUTIVES
- TABLE 101. CURTIS WRIGHT CORPORATION: COMPANY SNAPSHOT
- TABLE 102. CURTIS WRIGHT CORPORATION: PRODUCT SEGMENTS
- TABLE 103. CURTIS WRIGHT CORPORATION: SERVICE SEGMENTS
- TABLE 104. CURTIS WRIGHT CORPORATION: PRODUCT PORTFOLIO
- TABLE 105. CURTIS WRIGHT CORPORATION: KEY STRATERGIES
- TABLE 106. L3 HARRIS TECHNOLOGIES: KEY EXECUTIVES
- TABLE 107. L3 HARRIS TECHNOLOGIES: COMPANY SNAPSHOT
- TABLE 108. L3 HARRIS TECHNOLOGIES: PRODUCT SEGMENTS
- TABLE 109. L3 HARRIS TECHNOLOGIES: SERVICE SEGMENTS
- TABLE 110. L3 HARRIS TECHNOLOGIES: PRODUCT PORTFOLIO
- TABLE 111. L3 HARRIS TECHNOLOGIES: KEY STRATERGIES
- TABLE 112. BOEING: KEY EXECUTIVES
- TABLE 113. BOEING: COMPANY SNAPSHOT
- TABLE 114. BOEING: PRODUCT SEGMENTS
- TABLE 115. BOEING: SERVICE SEGMENTS
- TABLE 116. BOEING: PRODUCT PORTFOLIO
- TABLE 117. BOEING: KEY STRATERGIES
- TABLE 118. TELEDYNE DEFENSE ELECTRONICS: KEY EXECUTIVES
- TABLE 119. TELEDYNE DEFENSE ELECTRONICS: COMPANY SNAPSHOT
- TABLE 120. TELEDYNE DEFENSE ELECTRONICS: PRODUCT SEGMENTS
- TABLE 121. TELEDYNE DEFENSE ELECTRONICS: SERVICE SEGMENTS
- TABLE 122. TELEDYNE DEFENSE ELECTRONICS: PRODUCT PORTFOLIO
- TABLE 123. TELEDYNE DEFENSE ELECTRONICS: KEY STRATERGIES
LIST OF FIGURES
- FIGURE 01. DEFENSE ELECTRONICS MARKET, 2022-2032
- FIGURE 02. SEGMENTATION OF DEFENSE ELECTRONICS MARKET,2022-2032
- FIGURE 03. TOP IMPACTING FACTORS IN DEFENSE ELECTRONICS MARKET
- FIGURE 04. TOP INVESTMENT POCKETS IN DEFENSE ELECTRONICS MARKET (2023-2032)
- FIGURE 05. BARGAINING POWER OF SUPPLIERS
- FIGURE 06. BARGAINING POWER OF BUYERS
- FIGURE 07. THREAT OF SUBSTITUTION
- FIGURE 08. THREAT OF SUBSTITUTION
- FIGURE 09. COMPETITIVE RIVALRY
- FIGURE 10. GLOBAL DEFENSE ELECTRONICS MARKET:DRIVERS, RESTRAINTS AND OPPORTUNITIES
- FIGURE 11. DEFENSE ELECTRONICS MARKET, BY PLATFORM, 2022 AND 2032(%)
- FIGURE 12. COMPARATIVE SHARE ANALYSIS OF DEFENSE ELECTRONICS MARKET FOR AIRBORNE, BY COUNTRY 2022 AND 2032(%)
- FIGURE 13. COMPARATIVE SHARE ANALYSIS OF DEFENSE ELECTRONICS MARKET FOR SPACE, BY COUNTRY 2022 AND 2032(%)
- FIGURE 14. COMPARATIVE SHARE ANALYSIS OF DEFENSE ELECTRONICS MARKET FOR LAND, BY COUNTRY 2022 AND 2032(%)
- FIGURE 15. COMPARATIVE SHARE ANALYSIS OF DEFENSE ELECTRONICS MARKET FOR MARINE, BY COUNTRY 2022 AND 2032(%)
- FIGURE 16. DEFENSE ELECTRONICS MARKET, BY VERTICAL, 2022 AND 2032(%)
- FIGURE 17. COMPARATIVE SHARE ANALYSIS OF DEFENSE ELECTRONICS MARKET FOR OPTRONICS, BY COUNTRY 2022 AND 2032(%)
- FIGURE 18. COMPARATIVE SHARE ANALYSIS OF DEFENSE ELECTRONICS MARKET FOR COMMUNICATION AND DISPLAY, BY COUNTRY 2022 AND 2032(%)
- FIGURE 19. COMPARATIVE SHARE ANALYSIS OF DEFENSE ELECTRONICS MARKET FOR C4ISR, BY COUNTRY 2022 AND 2032(%)
- FIGURE 20. COMPARATIVE SHARE ANALYSIS OF DEFENSE ELECTRONICS MARKET FOR ELECTRONIC WARFARE, BY COUNTRY 2022 AND 2032(%)
- FIGURE 21. COMPARATIVE SHARE ANALYSIS OF DEFENSE ELECTRONICS MARKET FOR RADAR, BY COUNTRY 2022 AND 2032(%)
- FIGURE 22. COMPARATIVE SHARE ANALYSIS OF DEFENSE ELECTRONICS MARKET FOR NAVIGATION, BY COUNTRY 2022 AND 2032(%)
- FIGURE 23. DEFENSE ELECTRONICS MARKET BY REGION, 2022 AND 2032(%)
- FIGURE 24. U.S. DEFENSE ELECTRONICS MARKET, 2022-2032 ($BILLION)
- FIGURE 25. CANADA DEFENSE ELECTRONICS MARKET, 2022-2032 ($BILLION)
- FIGURE 26. MEXICO DEFENSE ELECTRONICS MARKET, 2022-2032 ($BILLION)
- FIGURE 27. UK DEFENSE ELECTRONICS MARKET, 2022-2032 ($BILLION)
- FIGURE 28. GERMANY DEFENSE ELECTRONICS MARKET, 2022-2032 ($BILLION)
- FIGURE 29. FRANCE DEFENSE ELECTRONICS MARKET, 2022-2032 ($BILLION)
- FIGURE 30. RUSSIA DEFENSE ELECTRONICS MARKET, 2022-2032 ($BILLION)
- FIGURE 31. ITALY DEFENSE ELECTRONICS MARKET, 2022-2032 ($BILLION)
- FIGURE 32. SPAIN DEFENSE ELECTRONICS MARKET, 2022-2032 ($BILLION)
- FIGURE 33. REST OF EUROPE DEFENSE ELECTRONICS MARKET, 2022-2032 ($BILLION)
- FIGURE 34. CHINA DEFENSE ELECTRONICS MARKET, 2022-2032 ($BILLION)
- FIGURE 35. INDIA DEFENSE ELECTRONICS MARKET, 2022-2032 ($BILLION)
- FIGURE 36. JAPAN DEFENSE ELECTRONICS MARKET, 2022-2032 ($BILLION)
- FIGURE 37. AUSTRALIA DEFENSE ELECTRONICS MARKET, 2022-2032 ($BILLION)
- FIGURE 38. SOUTH KOREA DEFENSE ELECTRONICS MARKET, 2022-2032 ($BILLION)
- FIGURE 39. REST OF ASIA-PACIFIC DEFENSE ELECTRONICS MARKET, 2022-2032 ($BILLION)
- FIGURE 40. LATIN AMERICA DEFENSE ELECTRONICS MARKET, 2022-2032 ($BILLION)
- FIGURE 41. MIDDLE EAST DEFENSE ELECTRONICS MARKET, 2022-2032 ($BILLION)
- FIGURE 42. AFRICA DEFENSE ELECTRONICS MARKET, 2022-2032 ($BILLION)
- FIGURE 43. TOP WINNING STRATEGIES, BY YEAR
- FIGURE 44. TOP WINNING STRATEGIES, BY DEVELOPMENT
- FIGURE 45. TOP WINNING STRATEGIES, BY COMPANY
- FIGURE 46. PRODUCT MAPPING OF TOP 10 PLAYERS
- FIGURE 47. COMPETITIVE DASHBOARD
- FIGURE 48. COMPETITIVE HEATMAP: DEFENSE ELECTRONICS MARKET
- FIGURE 49. TOP PLAYER POSITIONING, 2022
Defense electronics refers to electronic components and systems that are specifically designed for technological superiority in national defense.
The market is expected to grow further as integrated defense technologies become more widely used. Several systems and technologies are integrated to form comprehensive defense systems using integrated defense technologies. Cyber defense, automation, connectivity, and sensors are a few examples of these technologies. Integration makes it possible to share information effectively and increase defense through greater situational awareness, decision-making, and communication amongst defense systems.
Furthermore, owing to improved deployment and cost reduction, integrated defense technologies can also result in cost savings and increase efficiency. The increasing demand for flexibility and operational protection is anticipated to lead to a rise in the adoption of collision avoidance technology in the upcoming years which in turn drives the defense electronics demand.
The global defense electronics market was affected by the COVID-19 pandemic, which led to disturbances in the supply chain and production procedures. The dynamics of the market were impacted by fluctuating demand and economic uncertainty. Despite these obstacles, the market quickly rebounded due to the defense industry's increased investment in the purchase of aerial, land, and marine vehicles for its defense personnel.
Industries and key players are actively working toward enhancing transportation safety and reliability. Consequently, the commercial aviation sector has experienced significant growth. According to Boeing's commercial market prediction for 2020-2039, there is an expansion of over 4% in airline traffic, with the Asia- Pacific region leading in growth. Projections also indicate the delivery of 43,110 new commercial airplanes across seven regions, with the highest number of deliveries expected in the Asia Pacific area. This anticipated development is projected to fuel the growth of both the sector and the jet engine market throughout the specified timeframe. Moreover, technological developments in the fields of aerodynamics, materials science, and manufacturing are propelling the development of more powerful and efficient turbofan engines. Manufacturers are investing in the development of engines that limit carbon emissions and noise levels. The growing popularity of hybrid-electric propulsion technology and sustainable aviation fuels reflects the industry's commitment to more ecologically responsible and greener air travel. Furthermore, continuing partnerships between established aerospace companies and up-and-coming firms spur continual innovation. The world of jet engines has changed, with efforts to reduce environmental impact, increase energy efficiency, and investigate alternate propulsion sources, all influencing the direction of aviation technology.
With the surge in demand for fuel-efficient engines, the industry has witnessed a spike in demand for jet engines that provide improved fuel efficiency and lower emissions as fuel prices rise and environmental concerns intensify. Technological developments in engine design such as cutting-edge jet engine designs have been introduced because of the unwavering quest for innovation. These developments include lighter materials, better functionality, and increased dependability.
The Indian government has implemented several policy-based measures over the past three and a half years to increase domestic defense production, technological advancements, and defense export capacities. The "Made in India" initiative of India revolves around the manufacture of defense equipment locally. Recent changes to the Defense Procurement Procedures, the DPP's New Strategic Partnership policy, the Offset Policy, the Simplified "Make II" initiative, the EODB initiatives, and the enhancements to the industrial license application process are all motivating both domestic and foreign players to investigate various avenues for capitalizing on the potential of Make in India. The push for domestic defense manufacturing in India presents a chance, which international defense companies can seize by applying their innovative improvisation skills.
Some of the main factors propelling market growth are the increasing reliance on communications and communication security systems, cybersecurity has become a major concern. The hardware system is propelled by the need for hardware security and strong encryption systems that protect systems from cyber threats and ensure data integrity.
The defense electronics market is segmented into vertical, platform, and region. On the basis of vertical, the market is divided into C4ISR, navigation, communication and display, electronic warfare, radar, and optronics. On the basis of platform, the market is classified into airborne, land, space and marine. Region wise, the defense electronics market trends are analyzed across North America (U.S., Canada, and Mexico), Europe (UK, Germany, France, Russia, Italy, Spain, and rest of Europe), Asia-Pacific (China, India, Japan, Australia, South Korea, and rest of Asia-Pacific), and LAMEA (Latin America, the Middle East, and Africa).
Competitive analysis and profiles of the major global defense electronics market players that have been provided in the report include Lockhead Martin Corporation; Raytheon Technologies Corporation; Thales Group; BAE Systems; Aselsan AS; Curtis Wright Corporation; L3 Harris Technologies; Boeing, and Teledyne Defense Electronics. The key strategies adopted by the major players of the global defense electronics market are product launch, mergers, and acquisitions.
Key Benefits For Stakeholders
- This report provides a quantitative analysis of the market segments, current trends, estimations, and dynamics of the defense electronics market analysis from 2022 to 2032 to identify the prevailing defense electronics market opportunities.
- The market research is offered along with information related to key drivers, restraints, and opportunities.
- Porter's five forces analysis highlights the potency of buyers and suppliers to enable stakeholders make profit-oriented business decisions and strengthen their supplier-buyer network.
- In-depth analysis of the defense electronics market segmentation assists to determine the prevailing market opportunities.
- Major countries in each region are mapped according to their revenue contribution to the global market.
- Market player positioning facilitates benchmarking and provides a clear understanding of the present position of the market players.
- The report includes the analysis of the regional as well as global defense electronics market trends, key players, market segments, application areas, and market growth strategies.
Additional benefits you will get with this purchase are:
- Quarterly Update and* (only available with a corporate license, on listed price)
- 5 additional Company Profile of client Choice pre- or Post-purchase, as a free update.
- Free Upcoming Version on the Purchase of Five and Enterprise User License.
- 16 analyst hours of support* (post-purchase, if you find additional data requirements upon review of the report, you may receive support amounting to 16 analyst hours to solve questions, and post-sale queries)
- 15% Free Customization* (in case the scope or segment of the report does not match your requirements, 15% is equivalent to 3 working days of free work, applicable once)
- Free data Pack on the Five and Enterprise User License. (Excel version of the report)
- Free Updated report if the report is 6-12 months old or older.
- 24-hour priority response*
- Free Industry updates and white papers.
Possible Customization with this report (with additional cost and timeline, please talk to the sales executive to know more)
- Upcoming/New Entrant by Regions
- Additional company profiles with specific to client's interest
- Additional country or region analysis- market size and forecast
- Historic market data
Key Market Segments
By Platform
- Airborne
- Space
- Land
- Marine
By Vertical
- Optronics
- Communication and Display
- C4ISR
- Electronic Warfare
- Radar
- Navigation
By Region
- North America
- U.S.
- Canada
- Mexico
- Europe
- UK
- Germany
- France
- Russia
- Italy
- Spain
- Rest of Europe
- Asia-Pacific
- China
- India
- Japan
- Australia
- South Korea
- Rest of Asia-Pacific
- LAMEA
- Latin America
- Middle East
- Africa
Key Market Players:
- Lockhead Martin Corporation
- North Grumman Corporation
- Raytheon Technologies Corporation
- Thales Group
- BAE Systems
- Aselsan A.S.
- Curtis Wright Corporation
- L3 Harris Technologies
- Boeing
- Teledyne Defense Electronics
TABLE OF CONTENTS
CHAPTER 1: INTRODUCTION
- 1.1. Report description
- 1.2. Key market segments
- 1.3. Key benefits to the stakeholders
- 1.4. Research methodology
- 1.4.1. Primary research
- 1.4.2. Secondary research
- 1.4.3. Analyst tools and models
CHAPTER 2: EXECUTIVE SUMMARY
- 2.1. CXO Perspective
CHAPTER 3: MARKET OVERVIEW
- 3.1. Market definition and scope
- 3.2. Key findings
- 3.2.1. Top impacting factors
- 3.2.2. Top investment pockets
- 3.3. Porter's five forces analysis
- 3.4. Market dynamics
- 3.4.1. Drivers
- 3.4.2. Restraints
- 3.4.3. Opportunities
CHAPTER 4: DEFENSE ELECTRONICS MARKET, BY PLATFORM
- 4.1. Overview
- 4.1.1. Market size and forecast
- 4.2. Airborne
- 4.2.1. Key market trends, growth factors and opportunities
- 4.2.2. Market size and forecast, by region
- 4.2.3. Market share analysis by country
- 4.3. Space
- 4.3.1. Key market trends, growth factors and opportunities
- 4.3.2. Market size and forecast, by region
- 4.3.3. Market share analysis by country
- 4.4. Land
- 4.4.1. Key market trends, growth factors and opportunities
- 4.4.2. Market size and forecast, by region
- 4.4.3. Market share analysis by country
- 4.5. Marine
- 4.5.1. Key market trends, growth factors and opportunities
- 4.5.2. Market size and forecast, by region
- 4.5.3. Market share analysis by country
CHAPTER 5: DEFENSE ELECTRONICS MARKET, BY VERTICAL
- 5.1. Overview
- 5.1.1. Market size and forecast
- 5.2. Optronics
- 5.2.1. Key market trends, growth factors and opportunities
- 5.2.2. Market size and forecast, by region
- 5.2.3. Market share analysis by country
- 5.3. Communication and Display
- 5.3.1. Key market trends, growth factors and opportunities
- 5.3.2. Market size and forecast, by region
- 5.3.3. Market share analysis by country
- 5.4. C4ISR
- 5.4.1. Key market trends, growth factors and opportunities
- 5.4.2. Market size and forecast, by region
- 5.4.3. Market share analysis by country
- 5.5. Electronic Warfare
- 5.5.1. Key market trends, growth factors and opportunities
- 5.5.2. Market size and forecast, by region
- 5.5.3. Market share analysis by country
- 5.6. Radar
- 5.6.1. Key market trends, growth factors and opportunities
- 5.6.2. Market size and forecast, by region
- 5.6.3. Market share analysis by country
- 5.7. Navigation
- 5.7.1. Key market trends, growth factors and opportunities
- 5.7.2. Market size and forecast, by region
- 5.7.3. Market share analysis by country
CHAPTER 6: DEFENSE ELECTRONICS MARKET, BY REGION
- 6.1. Overview
- 6.1.1. Market size and forecast By Region
- 6.2. North America
- 6.2.1. Key market trends, growth factors and opportunities
- 6.2.2. Market size and forecast, by Platform
- 6.2.3. Market size and forecast, by Vertical
- 6.2.4. Market size and forecast, by country
- 6.2.4.1. U.S.
- 6.2.4.1.1. Market size and forecast, by Platform
- 6.2.4.1.2. Market size and forecast, by Vertical
- 6.2.4.2. Canada
- 6.2.4.2.1. Market size and forecast, by Platform
- 6.2.4.2.2. Market size and forecast, by Vertical
- 6.2.4.3. Mexico
- 6.2.4.3.1. Market size and forecast, by Platform
- 6.2.4.3.2. Market size and forecast, by Vertical
- 6.3. Europe
- 6.3.1. Key market trends, growth factors and opportunities
- 6.3.2. Market size and forecast, by Platform
- 6.3.3. Market size and forecast, by Vertical
- 6.3.4. Market size and forecast, by country
- 6.3.4.1. UK
- 6.3.4.1.1. Market size and forecast, by Platform
- 6.3.4.1.2. Market size and forecast, by Vertical
- 6.3.4.2. Germany
- 6.3.4.2.1. Market size and forecast, by Platform
- 6.3.4.2.2. Market size and forecast, by Vertical
- 6.3.4.3. France
- 6.3.4.3.1. Market size and forecast, by Platform
- 6.3.4.3.2. Market size and forecast, by Vertical
- 6.3.4.4. Russia
- 6.3.4.4.1. Market size and forecast, by Platform
- 6.3.4.4.2. Market size and forecast, by Vertical
- 6.3.4.5. Italy
- 6.3.4.5.1. Market size and forecast, by Platform
- 6.3.4.5.2. Market size and forecast, by Vertical
- 6.3.4.6. Spain
- 6.3.4.6.1. Market size and forecast, by Platform
- 6.3.4.6.2. Market size and forecast, by Vertical
- 6.3.4.7. Rest of Europe
- 6.3.4.7.1. Market size and forecast, by Platform
- 6.3.4.7.2. Market size and forecast, by Vertical
- 6.4. Asia-Pacific
- 6.4.1. Key market trends, growth factors and opportunities
- 6.4.2. Market size and forecast, by Platform
- 6.4.3. Market size and forecast, by Vertical
- 6.4.4. Market size and forecast, by country
- 6.4.4.1. China
- 6.4.4.1.1. Market size and forecast, by Platform
- 6.4.4.1.2. Market size and forecast, by Vertical
- 6.4.4.2. India
- 6.4.4.2.1. Market size and forecast, by Platform
- 6.4.4.2.2. Market size and forecast, by Vertical
- 6.4.4.3. Japan
- 6.4.4.3.1. Market size and forecast, by Platform
- 6.4.4.3.2. Market size and forecast, by Vertical
- 6.4.4.4. Australia
- 6.4.4.4.1. Market size and forecast, by Platform
- 6.4.4.4.2. Market size and forecast, by Vertical
- 6.4.4.5. South Korea
- 6.4.4.5.1. Market size and forecast, by Platform
- 6.4.4.5.2. Market size and forecast, by Vertical
- 6.4.4.6. Rest of Asia-Pacific
- 6.4.4.6.1. Market size and forecast, by Platform
- 6.4.4.6.2. Market size and forecast, by Vertical
- 6.5. LAMEA
- 6.5.1. Key market trends, growth factors and opportunities
- 6.5.2. Market size and forecast, by Platform
- 6.5.3. Market size and forecast, by Vertical
- 6.5.4. Market size and forecast, by country
- 6.5.4.1. Latin America
- 6.5.4.1.1. Market size and forecast, by Platform
- 6.5.4.1.2. Market size and forecast, by Vertical
- 6.5.4.2. Middle East
- 6.5.4.2.1. Market size and forecast, by Platform
- 6.5.4.2.2. Market size and forecast, by Vertical
- 6.5.4.3. Africa
- 6.5.4.3.1. Market size and forecast, by Platform
- 6.5.4.3.2. Market size and forecast, by Vertical
CHAPTER 7: COMPETITIVE LANDSCAPE
- 7.1. Introduction
- 7.2. Top winning strategies
- 7.3. Product mapping of top 10 player
- 7.4. Competitive dashboard
- 7.5. Competitive heatmap
- 7.6. Top player positioning, 2022
CHAPTER 8: COMPANY PROFILES
- 8.1. Lockhead Martin Corporation
- 8.1.1. Company overview
- 8.1.2. Key executives
- 8.1.3. Company snapshot
- 8.1.4. Operating business segments
- 8.1.5. Product portfolio
- 8.1.6. Business performance
- 8.1.7. Key strategic moves and developments
- 8.2. North Grumman Corporation
- 8.2.1. Company overview
- 8.2.2. Key executives
- 8.2.3. Company snapshot
- 8.2.4. Operating business segments
- 8.2.5. Product portfolio
- 8.2.6. Business performance
- 8.2.7. Key strategic moves and developments
- 8.3. Raytheon Technologies Corporation
- 8.3.1. Company overview
- 8.3.2. Key executives
- 8.3.3. Company snapshot
- 8.3.4. Operating business segments
- 8.3.5. Product portfolio
- 8.3.6. Business performance
- 8.3.7. Key strategic moves and developments
- 8.4. Thales Group
- 8.4.1. Company overview
- 8.4.2. Key executives
- 8.4.3. Company snapshot
- 8.4.4. Operating business segments
- 8.4.5. Product portfolio
- 8.4.6. Business performance
- 8.4.7. Key strategic moves and developments
- 8.5. BAE Systems
- 8.5.1. Company overview
- 8.5.2. Key executives
- 8.5.3. Company snapshot
- 8.5.4. Operating business segments
- 8.5.5. Product portfolio
- 8.5.6. Business performance
- 8.5.7. Key strategic moves and developments
- 8.6. Aselsan A.S.
- 8.6.1. Company overview
- 8.6.2. Key executives
- 8.6.3. Company snapshot
- 8.6.4. Operating business segments
- 8.6.5. Product portfolio
- 8.6.6. Business performance
- 8.6.7. Key strategic moves and developments
- 8.7. Curtis Wright Corporation
- 8.7.1. Company overview
- 8.7.2. Key executives
- 8.7.3. Company snapshot
- 8.7.4. Operating business segments
- 8.7.5. Product portfolio
- 8.7.6. Business performance
- 8.7.7. Key strategic moves and developments
- 8.8. L3 Harris Technologies
- 8.8.1. Company overview
- 8.8.2. Key executives
- 8.8.3. Company snapshot
- 8.8.4. Operating business segments
- 8.8.5. Product portfolio
- 8.8.6. Business performance
- 8.8.7. Key strategic moves and developments
- 8.9. Boeing
- 8.9.1. Company overview
- 8.9.2. Key executives
- 8.9.3. Company snapshot
- 8.9.4. Operating business segments
- 8.9.5. Product portfolio
- 8.9.6. Business performance
- 8.9.7. Key strategic moves and developments
- 8.10. Teledyne Defense Electronics
- 8.10.1. Company overview
- 8.10.2. Key executives
- 8.10.3. Company snapshot
- 8.10.4. Operating business segments
- 8.10.5. Product portfolio
- 8.10.6. Business performance
- 8.10.7. Key strategic moves and developments