
|
市場調査レポート
商品コード
1447172
ミニバス市場:推進力別、エンドユーザー別、座席数別:世界の機会分析と産業予測、2023年~2032年Minibus Market By Propulsion (IC engine, Electric), By End User (Schools, Tourism, Others), By Seating Capacity (Less than 20 seats, More than 20 seats): Global Opportunity Analysis and Industry Forecast, 2023-2032 |
||||||
|
|||||||

| ミニバス市場:推進力別、エンドユーザー別、座席数別:世界の機会分析と産業予測、2023年~2032年 |
|
出版日: 2024年01月30日
発行: Allied Market Research
ページ情報: 英文 396 Pages
納期: 2~3営業日
|

- 全表示
- 概要
- 図表
- 目次
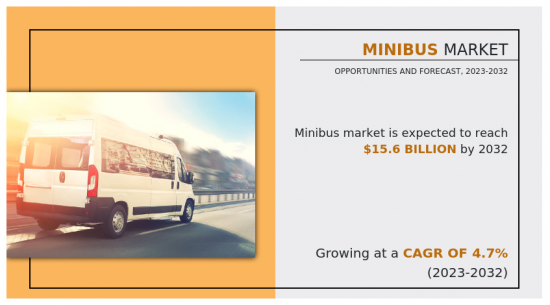
ミニバスは、フルサイズの車両よりも乗客のためのスペースが小さい小型のバスです。
レジャー、教育機関、旅行、公共交通機関などに利用できます。最大20~38名まで乗車可能です。その控えめなサイズのため、ミニバスは都市内外の移動を含め、さまざまな理由で利用することができます。ミニバスは市街地を容易に移動でき、都市環境に適応できるため、少人数の移動には持続可能な選択肢となります。
ミニバスの動力源は、内燃機関(ICエンジン)と電気モーターの両方があります。ミニバスに内燃機関(ICエンジン)が一般的な最大の理由は、その強度と耐久性です。遠方でICエンジンが採用されるかどうかは、ICエンジン用の燃料が入手できるかどうかに大きく左右されます。しかし、遠隔地や農村部には充電ステーションがなく、その他のインフラの問題とともに、ゼロ・エミッションであるにもかかわらず、電気ミニバスの採用を妨げています。しかし、持続可能性と環境保全が重視され、大都市圏では電気ミニバスの人気が高まっています。人口の多い場所では、電気ミニバスは従来の内燃エンジン車よりも排出ガスがなく静かなため、大気汚染や騒音公害を減らす理想的な手段です。
さらに、ミニバスは少人数のグループにとって、キャンプや野外コンサート、地域の集会などのレクリエーション活動の際に便利な移動手段となります。近隣のコミュニティでは、子供や高齢者、その他の地域住民のグループ旅行の促進に利用されています。近所のコミュニティ・センターが開催する文化的イベントに老人をミニバスで送迎したり、青少年グループをアウトドア・アドベンチャー・パークに連れて行ったりすることもできます。さらに、文化的なイベントや婚礼行事への送迎にも活用できます。
ミニバスの需要は、効果的で適応性の高い交通手段へのニーズが高まり、都市が急速に人口を増やし拡大しているため、都市化の影響を大きく受けています。都市化が進み、人口密度と交通渋滞が高まった結果、利用しやすい公共交通網に対する需要が高まっています。このため、混雑した都市部でも容易に移動でき、地元住民と観光客の双方に快適な交通手段を提供できる、ミニバスのようなコンパクトで機敏な交通手段に対するニーズが高まっています。
効果的な都市交通は都市の経済的潜在力を支える極めて重要な役割を果たすため、都市開発と交通システムの関係は極めて重要です。効率的な都市交通がなければ、通勤にコストがかかり、都市は経済能力を十分に発揮することができないです。従来の大型バスは、人口が密集するにつれ、混雑した都市環境や制約の多い道路での操縦が困難になる可能性があります。大型車では効率的な運行が困難な状況では、ミニバスが旅客輸送の有用な選択肢となります。また、都市化によって都市部に居住する人口の割合が増加しています。そのため、人口の増加により、ミニバスのような柔軟で適応性の高い車両の需要が高まっています。ミニバスは狭いスペースにもフィットし、ポイント・ツー・ポイントの効率的な輸送を提供できるため、都市部の移動には欠かせないです。
都市化が進み、都市部の人口が増加するにつれて、信頼性が高く、利用しやすい公共交通機関への需要が高まっています。ミニバスは、都市環境内での短・中距離移動に適応可能で手頃な価格の選択肢を提供するため、都市住民の交通ニーズに応える上で不可欠です。ミニバスは、ラストワンマイル(最後の1マイル)・コネクティビティを提供する能力があるため、都市交通網の重要な構成要素となっています。
先進技術を統合し、あらゆる事故や衝突を回避するソリューションを開発することで、車両と乗客の安全性は向上しています。強化されたブレーキシステム、車線逸脱警告システム、衝突回避システムといった先進安全技術をミニバスに加えることで、乗客の安全性は大幅に向上します。事故の可能性を減らし、その影響を軽減することで、これらの技術は乗客に安全で楽しい旅を提供することを目的としています。
ミニバス市場は、推進力、エンドユーザー、乗車定員、地域に区分されます。推進力別では、市場はICエンジンと電気に二分されます。エンドユーザー別では、学校、観光、その他に分類されます。座席数別では、市場は20席未満と20席以上に二分されます。地域別では、北米、欧州、アジア太平洋、LAMEAに分析されます。
利害関係者にとっての主なメリット
- 当レポートでは、2022年から2032年までのミニバス市場分析の市場セグメント、現在の動向、推定・動向分析を定量的に提供し、有力な市場機会を特定します。
- 市場促進要因、市場抑制要因、市場機会に関連する情報とともに市場調査を提供します。
- ポーターのファイブフォース分析では、利害関係者が利益重視のビジネス決定を下し、サプライヤーとバイヤーのネットワークを強化できるよう、バイヤーとサプライヤーの潜在力を明らかにします。
- 市場セグメンテーションの詳細な分析により、市場機会を見極めることができます。
- 各地域の主要国は、世界市場への収益貢献度に応じてマッピングされています。
- 市場プレイヤーのポジショニングはベンチマーキングを容易にし、市場プレイヤーの現在のポジションを明確に理解することができます。
- 本レポートには、地域および世界の市場動向、主要企業、市場セグメント、応用分野、市場成長戦略の分析が含まれています。
本レポートで可能なカスタマイズ(追加費用とスケジュールが必要です。)
- 主要企業の新製品開発/製品マトリックス
- SWOT分析
目次
第1章 イントロダクション
第2章 エグゼクティブサマリー
第3章 市場概要
- 市場の定義と範囲
- 主な調査結果
- 影響要因
- 主な投資機会
- ポーターのファイブフォース分析
- 市場力学
- 促進要因
- 都市化
- 観光とレクリエーション活動の成長
- 抑制要因
- ライセンシング規制
- 高速公共交通機関との競合
- 機会
- 安全性の向上
- 政府の規制
- 促進要因
第4章 ミニバス市場:推進力別
- 概要
- ICエンジン
- 電気式
第5章 ミニバス市場:エンドユーザー別
- 概要
- 学校
- 観光
- その他
第6章 ミニバス市場:座席数別
- 概要
- 20席未満
- 20席以上
第7章 ミニバス市場:地域別
- 概要
- 北米
- 米国
- カナダ
- メキシコ
- 欧州
- ドイツ
- フランス
- イタリア
- 英国
- その他
- アジア太平洋
- 中国
- 日本
- 韓国
- インド
- その他
- ラテンアメリカ
- ラテンアメリカ
- 中東
- アフリカ
第8章 競合情勢
- イントロダクション
- 主要成功戦略
- 主要10社の製品マッピング
- 競合ダッシュボード
- 競合ヒートマップ
- 主要企業のポジショニング、2022年
第9章 企業プロファイル
- Mercedes-Benz Group AG
- Ford Motor Company
- Hyundai Motor Company
- Tata Motors
- Karsan Otomotiv Sanayii ve Ticaret A.S.
- IVECO S.P.A
- TOYOTA MOTOR CORPORATION
- Marcopolo SA
- FORCE MOTORS Ltd
- Volkswagen Group
LIST OF TABLES
- TABLE 01. GLOBAL MINIBUS MARKET, BY PROPULSION, 2022-2032 ($MILLION)
- TABLE 02. MINIBUS MARKET FOR IC ENGINE, BY REGION, 2022-2032 ($MILLION)
- TABLE 03. MINIBUS MARKET FOR ELECTRIC, BY REGION, 2022-2032 ($MILLION)
- TABLE 04. GLOBAL MINIBUS MARKET, BY END USER, 2022-2032 ($MILLION)
- TABLE 05. MINIBUS MARKET FOR SCHOOLS, BY REGION, 2022-2032 ($MILLION)
- TABLE 06. MINIBUS MARKET FOR TOURISM, BY REGION, 2022-2032 ($MILLION)
- TABLE 07. MINIBUS MARKET FOR OTHERS, BY REGION, 2022-2032 ($MILLION)
- TABLE 08. GLOBAL MINIBUS MARKET, BY SEATING CAPACITY, 2022-2032 ($MILLION)
- TABLE 09. MINIBUS MARKET FOR LESS THAN 20 SEATS, BY REGION, 2022-2032 ($MILLION)
- TABLE 10. MINIBUS MARKET FOR MORE THAN 20 SEATS, BY REGION, 2022-2032 ($MILLION)
- TABLE 11. MINIBUS MARKET, BY REGION, 2022-2032 ($MILLION)
- TABLE 12. NORTH AMERICA MINIBUS MARKET, BY PROPULSION, 2022-2032 ($MILLION)
- TABLE 13. NORTH AMERICA MINIBUS MARKET, BY END USER, 2022-2032 ($MILLION)
- TABLE 14. NORTH AMERICA MINIBUS MARKET, BY SEATING CAPACITY, 2022-2032 ($MILLION)
- TABLE 15. NORTH AMERICA MINIBUS MARKET, BY COUNTRY, 2022-2032 ($MILLION)
- TABLE 16. U.S. MINIBUS MARKET, BY PROPULSION, 2022-2032 ($MILLION)
- TABLE 17. U.S. MINIBUS MARKET, BY END USER, 2022-2032 ($MILLION)
- TABLE 18. U.S. MINIBUS MARKET, BY SEATING CAPACITY, 2022-2032 ($MILLION)
- TABLE 19. CANADA MINIBUS MARKET, BY PROPULSION, 2022-2032 ($MILLION)
- TABLE 20. CANADA MINIBUS MARKET, BY END USER, 2022-2032 ($MILLION)
- TABLE 21. CANADA MINIBUS MARKET, BY SEATING CAPACITY, 2022-2032 ($MILLION)
- TABLE 22. MEXICO MINIBUS MARKET, BY PROPULSION, 2022-2032 ($MILLION)
- TABLE 23. MEXICO MINIBUS MARKET, BY END USER, 2022-2032 ($MILLION)
- TABLE 24. MEXICO MINIBUS MARKET, BY SEATING CAPACITY, 2022-2032 ($MILLION)
- TABLE 25. EUROPE MINIBUS MARKET, BY PROPULSION, 2022-2032 ($MILLION)
- TABLE 26. EUROPE MINIBUS MARKET, BY END USER, 2022-2032 ($MILLION)
- TABLE 27. EUROPE MINIBUS MARKET, BY SEATING CAPACITY, 2022-2032 ($MILLION)
- TABLE 28. EUROPE MINIBUS MARKET, BY COUNTRY, 2022-2032 ($MILLION)
- TABLE 29. GERMANY MINIBUS MARKET, BY PROPULSION, 2022-2032 ($MILLION)
- TABLE 30. GERMANY MINIBUS MARKET, BY END USER, 2022-2032 ($MILLION)
- TABLE 31. GERMANY MINIBUS MARKET, BY SEATING CAPACITY, 2022-2032 ($MILLION)
- TABLE 32. FRANCE MINIBUS MARKET, BY PROPULSION, 2022-2032 ($MILLION)
- TABLE 33. FRANCE MINIBUS MARKET, BY END USER, 2022-2032 ($MILLION)
- TABLE 34. FRANCE MINIBUS MARKET, BY SEATING CAPACITY, 2022-2032 ($MILLION)
- TABLE 35. ITALY MINIBUS MARKET, BY PROPULSION, 2022-2032 ($MILLION)
- TABLE 36. ITALY MINIBUS MARKET, BY END USER, 2022-2032 ($MILLION)
- TABLE 37. ITALY MINIBUS MARKET, BY SEATING CAPACITY, 2022-2032 ($MILLION)
- TABLE 38. UK MINIBUS MARKET, BY PROPULSION, 2022-2032 ($MILLION)
- TABLE 39. UK MINIBUS MARKET, BY END USER, 2022-2032 ($MILLION)
- TABLE 40. UK MINIBUS MARKET, BY SEATING CAPACITY, 2022-2032 ($MILLION)
- TABLE 41. REST OF EUROPE MINIBUS MARKET, BY PROPULSION, 2022-2032 ($MILLION)
- TABLE 42. REST OF EUROPE MINIBUS MARKET, BY END USER, 2022-2032 ($MILLION)
- TABLE 43. REST OF EUROPE MINIBUS MARKET, BY SEATING CAPACITY, 2022-2032 ($MILLION)
- TABLE 44. ASIA-PACIFIC MINIBUS MARKET, BY PROPULSION, 2022-2032 ($MILLION)
- TABLE 45. ASIA-PACIFIC MINIBUS MARKET, BY END USER, 2022-2032 ($MILLION)
- TABLE 46. ASIA-PACIFIC MINIBUS MARKET, BY SEATING CAPACITY, 2022-2032 ($MILLION)
- TABLE 47. ASIA-PACIFIC MINIBUS MARKET, BY COUNTRY, 2022-2032 ($MILLION)
- TABLE 48. CHINA MINIBUS MARKET, BY PROPULSION, 2022-2032 ($MILLION)
- TABLE 49. CHINA MINIBUS MARKET, BY END USER, 2022-2032 ($MILLION)
- TABLE 50. CHINA MINIBUS MARKET, BY SEATING CAPACITY, 2022-2032 ($MILLION)
- TABLE 51. JAPAN MINIBUS MARKET, BY PROPULSION, 2022-2032 ($MILLION)
- TABLE 52. JAPAN MINIBUS MARKET, BY END USER, 2022-2032 ($MILLION)
- TABLE 53. JAPAN MINIBUS MARKET, BY SEATING CAPACITY, 2022-2032 ($MILLION)
- TABLE 54. SOUTH KOREA MINIBUS MARKET, BY PROPULSION, 2022-2032 ($MILLION)
- TABLE 55. SOUTH KOREA MINIBUS MARKET, BY END USER, 2022-2032 ($MILLION)
- TABLE 56. SOUTH KOREA MINIBUS MARKET, BY SEATING CAPACITY, 2022-2032 ($MILLION)
- TABLE 57. INDIA MINIBUS MARKET, BY PROPULSION, 2022-2032 ($MILLION)
- TABLE 58. INDIA MINIBUS MARKET, BY END USER, 2022-2032 ($MILLION)
- TABLE 59. INDIA MINIBUS MARKET, BY SEATING CAPACITY, 2022-2032 ($MILLION)
- TABLE 60. REST OF ASIA-PACIFIC MINIBUS MARKET, BY PROPULSION, 2022-2032 ($MILLION)
- TABLE 61. REST OF ASIA-PACIFIC MINIBUS MARKET, BY END USER, 2022-2032 ($MILLION)
- TABLE 62. REST OF ASIA-PACIFIC MINIBUS MARKET, BY SEATING CAPACITY, 2022-2032 ($MILLION)
- TABLE 63. LAMEA MINIBUS MARKET, BY PROPULSION, 2022-2032 ($MILLION)
- TABLE 64. LAMEA MINIBUS MARKET, BY END USER, 2022-2032 ($MILLION)
- TABLE 65. LAMEA MINIBUS MARKET, BY SEATING CAPACITY, 2022-2032 ($MILLION)
- TABLE 66. LAMEA MINIBUS MARKET, BY COUNTRY, 2022-2032 ($MILLION)
- TABLE 67. LATIN AMERICA MINIBUS MARKET, BY PROPULSION, 2022-2032 ($MILLION)
- TABLE 68. LATIN AMERICA MINIBUS MARKET, BY END USER, 2022-2032 ($MILLION)
- TABLE 69. LATIN AMERICA MINIBUS MARKET, BY SEATING CAPACITY, 2022-2032 ($MILLION)
- TABLE 70. MIDDLE EAST MINIBUS MARKET, BY PROPULSION, 2022-2032 ($MILLION)
- TABLE 71. MIDDLE EAST MINIBUS MARKET, BY END USER, 2022-2032 ($MILLION)
- TABLE 72. MIDDLE EAST MINIBUS MARKET, BY SEATING CAPACITY, 2022-2032 ($MILLION)
- TABLE 73. AFRICA MINIBUS MARKET, BY PROPULSION, 2022-2032 ($MILLION)
- TABLE 74. AFRICA MINIBUS MARKET, BY END USER, 2022-2032 ($MILLION)
- TABLE 75. AFRICA MINIBUS MARKET, BY SEATING CAPACITY, 2022-2032 ($MILLION)
- TABLE 76. MERCEDES-BENZ GROUP AG: KEY EXECUTIVES
- TABLE 77. MERCEDES-BENZ GROUP AG: COMPANY SNAPSHOT
- TABLE 78. MERCEDES-BENZ GROUP AG: PRODUCT SEGMENTS
- TABLE 79. MERCEDES-BENZ GROUP AG: SERVICE SEGMENTS
- TABLE 80. MERCEDES-BENZ GROUP AG: PRODUCT PORTFOLIO
- TABLE 81. FORD MOTOR COMPANY: KEY EXECUTIVES
- TABLE 82. FORD MOTOR COMPANY: COMPANY SNAPSHOT
- TABLE 83. FORD MOTOR COMPANY: PRODUCT SEGMENTS
- TABLE 84. FORD MOTOR COMPANY: PRODUCT PORTFOLIO
- TABLE 85. FORD MOTOR COMPANY: KEY STRATERGIES
- TABLE 86. HYUNDAI MOTOR COMPANY: KEY EXECUTIVES
- TABLE 87. HYUNDAI MOTOR COMPANY: COMPANY SNAPSHOT
- TABLE 88. HYUNDAI MOTOR COMPANY: PRODUCT SEGMENTS
- TABLE 89. HYUNDAI MOTOR COMPANY: PRODUCT PORTFOLIO
- TABLE 90. HYUNDAI MOTOR COMPANY: KEY STRATERGIES
- TABLE 91. TATA MOTORS: KEY EXECUTIVES
- TABLE 92. TATA MOTORS: COMPANY SNAPSHOT
- TABLE 93. TATA MOTORS: PRODUCT SEGMENTS
- TABLE 94. TATA MOTORS: PRODUCT PORTFOLIO
- TABLE 95. TATA MOTORS: KEY STRATERGIES
- TABLE 96. KARSAN OTOMOTIV SANAYII VE TICARET A.S.: KEY EXECUTIVES
- TABLE 97. KARSAN OTOMOTIV SANAYII VE TICARET A.S.: COMPANY SNAPSHOT
- TABLE 98. KARSAN OTOMOTIV SANAYII VE TICARET A.S.: PRODUCT SEGMENTS
- TABLE 99. KARSAN OTOMOTIV SANAYII VE TICARET A.S.: PRODUCT PORTFOLIO
- TABLE 100. KARSAN OTOMOTIV SANAYII VE TICARET A.S.: KEY STRATERGIES
- TABLE 101. IVECO S.P.A: KEY EXECUTIVES
- TABLE 102. IVECO S.P.A: COMPANY SNAPSHOT
- TABLE 103. IVECO S.P.A: PRODUCT SEGMENTS
- TABLE 104. IVECO S.P.A: SERVICE SEGMENTS
- TABLE 105. IVECO S.P.A: PRODUCT PORTFOLIO
- TABLE 106. TOYOTA MOTOR CORPORATION: KEY EXECUTIVES
- TABLE 107. TOYOTA MOTOR CORPORATION: COMPANY SNAPSHOT
- TABLE 108. TOYOTA MOTOR CORPORATION: PRODUCT SEGMENTS
- TABLE 109. TOYOTA MOTOR CORPORATION: PRODUCT PORTFOLIO
- TABLE 110. MARCOPOLO SA: KEY EXECUTIVES
- TABLE 111. MARCOPOLO SA: COMPANY SNAPSHOT
- TABLE 112. MARCOPOLO SA: PRODUCT SEGMENTS
- TABLE 113. MARCOPOLO SA: PRODUCT PORTFOLIO
- TABLE 114. MARCOPOLO SA: KEY STRATERGIES
- TABLE 115. FORCE MOTORS LTD: KEY EXECUTIVES
- TABLE 116. FORCE MOTORS LTD: COMPANY SNAPSHOT
- TABLE 117. FORCE MOTORS LTD: PRODUCT SEGMENTS
- TABLE 118. FORCE MOTORS LTD: PRODUCT PORTFOLIO
- TABLE 119. VOLKSWAGEN GROUP: KEY EXECUTIVES
- TABLE 120. VOLKSWAGEN GROUP: COMPANY SNAPSHOT
- TABLE 121. VOLKSWAGEN GROUP: PRODUCT SEGMENTS
- TABLE 122. VOLKSWAGEN GROUP: PRODUCT PORTFOLIO
LIST OF FIGURES
- FIGURE 01. MINIBUS MARKET, 2022-2032
- FIGURE 02. SEGMENTATION OF MINIBUS MARKET,2022-2032
- FIGURE 03. TOP IMPACTING FACTORS IN MINIBUS MARKET (2022 TO 2032)
- FIGURE 04. TOP INVESTMENT POCKETS IN MINIBUS MARKET (2023-2032)
- FIGURE 05. LOW BARGAINING POWER OF SUPPLIERS
- FIGURE 06. LOW THREAT OF NEW ENTRANTS
- FIGURE 07. LOW THREAT OF SUBSTITUTES
- FIGURE 08. LOW INTENSITY OF RIVALRY
- FIGURE 09. LOW BARGAINING POWER OF BUYERS
- FIGURE 10. GLOBAL MINIBUS MARKET:DRIVERS, RESTRAINTS AND OPPORTUNITIES
- FIGURE 11. MINIBUS MARKET, BY PROPULSION, 2022 AND 2032(%)
- FIGURE 12. COMPARATIVE SHARE ANALYSIS OF MINIBUS MARKET FOR IC ENGINE, BY COUNTRY 2022 AND 2032(%)
- FIGURE 13. COMPARATIVE SHARE ANALYSIS OF MINIBUS MARKET FOR ELECTRIC, BY COUNTRY 2022 AND 2032(%)
- FIGURE 14. MINIBUS MARKET, BY END USER, 2022 AND 2032(%)
- FIGURE 15. COMPARATIVE SHARE ANALYSIS OF MINIBUS MARKET FOR SCHOOLS, BY COUNTRY 2022 AND 2032(%)
- FIGURE 16. COMPARATIVE SHARE ANALYSIS OF MINIBUS MARKET FOR TOURISM, BY COUNTRY 2022 AND 2032(%)
- FIGURE 17. COMPARATIVE SHARE ANALYSIS OF MINIBUS MARKET FOR OTHERS, BY COUNTRY 2022 AND 2032(%)
- FIGURE 18. MINIBUS MARKET, BY SEATING CAPACITY, 2022 AND 2032(%)
- FIGURE 19. COMPARATIVE SHARE ANALYSIS OF MINIBUS MARKET FOR LESS THAN 20 SEATS, BY COUNTRY 2022 AND 2032(%)
- FIGURE 20. COMPARATIVE SHARE ANALYSIS OF MINIBUS MARKET FOR MORE THAN 20 SEATS, BY COUNTRY 2022 AND 2032(%)
- FIGURE 21. MINIBUS MARKET BY REGION, 2022 AND 2032(%)
- FIGURE 22. U.S. MINIBUS MARKET, 2022-2032 ($MILLION)
- FIGURE 23. CANADA MINIBUS MARKET, 2022-2032 ($MILLION)
- FIGURE 24. MEXICO MINIBUS MARKET, 2022-2032 ($MILLION)
- FIGURE 25. GERMANY MINIBUS MARKET, 2022-2032 ($MILLION)
- FIGURE 26. FRANCE MINIBUS MARKET, 2022-2032 ($MILLION)
- FIGURE 27. ITALY MINIBUS MARKET, 2022-2032 ($MILLION)
- FIGURE 28. UK MINIBUS MARKET, 2022-2032 ($MILLION)
- FIGURE 29. REST OF EUROPE MINIBUS MARKET, 2022-2032 ($MILLION)
- FIGURE 30. CHINA MINIBUS MARKET, 2022-2032 ($MILLION)
- FIGURE 31. JAPAN MINIBUS MARKET, 2022-2032 ($MILLION)
- FIGURE 32. SOUTH KOREA MINIBUS MARKET, 2022-2032 ($MILLION)
- FIGURE 33. INDIA MINIBUS MARKET, 2022-2032 ($MILLION)
- FIGURE 34. REST OF ASIA-PACIFIC MINIBUS MARKET, 2022-2032 ($MILLION)
- FIGURE 35. LATIN AMERICA MINIBUS MARKET, 2022-2032 ($MILLION)
- FIGURE 36. MIDDLE EAST MINIBUS MARKET, 2022-2032 ($MILLION)
- FIGURE 37. AFRICA MINIBUS MARKET, 2022-2032 ($MILLION)
- FIGURE 38. TOP WINNING STRATEGIES, BY YEAR (2020-2023)
- FIGURE 39. TOP WINNING STRATEGIES, BY DEVELOPMENT (2020-2023)
- FIGURE 40. TOP WINNING STRATEGIES, BY COMPANY (2020-2023)
- FIGURE 41. PRODUCT MAPPING OF TOP 10 PLAYERS
- FIGURE 42. COMPETITIVE DASHBOARD
- FIGURE 43. COMPETITIVE HEATMAP: MINIBUS MARKET
- FIGURE 44. TOP PLAYER POSITIONING, 2022
- FIGURE 45. MERCEDES-BENZ GROUP AG: RESEARCH & DEVELOPMENT EXPENDITURE, 2020-2022
- FIGURE 46. MERCEDES-BENZ GROUP AG: NET SALES, 2020-2022 ($MILLION)
- FIGURE 47. MERCEDES-BENZ GROUP AG: REVENUE SHARE BY SEGMENT, 2022 (%)
- FIGURE 48. MERCEDES-BENZ GROUP AG: REVENUE SHARE BY REGION, 2022 (%)
- FIGURE 49. FORD MOTOR COMPANY: NET SALES, 2020-2022 ($MILLION)
- FIGURE 50. FORD MOTOR COMPANY: RESEARCH & DEVELOPMENT EXPENDITURE, 2020-2022 ($MILLION)
- FIGURE 51. FORD MOTOR COMPANY: REVENUE SHARE BY REGION, 2022 (%)
- FIGURE 52. FORD MOTOR COMPANY: REVENUE SHARE BY SEGMENT, 2022 (%)
- FIGURE 53. HYUNDAI MOTOR COMPANY: RESEARCH & DEVELOPMENT EXPENDITURE, 2020-2022 ($MILLION)
- FIGURE 54. HYUNDAI MOTOR COMPANY: NET REVENUE, 2020-2022 ($MILLION)
- FIGURE 55. HYUNDAI MOTOR COMPANY: REVENUE SHARE BY SEGMENT, 2022 (%)
- FIGURE 56. HYUNDAI MOTOR COMPANY: REVENUE SHARE BY REGION, 2021 (%)
- FIGURE 57. TATA MOTORS: NET SALES, 2020-2022 ($MILLION)
- FIGURE 58. TATA MOTORS: RESEARCH & DEVELOPMENT EXPENDITURE, 2020-2022 ($MILLION)
- FIGURE 59. TATA MOTORS: REVENUE SHARE BY SEGMENT, 2022 (%)
- FIGURE 60. TATA MOTORS: REVENUE SHARE BY REGION, 2022 (%)
- FIGURE 61. KARSAN OTOMOTIV SANAYII VE TICARET A.?.: NET REVENUE, 2020-2022 ($MILLION)
- FIGURE 62. KARSAN OTOMOTIV SANAYII VE TICARET A.?.: RESEARCH & DEVELOPMENT EXPENDITURE, 2020-2022 ($MILLION)
- FIGURE 63. KARSAN OTOMOTIV SANAYII VE TICARET A.?.: REVENUE SHARE BY SEGMENT, 2022 (%)
- FIGURE 64. IVECO S.P.A: NET REVENUE, 2020-2022 ($MILLION)
- FIGURE 65. IVECO S.P.A: RESEARCH & DEVELOPMENT EXPENDITURE, 2020-2022 ($MILLION)
- FIGURE 66. IVECO S.P.A: REVENUE SHARE BY SEGMENT, 2022 (%)
- FIGURE 67. IVECO S.P.A: REVENUE SHARE BY REGION, 2022 (%)
- FIGURE 68. TOYOTA MOTOR CORPORATION: NET REVENUE, 2020-2022 ($MILLION)
- FIGURE 69. TOYOTA MOTOR CORPORATION: RESEARCH & DEVELOPMENT EXPENDITURE, 2020-2022 ($MILLION)
- FIGURE 70. TOYOTA MOTOR CORPORATION: REVENUE SHARE BY SEGMENT, 2022 (%)
- FIGURE 71. TOYOTA MOTOR CORPORATION: REVENUE SHARE BY REGION, 2022 (%)
- FIGURE 72. MARCOPOLO SA: NET REVENUE, 2020-2022 ($MILLION)
- FIGURE 73. MARCOPOLO SA: REVENUE SHARE BY SEGMENT, 2022 (%)
- FIGURE 74. MARCOPOLO SA: REVENUE SHARE BY REGION, 2022 (%)
- FIGURE 75. FORCE MOTORS LTD: NET REVENUE, 2020-2022 ($MILLION)
- FIGURE 76. FORCE MOTORS LTD: RESEARCH & DEVELOPMENT EXPENDITURE, 2020-2022 ($MILLION)
- FIGURE 77. VOLKSWAGEN GROUP: NET SALES, 2020-2022 ($MILLION)
- FIGURE 78. VOLKSWAGEN GROUP: RESEARCH & DEVELOPMENT EXPENDITURE, 2020-2022 ($MILLION)
- FIGURE 79. VOLKSWAGEN GROUP: REVENUE SHARE BY REGION, 2022 (%)
- FIGURE 80. VOLKSWAGEN GROUP: REVENUE SHARE BY SEGMENT, 2022 (%)
A minibus is a smaller bus that has less space for passengers than a full-sized vehicle. It can be used for leisure activities, educational institutions, travel, and public transit. Up to 20-38 people can fit inside of it. Due to its modest size, the minibus may be used for a variety of reasons, including traveling within and outside of cities. It provides a sustainable choice for moving small groups of people because it can easily maneuver through city streets and adapt to the urban environment.
Both an internal combustion engine (IC engine) and electric motors can power the minibus. The primary reason internal combustion engines (IC engines) are commonly found in minibuses is their strength and durability. The adoption of IC engines in distant areas is largely dependent on the availability of fuel for these engines. However, the lack of charging stations in remote and rural locations, along with other infrastructure issues, hinders the adoption of electric minibuses despite their zero emission status. However, with an emphasis on sustainability and environmental preservation, electric minibuses have become more popular in metropolitan areas. In highly populated locations, electric minibuses are an ideal means to reduce air and noise pollution as they are an emission-free and quieter option than conventional internal combustion engine vehicles.
Furthermore, minibuses offer small groups a useful way to travel around during recreational activities including camping vacations, outdoor concerts, and community gatherings. Communities in the neighborhood use it for facilitating group trips for children, the elderly, and other community members. An old person may be transported to a cultural event by a neighborhood community center in a minibus, or a youth group may be taken to an outdoor adventure park. Additionally, it can be utilized to take people to a cultural event or to a marriage function.
The demand for minibuses has been greatly impacted by urbanization as the need for effective and adaptable transportation solutions grows and cities undergo fast population development and expansion. There is a greater demand for accessible public transit networks as a result of growing urbanization, which has also raised population density and traffic congestion. Due to this, there is a growing need for more compact, agile transportation option, such as minibuses, that can easily move through crowded urban areas and offer both locals and tourists comfortable transportation options.
The relationship between urban development and transport systems is crucial, as effective urban transit plays a pivotal role in supporting the economic potential of cities. Without efficient urban transit, commuting becomes costly and cities struggle to deliver on their full economic capacity. Conventional large buses may encounter difficulties maneuvering in crowded urban environments and constrained roadways as areas become densely populated. In situations where larger vehicles would find it difficult to operate efficiently, minibuses provide a useful option for passenger transportation. In addition, urbanization has resulted in the rise in the percentage of the population residing in urban areas. Therefore, the increase in population has increased the demand for flexible and adaptable vehicles, like minibuses. Minibuses are essential for urban mobility because they can fit through tight spaces and provide efficient point-to-point transportation.
The demand for dependable and easily accessible public transit options grows as urbanization continues to fuel population expansion in cities. As they provide adaptable and affordable options for short- to medium-distance travel within urban settings, minibuses are essential in meeting the transportation needs of urban inhabitants. They are an essential component of urban transportation networks due to their capacity to offer last-mile connectivity.
Vehicle and passenger safety has improved by integrating advanced technologies and developing solutions to avoid any kind of accident or collision. Passenger safety can be greatly improved by adding advanced safety technologies to minibuses, such as enhanced braking systems, lane departure warning systems, and collision avoidance systems. By reducing the likelihood of accidents and lessening their effects, these technologies aim to provide passengers with a safe and enjoyable journey.
The minibus market is segmented into propulsion, end user, seating capacity, and region. By propulsion, the market is bifurcated into IC engine, and electric. By end user, the market is classified into school, tourism, and others. By seating capacity, the market is bifurcated into less than 20 seats and more than 20 seats. By region, the market is analyzed across North America, Europe, Asia-Pacific, and LAMEA.
The key players in the minibus market include Mercedes-Benz Group AG, Ford Motor Company Ltd, Hyundai motor company, MAN, TATA motors, TOYOTA MOTOR CORPORATION, Marcopolo SA, Volkswagen Group, Karsan Otomotiv Sanayii ve Ticaret A.S., IVECO S.p.A.
Key Benefits For Stakeholders
- This report provides a quantitative analysis of the market segments, current trends, estimations, and dynamics of the minibus market analysis from 2022 to 2032 to identify the prevailing market opportunities.
- The market research is offered along with information related to key drivers, restraints, and opportunities.
- Porter's five forces analysis highlights the potency of buyers and suppliers to enable stakeholders make profit-oriented business decisions and strengthen their supplier-buyer network.
- In-depth analysis of the market segmentation assists to determine the prevailing market opportunities.
- Major countries in each region are mapped according to their revenue contribution to the global market.
- Market player positioning facilitates benchmarking and provides a clear understanding of the present position of the market players.
- The report includes the analysis of the regional as well as global market trends, key players, market segments, application areas, and market growth strategies.
Additional benefits you will get with this purchase are:
- Quarterly Update and* (only available with a corporate license, on listed price)
- 5 additional Company Profile of client Choice pre- or Post-purchase, as a free update.
- Free Upcoming Version on the Purchase of Five and Enterprise User License.
- 16 analyst hours of support* (post-purchase, if you find additional data requirements upon review of the report, you may receive support amounting to 16 analyst hours to solve questions, and post-sale queries)
- 15% Free Customization* (in case the scope or segment of the report does not match your requirements, 15% is equivalent to 3 working days of free work, applicable once)
- Free data Pack on the Five and Enterprise User License. (Excel version of the report)
- Free Updated report if the report is 6-12 months old or older.
- 24-hour priority response*
- Free Industry updates and white papers.
Possible Customization with this report (with additional cost and timeline, please talk to the sales executive to know more)
- New Product Development/ Product Matrix of Key Players
- SWOT Analysis
Key Market Segments
By Propulsion
- IC engine
- Electric
By End User
- Schools
- Tourism
- Others
By Seating Capacity
- Less than 20 seats
- More than 20 seats
By Region
- North America
- U.S.
- Canada
- Mexico
- Europe
- Germany
- France
- Italy
- UK
- Rest of Europe
- Asia-Pacific
- China
- Japan
- South Korea
- India
- Rest of Asia-Pacific
- LAMEA
- Latin America
- Middle East
- Africa
Key Market Players:
- Hyundai Motor Company
- Mercedes-Benz Group AG
- Tata Motors
- IVECO S.P.A
- FORCE MOTORS Ltd
- Volkswagen Group
- Marcopolo SA
- Ford Motor Company
- TOYOTA MOTOR CORPORATION
- Karsan Otomotiv Sanayii ve Ticaret A.?.
TABLE OF CONTENTS
CHAPTER 1: INTRODUCTION
- 1.1. Report description
- 1.2. Key market segments
- 1.3. Key benefits to the stakeholders
- 1.4. Research methodology
- 1.4.1. Primary research
- 1.4.2. Secondary research
- 1.4.3. Analyst tools and models
CHAPTER 2: EXECUTIVE SUMMARY
- 2.1. CXO Perspective
CHAPTER 3: MARKET OVERVIEW
- 3.1. Market definition and scope
- 3.2. Key findings
- 3.2.1. Top impacting factors
- 3.2.2. Top investment pockets
- 3.3. Porter's five forces analysis
- 3.3.1. Low bargaining power of suppliers
- 3.3.2. Low threat of new entrants
- 3.3.3. Low threat of substitutes
- 3.3.4. Low intensity of rivalry
- 3.3.5. Low bargaining power of buyers
- 3.4. Market dynamics
- 3.4.1. Drivers
- 3.4.1.1. Urbanization
- 3.4.1.2. Growth in tourism and recreational activities
- 3.4.2. Restraints
- 3.4.2.1. License restrictions
- 3.4.2.2. Competition from faster modes of public transport
- 3.4.3. Opportunities
- 3.4.3.1. Advancement in safety features
- 3.4.3.2. Government regulations
- 3.4.1. Drivers
CHAPTER 4: MINIBUS MARKET, BY PROPULSION
- 4.1. Overview
- 4.1.1. Market size and forecast
- 4.2. IC engine
- 4.2.1. Key market trends, growth factors and opportunities
- 4.2.2. Market size and forecast, by region
- 4.2.3. Market share analysis by country
- 4.3. Electric
- 4.3.1. Key market trends, growth factors and opportunities
- 4.3.2. Market size and forecast, by region
- 4.3.3. Market share analysis by country
CHAPTER 5: MINIBUS MARKET, BY END USER
- 5.1. Overview
- 5.1.1. Market size and forecast
- 5.2. Schools
- 5.2.1. Key market trends, growth factors and opportunities
- 5.2.2. Market size and forecast, by region
- 5.2.3. Market share analysis by country
- 5.3. Tourism
- 5.3.1. Key market trends, growth factors and opportunities
- 5.3.2. Market size and forecast, by region
- 5.3.3. Market share analysis by country
- 5.4. Others
- 5.4.1. Key market trends, growth factors and opportunities
- 5.4.2. Market size and forecast, by region
- 5.4.3. Market share analysis by country
CHAPTER 6: MINIBUS MARKET, BY SEATING CAPACITY
- 6.1. Overview
- 6.1.1. Market size and forecast
- 6.2. Less than 20 seats
- 6.2.1. Key market trends, growth factors and opportunities
- 6.2.2. Market size and forecast, by region
- 6.2.3. Market share analysis by country
- 6.3. More than 20 seats
- 6.3.1. Key market trends, growth factors and opportunities
- 6.3.2. Market size and forecast, by region
- 6.3.3. Market share analysis by country
CHAPTER 7: MINIBUS MARKET, BY REGION
- 7.1. Overview
- 7.1.1. Market size and forecast By Region
- 7.2. North America
- 7.2.1. Key market trends, growth factors and opportunities
- 7.2.2. Market size and forecast, by Propulsion
- 7.2.3. Market size and forecast, by End User
- 7.2.4. Market size and forecast, by Seating Capacity
- 7.2.5. Market size and forecast, by country
- 7.2.5.1. U.S.
- 7.2.5.1.1. Market size and forecast, by Propulsion
- 7.2.5.1.2. Market size and forecast, by End User
- 7.2.5.1.3. Market size and forecast, by Seating Capacity
- 7.2.5.2. Canada
- 7.2.5.2.1. Market size and forecast, by Propulsion
- 7.2.5.2.2. Market size and forecast, by End User
- 7.2.5.2.3. Market size and forecast, by Seating Capacity
- 7.2.5.3. Mexico
- 7.2.5.3.1. Market size and forecast, by Propulsion
- 7.2.5.3.2. Market size and forecast, by End User
- 7.2.5.3.3. Market size and forecast, by Seating Capacity
- 7.3. Europe
- 7.3.1. Key market trends, growth factors and opportunities
- 7.3.2. Market size and forecast, by Propulsion
- 7.3.3. Market size and forecast, by End User
- 7.3.4. Market size and forecast, by Seating Capacity
- 7.3.5. Market size and forecast, by country
- 7.3.5.1. Germany
- 7.3.5.1.1. Market size and forecast, by Propulsion
- 7.3.5.1.2. Market size and forecast, by End User
- 7.3.5.1.3. Market size and forecast, by Seating Capacity
- 7.3.5.2. France
- 7.3.5.2.1. Market size and forecast, by Propulsion
- 7.3.5.2.2. Market size and forecast, by End User
- 7.3.5.2.3. Market size and forecast, by Seating Capacity
- 7.3.5.3. Italy
- 7.3.5.3.1. Market size and forecast, by Propulsion
- 7.3.5.3.2. Market size and forecast, by End User
- 7.3.5.3.3. Market size and forecast, by Seating Capacity
- 7.3.5.4. UK
- 7.3.5.4.1. Market size and forecast, by Propulsion
- 7.3.5.4.2. Market size and forecast, by End User
- 7.3.5.4.3. Market size and forecast, by Seating Capacity
- 7.3.5.5. Rest of Europe
- 7.3.5.5.1. Market size and forecast, by Propulsion
- 7.3.5.5.2. Market size and forecast, by End User
- 7.3.5.5.3. Market size and forecast, by Seating Capacity
- 7.4. Asia-Pacific
- 7.4.1. Key market trends, growth factors and opportunities
- 7.4.2. Market size and forecast, by Propulsion
- 7.4.3. Market size and forecast, by End User
- 7.4.4. Market size and forecast, by Seating Capacity
- 7.4.5. Market size and forecast, by country
- 7.4.5.1. China
- 7.4.5.1.1. Market size and forecast, by Propulsion
- 7.4.5.1.2. Market size and forecast, by End User
- 7.4.5.1.3. Market size and forecast, by Seating Capacity
- 7.4.5.2. Japan
- 7.4.5.2.1. Market size and forecast, by Propulsion
- 7.4.5.2.2. Market size and forecast, by End User
- 7.4.5.2.3. Market size and forecast, by Seating Capacity
- 7.4.5.3. South Korea
- 7.4.5.3.1. Market size and forecast, by Propulsion
- 7.4.5.3.2. Market size and forecast, by End User
- 7.4.5.3.3. Market size and forecast, by Seating Capacity
- 7.4.5.4. India
- 7.4.5.4.1. Market size and forecast, by Propulsion
- 7.4.5.4.2. Market size and forecast, by End User
- 7.4.5.4.3. Market size and forecast, by Seating Capacity
- 7.4.5.5. Rest of Asia-Pacific
- 7.4.5.5.1. Market size and forecast, by Propulsion
- 7.4.5.5.2. Market size and forecast, by End User
- 7.4.5.5.3. Market size and forecast, by Seating Capacity
- 7.5. LAMEA
- 7.5.1. Key market trends, growth factors and opportunities
- 7.5.2. Market size and forecast, by Propulsion
- 7.5.3. Market size and forecast, by End User
- 7.5.4. Market size and forecast, by Seating Capacity
- 7.5.5. Market size and forecast, by country
- 7.5.5.1. Latin America
- 7.5.5.1.1. Market size and forecast, by Propulsion
- 7.5.5.1.2. Market size and forecast, by End User
- 7.5.5.1.3. Market size and forecast, by Seating Capacity
- 7.5.5.2. Middle East
- 7.5.5.2.1. Market size and forecast, by Propulsion
- 7.5.5.2.2. Market size and forecast, by End User
- 7.5.5.2.3. Market size and forecast, by Seating Capacity
- 7.5.5.3. Africa
- 7.5.5.3.1. Market size and forecast, by Propulsion
- 7.5.5.3.2. Market size and forecast, by End User
- 7.5.5.3.3. Market size and forecast, by Seating Capacity
CHAPTER 8: COMPETITIVE LANDSCAPE
- 8.1. Introduction
- 8.2. Top winning strategies
- 8.3. Product mapping of top 10 player
- 8.4. Competitive dashboard
- 8.5. Competitive heatmap
- 8.6. Top player positioning, 2022
CHAPTER 9: COMPANY PROFILES
- 9.1. Mercedes-Benz Group AG
- 9.1.1. Company overview
- 9.1.2. Key executives
- 9.1.3. Company snapshot
- 9.1.4. Operating business segments
- 9.1.5. Product portfolio
- 9.1.6. Business performance
- 9.2. Ford Motor Company
- 9.2.1. Company overview
- 9.2.2. Key executives
- 9.2.3. Company snapshot
- 9.2.4. Operating business segments
- 9.2.5. Product portfolio
- 9.2.6. Business performance
- 9.2.7. Key strategic moves and developments
- 9.3. Hyundai Motor Company
- 9.3.1. Company overview
- 9.3.2. Key executives
- 9.3.3. Company snapshot
- 9.3.4. Operating business segments
- 9.3.5. Product portfolio
- 9.3.6. Business performance
- 9.3.7. Key strategic moves and developments
- 9.4. Tata Motors
- 9.4.1. Company overview
- 9.4.2. Key executives
- 9.4.3. Company snapshot
- 9.4.4. Operating business segments
- 9.4.5. Product portfolio
- 9.4.6. Business performance
- 9.4.7. Key strategic moves and developments
- 9.5. Karsan Otomotiv Sanayii ve Ticaret A.S.
- 9.5.1. Company overview
- 9.5.2. Key executives
- 9.5.3. Company snapshot
- 9.5.4. Operating business segments
- 9.5.5. Product portfolio
- 9.5.6. Business performance
- 9.5.7. Key strategic moves and developments
- 9.6. IVECO S.P.A
- 9.6.1. Company overview
- 9.6.2. Key executives
- 9.6.3. Company snapshot
- 9.6.4. Operating business segments
- 9.6.5. Product portfolio
- 9.6.6. Business performance
- 9.7. TOYOTA MOTOR CORPORATION
- 9.7.1. Company overview
- 9.7.2. Key executives
- 9.7.3. Company snapshot
- 9.7.4. Operating business segments
- 9.7.5. Product portfolio
- 9.7.6. Business performance
- 9.8. Marcopolo SA
- 9.8.1. Company overview
- 9.8.2. Key executives
- 9.8.3. Company snapshot
- 9.8.4. Operating business segments
- 9.8.5. Product portfolio
- 9.8.6. Business performance
- 9.8.7. Key strategic moves and developments
- 9.9. FORCE MOTORS Ltd
- 9.9.1. Company overview
- 9.9.2. Key executives
- 9.9.3. Company snapshot
- 9.9.4. Operating business segments
- 9.9.5. Product portfolio
- 9.9.6. Business performance
- 9.10. Volkswagen Group
- 9.10.1. Company overview
- 9.10.2. Key executives
- 9.10.3. Company snapshot
- 9.10.4. Operating business segments
- 9.10.5. Product portfolio
- 9.10.6. Business performance
