 |
市場調査レポート
商品コード
1447168
バニラエキス市場:製品タイプ別、由来別、用途別、流通チャネル別:世界の機会分析と産業予測、2023-2032年Vanilla Extract Market By Product Type, By Source, By Application, By Distribution Channel : Global Opportunity Analysis and Industry Forecast, 2023-2032 |
||||||

| バニラエキス市場:製品タイプ別、由来別、用途別、流通チャネル別:世界の機会分析と産業予測、2023-2032年 |
|
出版日: 2024年01月30日
発行: Allied Market Research
ページ情報: 英文 185 Pages
納期: 2~3営業日
|
- 全表示
- 概要
- 図表
- 目次
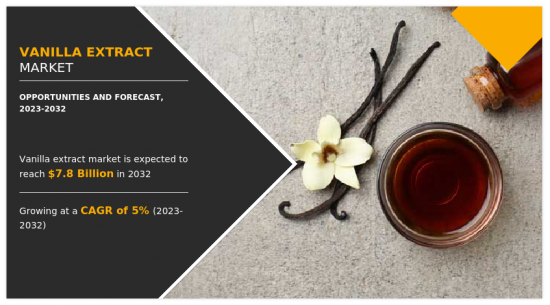
世界のバニラエキス市場は、2022年には47億9,950万米ドルと評価され、2023年から2032年までのCAGRは4.9%を記録し、2032年には77億6,730万米ドルに達すると予測されています。
現在、バニラエキスは飲食品において主要な役割を果たしており、世界の飲食品産業に大きな影響を与えています。国際的な料理への関心の高まりとともに、多様で本格的な風味への認識が高まっていることが、幅広いバニラエキス製品への需要を促進しています。
加工・焼成食品への需要の高まりは、バニラエキス製品の市場成長を増大させる重要な要因として浮上しています。ベーカリー加工食品の需要の増加は、バニラエキスの市場需要を大きく後押ししています。バニラは、ケーキ、クッキー、ペストリー、マフィン、パンなどを含む幅広い焼き菓子に使用される古典的なフレーバーであり、製パン業界におけるバニラエキスの需要を増加させています。バニラエキスの特徴的な品質は、これらの製品の全体的な風味プロファイルを強化し、消費者にとってより魅力的になります。バニラから焼き菓子の手軽さや伝統を連想する消費者は多いです。ベーカリー業界が親しみやすく伝統的な風味を求める消費者の嗜好に応えるにつれて、バニラエキスの需要は今後数年間で増加すると予想されます。
さらに、高級で高品質な焼き菓子を求める動向から、バニラエキスを含む天然素材や高級素材の使用が増加しています。消費者は、優れた味と品質を提供するベーカリー製品に高いお金を払うことを望んでおり、バニラは高級な感覚体験を提供する上で重要な役割を果たしています。加えて、ベーカリー食品はお祝い事や特別な日、祝祭日を連想させることが多いです。バースデーケーキ、ウエディングケーキ、ホリデークッキーなど、バニラ風味のお菓子はこうした焼き菓子の定番であり、バニラエキスの季節需要やイベント需要を後押ししています。
バニラエキス業界におけるもう一つの注目すべき動向は、地域の垣根を越えた世界化です。バニラエキス市場で事業を展開するブランドは新興市場に進出しており、これが同分野の成長を後押ししています。世界サプライチェーンは、原材料の調達、生産、包装工程に複数の国を巻き込み、製品の多様性と世界中の消費者へのアクセスを促進しています。国や地域によって異なる規制環境は、バニラエキス市場にとって不可欠です。これらの規制は、製品の安全性、表示仕様、成分制限を扱うため、製品開拓とマーケティングに影響を与えます。成分開示に対する顧客の要求の高まりと規制強化が、クリーンでオーガニックなバニラエキス製品の出現を後押ししています。
バニラエキス業界は、デジタル革命によりオンライン販売チャネルや消費者直販(DTC)モデルへの移行が著しいです。DTCモデルは、ブランドが消費者と直接的なつながりを築くことを可能にする一方で、オンライン・プラットフォームは、利便性、幅広い製品、パーソナライズされたショッピング体験を提供します。消費者のエンゲージメントと売上は、インフルエンサーとの提携や試着サービスなど、デジタル・マーケティングによって大きく左右されます。環境に優しいパッケージの使用や倫理的な原料調達など、持続可能性や倫理的な懸念がより重要になってきています。消費者の間でオーガニック・バニラエキスの需要が高まり、製品の調達や仕出しの方法が変化しています。
バニラエキス市場は、製品タイプ、由来、用途、流通チャネル、地域に基づいて分析されます。製品タイプ別では、市場は粉末と液体に二分されます。供給源別では、市場は天然と合成に区分されます。用途別では、市場は飲食品、パーソナルケア、その他に分けられます。流通チャネル別では、B2B、スーパーマーケット/ハイパーマーケット、コンビニエンスストア、百貨店、オンライン販売チャネルに分類されます。地域別では、北米(米国、カナダ、メキシコ)、欧州(ドイツ、英国、フランス、イタリア、スペイン、デンマーク、その他欧州地域)、アジア太平洋(中国、インド、日本、タイ、シンガポール、その他アジア太平洋地域)、ラテンアメリカ(ブラジル、ペルー、コロンビア、アルゼンチン、その他アジア太平洋地域)、MEA(南アフリカ、サウジアラビア、エジプト、ナイジェリア、その他アジア太平洋地域)で分析されます。
利害関係者にとっての主なメリット
- 当レポートでは、2022年から2032年までのバニラエキス市場分析の市場セグメント、現在の動向、推定・動向分析、ダイナミクスを定量的に分析し、バニラエキス市場の有力な機会を特定します。
- 市場促進要因、市場抑制要因、市場機会に関連する情報とともに市場調査を提供します。
- ポーターのファイブフォース分析では、利害関係者が利益重視のビジネス決定を下し、サプライヤーとバイヤーのネットワークを強化できるように、バイヤーとサプライヤーの潜在力を強調します。
- バニラエキスの市場セグメンテーションの詳細な分析は、市場機会を決定するのに役立ちます。
- 各地域の主要国は、世界市場への収益貢献度に応じてマッピングされています。
- 市場プレイヤーのポジショニングは、ベンチマーキングを容易にし、市場プレイヤーの現在のポジションの明確な理解を提供します。
- 地域別および世界のバニラエキスの市場動向、主要企業、市場セグメント、応用分野、市場成長戦略の分析を含みます。
本レポートで可能なレポートカスタマイズ
- 製品に含まれる原材料の分析(%別)
- 消費者の購買行動分析
- エンドユーザーの嗜好とペインポイント
- 製品ライフサイクル
- サプライチェーン分析とベンダーのマージン
- 消費者の平均支出
- 消費者の嗜好と製品仕様
- 流通業者のマージン分析
- 規制ガイドライン
- 顧客の関心に応じた追加企業プロファイル
- 国別または地域別追加分析-市場規模と予測
- ブランドシェア分析
- 企業プロファイルの拡張リスト
- 過去の市場データ
- 輸出入分析/データ
- 主要プレーヤーの詳細(所在地、連絡先、サプライヤー/ベンダーネットワークなどを含む、エクセル形式)
- 顧客/消費者/原料サプライヤーのリスト-バリューチェーン分析
- 世界/地域/国別レベルでのプレーヤーの市場シェア分析
- SWOT分析
目次
第1章 イントロダクション
第2章 エグゼクティブサマリー
第3章 市場概要
- 市場の定義と範囲
- 主な調査結果
- 影響要因
- 主な投資機会
- ポーターのファイブフォース分析
- 市場力学
- 促進要因
- 抑制要因
- 機会
第4章 バニラエキス市場:製品タイプ別
- 概要
- 粉末
- 液体
第5章 バニラエキス市場:由来別
- 概要
- 天然
- 合成
第6章 バニラエキス市場:用途別
- 概要
- 飲食品
- パーソナルケア
- その他
第7章 バニラエキス市場:流通チャネル別
- 概要
- 企業間取引
- スーパーマーケット-ハイパーマーケット
- コンビニエンスストア
- 百貨店
- オンライン販売チャネル
第8章 バニラエキス市場:地域別
- 概要
- 北米
- 米国
- カナダ
- メキシコ
- 欧州
- ドイツ
- 英国
- フランス
- イタリア
- スペイン
- デンマーク
- その他
- アジア太平洋
- 中国
- インド
- 日本
- タイ
- シンガポール
- その他
- ラテンアメリカ
- ブラジル
- アルゼンチン
- コロンビア
- その他ラテンアメリカ
- 中東・アフリカ
- Gcc
- 南アフリカ
- 北アフリカ
- その他中東とアフリカ
第9章 競合情勢
- イントロダクション
- 主要成功戦略
- 主要10社の製品マッピング
- 競合ダッシュボード
- 競合ヒートマップ
- 主要企業のポジショニング、2022年
第10章 企業プロファイル
- McCormick & Company, Inc.
- Firmenich SA
- Adams Flavors
- Foods & Ingredients, LLC
- OliveNation LLC
- Nielsen-Massey Vanillas, Inc.
- Naturalight Foods Inc.
- Frontier Co-op.
- Kerry Group plc.
- Saucer Brands, Inc.
LIST OF TABLES
- TABLE 01. GLOBAL VANILLA EXTRACT MARKET, BY PRODUCT TYPE, 2022-2032 ($MILLION)
- TABLE 02. VANILLA EXTRACT MARKET FOR POWDER, BY REGION, 2022-2032 ($MILLION)
- TABLE 03. VANILLA EXTRACT MARKET FOR LIQUID, BY REGION, 2022-2032 ($MILLION)
- TABLE 04. GLOBAL VANILLA EXTRACT MARKET, BY SOURCE, 2022-2032 ($MILLION)
- TABLE 05. VANILLA EXTRACT MARKET FOR NATURAL, BY REGION, 2022-2032 ($MILLION)
- TABLE 06. VANILLA EXTRACT MARKET FOR SYNTHETIC, BY REGION, 2022-2032 ($MILLION)
- TABLE 07. GLOBAL VANILLA EXTRACT MARKET, BY APPLICATION, 2022-2032 ($MILLION)
- TABLE 08. VANILLA EXTRACT MARKET FOR FOOD AND BEVERAGES, BY REGION, 2022-2032 ($MILLION)
- TABLE 09. VANILLA EXTRACT MARKET FOR PERSONAL CARE, BY REGION, 2022-2032 ($MILLION)
- TABLE 10. VANILLA EXTRACT MARKET FOR OTHERS, BY REGION, 2022-2032 ($MILLION)
- TABLE 11. GLOBAL VANILLA EXTRACT MARKET, BY DISTRIBUTION CHANNEL, 2022-2032 ($MILLION)
- TABLE 12. VANILLA EXTRACT MARKET FOR BUSINESS-TO-BUSINESS, BY REGION, 2022-2032 ($MILLION)
- TABLE 13. VANILLA EXTRACT MARKET FOR SUPERMARKETS-HYPERMARKETS, BY REGION, 2022-2032 ($MILLION)
- TABLE 14. VANILLA EXTRACT MARKET FOR CONVENIENCE STORES, BY REGION, 2022-2032 ($MILLION)
- TABLE 15. VANILLA EXTRACT MARKET FOR DEPARTMENTAL STORES, BY REGION, 2022-2032 ($MILLION)
- TABLE 16. VANILLA EXTRACT MARKET FOR ONLINE SALES CHANNELS, BY REGION, 2022-2032 ($MILLION)
- TABLE 17. VANILLA EXTRACT MARKET, BY REGION, 2022-2032 ($MILLION)
- TABLE 18. NORTH AMERICA VANILLA EXTRACT MARKET, BY PRODUCT TYPE, 2022-2032 ($MILLION)
- TABLE 19. NORTH AMERICA VANILLA EXTRACT MARKET, BY SOURCE, 2022-2032 ($MILLION)
- TABLE 20. NORTH AMERICA VANILLA EXTRACT MARKET, BY APPLICATION, 2022-2032 ($MILLION)
- TABLE 21. NORTH AMERICA VANILLA EXTRACT MARKET, BY DISTRIBUTION CHANNEL, 2022-2032 ($MILLION)
- TABLE 22. NORTH AMERICA VANILLA EXTRACT MARKET, BY COUNTRY, 2022-2032 ($MILLION)
- TABLE 23. U.S. VANILLA EXTRACT MARKET, BY PRODUCT TYPE, 2022-2032 ($MILLION)
- TABLE 24. U.S. VANILLA EXTRACT MARKET, BY SOURCE, 2022-2032 ($MILLION)
- TABLE 25. U.S. VANILLA EXTRACT MARKET, BY APPLICATION, 2022-2032 ($MILLION)
- TABLE 26. U.S. VANILLA EXTRACT MARKET, BY DISTRIBUTION CHANNEL, 2022-2032 ($MILLION)
- TABLE 27. CANADA VANILLA EXTRACT MARKET, BY PRODUCT TYPE, 2022-2032 ($MILLION)
- TABLE 28. CANADA VANILLA EXTRACT MARKET, BY SOURCE, 2022-2032 ($MILLION)
- TABLE 29. CANADA VANILLA EXTRACT MARKET, BY APPLICATION, 2022-2032 ($MILLION)
- TABLE 30. CANADA VANILLA EXTRACT MARKET, BY DISTRIBUTION CHANNEL, 2022-2032 ($MILLION)
- TABLE 31. MEXICO VANILLA EXTRACT MARKET, BY PRODUCT TYPE, 2022-2032 ($MILLION)
- TABLE 32. MEXICO VANILLA EXTRACT MARKET, BY SOURCE, 2022-2032 ($MILLION)
- TABLE 33. MEXICO VANILLA EXTRACT MARKET, BY APPLICATION, 2022-2032 ($MILLION)
- TABLE 34. MEXICO VANILLA EXTRACT MARKET, BY DISTRIBUTION CHANNEL, 2022-2032 ($MILLION)
- TABLE 35. EUROPE VANILLA EXTRACT MARKET, BY PRODUCT TYPE, 2022-2032 ($MILLION)
- TABLE 36. EUROPE VANILLA EXTRACT MARKET, BY SOURCE, 2022-2032 ($MILLION)
- TABLE 37. EUROPE VANILLA EXTRACT MARKET, BY APPLICATION, 2022-2032 ($MILLION)
- TABLE 38. EUROPE VANILLA EXTRACT MARKET, BY DISTRIBUTION CHANNEL, 2022-2032 ($MILLION)
- TABLE 39. EUROPE VANILLA EXTRACT MARKET, BY COUNTRY, 2022-2032 ($MILLION)
- TABLE 40. GERMANY VANILLA EXTRACT MARKET, BY PRODUCT TYPE, 2022-2032 ($MILLION)
- TABLE 41. GERMANY VANILLA EXTRACT MARKET, BY SOURCE, 2022-2032 ($MILLION)
- TABLE 42. GERMANY VANILLA EXTRACT MARKET, BY APPLICATION, 2022-2032 ($MILLION)
- TABLE 43. GERMANY VANILLA EXTRACT MARKET, BY DISTRIBUTION CHANNEL, 2022-2032 ($MILLION)
- TABLE 44. UK VANILLA EXTRACT MARKET, BY PRODUCT TYPE, 2022-2032 ($MILLION)
- TABLE 45. UK VANILLA EXTRACT MARKET, BY SOURCE, 2022-2032 ($MILLION)
- TABLE 46. UK VANILLA EXTRACT MARKET, BY APPLICATION, 2022-2032 ($MILLION)
- TABLE 47. UK VANILLA EXTRACT MARKET, BY DISTRIBUTION CHANNEL, 2022-2032 ($MILLION)
- TABLE 48. FRANCE VANILLA EXTRACT MARKET, BY PRODUCT TYPE, 2022-2032 ($MILLION)
- TABLE 49. FRANCE VANILLA EXTRACT MARKET, BY SOURCE, 2022-2032 ($MILLION)
- TABLE 50. FRANCE VANILLA EXTRACT MARKET, BY APPLICATION, 2022-2032 ($MILLION)
- TABLE 51. FRANCE VANILLA EXTRACT MARKET, BY DISTRIBUTION CHANNEL, 2022-2032 ($MILLION)
- TABLE 52. ITALY VANILLA EXTRACT MARKET, BY PRODUCT TYPE, 2022-2032 ($MILLION)
- TABLE 53. ITALY VANILLA EXTRACT MARKET, BY SOURCE, 2022-2032 ($MILLION)
- TABLE 54. ITALY VANILLA EXTRACT MARKET, BY APPLICATION, 2022-2032 ($MILLION)
- TABLE 55. ITALY VANILLA EXTRACT MARKET, BY DISTRIBUTION CHANNEL, 2022-2032 ($MILLION)
- TABLE 56. SPAIN VANILLA EXTRACT MARKET, BY PRODUCT TYPE, 2022-2032 ($MILLION)
- TABLE 57. SPAIN VANILLA EXTRACT MARKET, BY SOURCE, 2022-2032 ($MILLION)
- TABLE 58. SPAIN VANILLA EXTRACT MARKET, BY APPLICATION, 2022-2032 ($MILLION)
- TABLE 59. SPAIN VANILLA EXTRACT MARKET, BY DISTRIBUTION CHANNEL, 2022-2032 ($MILLION)
- TABLE 60. DENMARK VANILLA EXTRACT MARKET, BY PRODUCT TYPE, 2022-2032 ($MILLION)
- TABLE 61. DENMARK VANILLA EXTRACT MARKET, BY SOURCE, 2022-2032 ($MILLION)
- TABLE 62. DENMARK VANILLA EXTRACT MARKET, BY APPLICATION, 2022-2032 ($MILLION)
- TABLE 63. DENMARK VANILLA EXTRACT MARKET, BY DISTRIBUTION CHANNEL, 2022-2032 ($MILLION)
- TABLE 64. REST OF EUROPE VANILLA EXTRACT MARKET, BY PRODUCT TYPE, 2022-2032 ($MILLION)
- TABLE 65. REST OF EUROPE VANILLA EXTRACT MARKET, BY SOURCE, 2022-2032 ($MILLION)
- TABLE 66. REST OF EUROPE VANILLA EXTRACT MARKET, BY APPLICATION, 2022-2032 ($MILLION)
- TABLE 67. REST OF EUROPE VANILLA EXTRACT MARKET, BY DISTRIBUTION CHANNEL, 2022-2032 ($MILLION)
- TABLE 68. ASIA-PACIFIC VANILLA EXTRACT MARKET, BY PRODUCT TYPE, 2022-2032 ($MILLION)
- TABLE 69. ASIA-PACIFIC VANILLA EXTRACT MARKET, BY SOURCE, 2022-2032 ($MILLION)
- TABLE 70. ASIA-PACIFIC VANILLA EXTRACT MARKET, BY APPLICATION, 2022-2032 ($MILLION)
- TABLE 71. ASIA-PACIFIC VANILLA EXTRACT MARKET, BY DISTRIBUTION CHANNEL, 2022-2032 ($MILLION)
- TABLE 72. ASIA-PACIFIC VANILLA EXTRACT MARKET, BY COUNTRY, 2022-2032 ($MILLION)
- TABLE 73. CHINA VANILLA EXTRACT MARKET, BY PRODUCT TYPE, 2022-2032 ($MILLION)
- TABLE 74. CHINA VANILLA EXTRACT MARKET, BY SOURCE, 2022-2032 ($MILLION)
- TABLE 75. CHINA VANILLA EXTRACT MARKET, BY APPLICATION, 2022-2032 ($MILLION)
- TABLE 76. CHINA VANILLA EXTRACT MARKET, BY DISTRIBUTION CHANNEL, 2022-2032 ($MILLION)
- TABLE 77. INDIA VANILLA EXTRACT MARKET, BY PRODUCT TYPE, 2022-2032 ($MILLION)
- TABLE 78. INDIA VANILLA EXTRACT MARKET, BY SOURCE, 2022-2032 ($MILLION)
- TABLE 79. INDIA VANILLA EXTRACT MARKET, BY APPLICATION, 2022-2032 ($MILLION)
- TABLE 80. INDIA VANILLA EXTRACT MARKET, BY DISTRIBUTION CHANNEL, 2022-2032 ($MILLION)
- TABLE 81. JAPAN VANILLA EXTRACT MARKET, BY PRODUCT TYPE, 2022-2032 ($MILLION)
- TABLE 82. JAPAN VANILLA EXTRACT MARKET, BY SOURCE, 2022-2032 ($MILLION)
- TABLE 83. JAPAN VANILLA EXTRACT MARKET, BY APPLICATION, 2022-2032 ($MILLION)
- TABLE 84. JAPAN VANILLA EXTRACT MARKET, BY DISTRIBUTION CHANNEL, 2022-2032 ($MILLION)
- TABLE 85. THAILAND VANILLA EXTRACT MARKET, BY PRODUCT TYPE, 2022-2032 ($MILLION)
- TABLE 86. THAILAND VANILLA EXTRACT MARKET, BY SOURCE, 2022-2032 ($MILLION)
- TABLE 87. THAILAND VANILLA EXTRACT MARKET, BY APPLICATION, 2022-2032 ($MILLION)
- TABLE 88. THAILAND VANILLA EXTRACT MARKET, BY DISTRIBUTION CHANNEL, 2022-2032 ($MILLION)
- TABLE 89. SINGAPORE VANILLA EXTRACT MARKET, BY PRODUCT TYPE, 2022-2032 ($MILLION)
- TABLE 90. SINGAPORE VANILLA EXTRACT MARKET, BY SOURCE, 2022-2032 ($MILLION)
- TABLE 91. SINGAPORE VANILLA EXTRACT MARKET, BY APPLICATION, 2022-2032 ($MILLION)
- TABLE 92. SINGAPORE VANILLA EXTRACT MARKET, BY DISTRIBUTION CHANNEL, 2022-2032 ($MILLION)
- TABLE 93. REST OF ASIA-PACIFIC VANILLA EXTRACT MARKET, BY PRODUCT TYPE, 2022-2032 ($MILLION)
- TABLE 94. REST OF ASIA-PACIFIC VANILLA EXTRACT MARKET, BY SOURCE, 2022-2032 ($MILLION)
- TABLE 95. REST OF ASIA-PACIFIC VANILLA EXTRACT MARKET, BY APPLICATION, 2022-2032 ($MILLION)
- TABLE 96. REST OF ASIA-PACIFIC VANILLA EXTRACT MARKET, BY DISTRIBUTION CHANNEL, 2022-2032 ($MILLION)
- TABLE 97. LATIN AMERICA VANILLA EXTRACT MARKET, BY PRODUCT TYPE, 2022-2032 ($MILLION)
- TABLE 98. LATIN AMERICA VANILLA EXTRACT MARKET, BY SOURCE, 2022-2032 ($MILLION)
- TABLE 99. LATIN AMERICA VANILLA EXTRACT MARKET, BY APPLICATION, 2022-2032 ($MILLION)
- TABLE 100. LATIN AMERICA VANILLA EXTRACT MARKET, BY DISTRIBUTION CHANNEL, 2022-2032 ($MILLION)
- TABLE 101. LATIN AMERICA VANILLA EXTRACT MARKET, BY COUNTRY, 2022-2032 ($MILLION)
- TABLE 102. BRAZIL VANILLA EXTRACT MARKET, BY PRODUCT TYPE, 2022-2032 ($MILLION)
- TABLE 103. BRAZIL VANILLA EXTRACT MARKET, BY SOURCE, 2022-2032 ($MILLION)
- TABLE 104. BRAZIL VANILLA EXTRACT MARKET, BY APPLICATION, 2022-2032 ($MILLION)
- TABLE 105. BRAZIL VANILLA EXTRACT MARKET, BY DISTRIBUTION CHANNEL, 2022-2032 ($MILLION)
- TABLE 106. ARGENTINA VANILLA EXTRACT MARKET, BY PRODUCT TYPE, 2022-2032 ($MILLION)
- TABLE 107. ARGENTINA VANILLA EXTRACT MARKET, BY SOURCE, 2022-2032 ($MILLION)
- TABLE 108. ARGENTINA VANILLA EXTRACT MARKET, BY APPLICATION, 2022-2032 ($MILLION)
- TABLE 109. ARGENTINA VANILLA EXTRACT MARKET, BY DISTRIBUTION CHANNEL, 2022-2032 ($MILLION)
- TABLE 110. COLOMBIA VANILLA EXTRACT MARKET, BY PRODUCT TYPE, 2022-2032 ($MILLION)
- TABLE 111. COLOMBIA VANILLA EXTRACT MARKET, BY SOURCE, 2022-2032 ($MILLION)
- TABLE 112. COLOMBIA VANILLA EXTRACT MARKET, BY APPLICATION, 2022-2032 ($MILLION)
- TABLE 113. COLOMBIA VANILLA EXTRACT MARKET, BY DISTRIBUTION CHANNEL, 2022-2032 ($MILLION)
- TABLE 114. REST OF LATIN AMERICA VANILLA EXTRACT MARKET, BY PRODUCT TYPE, 2022-2032 ($MILLION)
- TABLE 115. REST OF LATIN AMERICA VANILLA EXTRACT MARKET, BY SOURCE, 2022-2032 ($MILLION)
- TABLE 116. REST OF LATIN AMERICA VANILLA EXTRACT MARKET, BY APPLICATION, 2022-2032 ($MILLION)
- TABLE 117. REST OF LATIN AMERICA VANILLA EXTRACT MARKET, BY DISTRIBUTION CHANNEL, 2022-2032 ($MILLION)
- TABLE 118. MIDDLE EAST AND AFRICA VANILLA EXTRACT MARKET, BY PRODUCT TYPE, 2022-2032 ($MILLION)
- TABLE 119. MIDDLE EAST AND AFRICA VANILLA EXTRACT MARKET, BY SOURCE, 2022-2032 ($MILLION)
- TABLE 120. MIDDLE EAST AND AFRICA VANILLA EXTRACT MARKET, BY APPLICATION, 2022-2032 ($MILLION)
- TABLE 121. MIDDLE EAST AND AFRICA VANILLA EXTRACT MARKET, BY DISTRIBUTION CHANNEL, 2022-2032 ($MILLION)
- TABLE 122. MIDDLE EAST AND AFRICA VANILLA EXTRACT MARKET, BY COUNTRY, 2022-2032 ($MILLION)
- TABLE 123. GCC VANILLA EXTRACT MARKET, BY PRODUCT TYPE, 2022-2032 ($MILLION)
- TABLE 124. GCC VANILLA EXTRACT MARKET, BY SOURCE, 2022-2032 ($MILLION)
- TABLE 125. GCC VANILLA EXTRACT MARKET, BY APPLICATION, 2022-2032 ($MILLION)
- TABLE 126. GCC VANILLA EXTRACT MARKET, BY DISTRIBUTION CHANNEL, 2022-2032 ($MILLION)
- TABLE 127. SOUTH AFRICA VANILLA EXTRACT MARKET, BY PRODUCT TYPE, 2022-2032 ($MILLION)
- TABLE 128. SOUTH AFRICA VANILLA EXTRACT MARKET, BY SOURCE, 2022-2032 ($MILLION)
- TABLE 129. SOUTH AFRICA VANILLA EXTRACT MARKET, BY APPLICATION, 2022-2032 ($MILLION)
- TABLE 130. SOUTH AFRICA VANILLA EXTRACT MARKET, BY DISTRIBUTION CHANNEL, 2022-2032 ($MILLION)
- TABLE 131. NORTH AFRICA VANILLA EXTRACT MARKET, BY PRODUCT TYPE, 2022-2032 ($MILLION)
- TABLE 132. NORTH AFRICA VANILLA EXTRACT MARKET, BY SOURCE, 2022-2032 ($MILLION)
- TABLE 133. NORTH AFRICA VANILLA EXTRACT MARKET, BY APPLICATION, 2022-2032 ($MILLION)
- TABLE 134. NORTH AFRICA VANILLA EXTRACT MARKET, BY DISTRIBUTION CHANNEL, 2022-2032 ($MILLION)
- TABLE 135. REST OF MIDDLE EAST AND AFRICA VANILLA EXTRACT MARKET, BY PRODUCT TYPE, 2022-2032 ($MILLION)
- TABLE 136. REST OF MIDDLE EAST AND AFRICA VANILLA EXTRACT MARKET, BY SOURCE, 2022-2032 ($MILLION)
- TABLE 137. REST OF MIDDLE EAST AND AFRICA VANILLA EXTRACT MARKET, BY APPLICATION, 2022-2032 ($MILLION)
- TABLE 138. REST OF MIDDLE EAST AND AFRICA VANILLA EXTRACT MARKET, BY DISTRIBUTION CHANNEL, 2022-2032 ($MILLION)
- TABLE 139. MCCORMICK & COMPANY, INC.: KEY EXECUTIVES
- TABLE 140. MCCORMICK & COMPANY, INC.: COMPANY SNAPSHOT
- TABLE 141. MCCORMICK & COMPANY, INC.: PRODUCT SEGMENTS
- TABLE 142. MCCORMICK & COMPANY, INC.: SERVICE SEGMENTS
- TABLE 143. MCCORMICK & COMPANY, INC.: PRODUCT PORTFOLIO
- TABLE 144. MCCORMICK & COMPANY, INC.: KEY STRATERGIES
- TABLE 145. FIRMENICH SA: KEY EXECUTIVES
- TABLE 146. FIRMENICH SA: COMPANY SNAPSHOT
- TABLE 147. FIRMENICH SA: PRODUCT SEGMENTS
- TABLE 148. FIRMENICH SA: SERVICE SEGMENTS
- TABLE 149. FIRMENICH SA: PRODUCT PORTFOLIO
- TABLE 150. FIRMENICH SA: KEY STRATERGIES
- TABLE 151. ADAMS FLAVORS: KEY EXECUTIVES
- TABLE 152. ADAMS FLAVORS: COMPANY SNAPSHOT
- TABLE 153. ADAMS FLAVORS: PRODUCT SEGMENTS
- TABLE 154. ADAMS FLAVORS: SERVICE SEGMENTS
- TABLE 155. ADAMS FLAVORS: PRODUCT PORTFOLIO
- TABLE 156. ADAMS FLAVORS: KEY STRATERGIES
- TABLE 157. FOODS & INGREDIENTS, LLC: KEY EXECUTIVES
- TABLE 158. FOODS & INGREDIENTS, LLC: COMPANY SNAPSHOT
- TABLE 159. FOODS & INGREDIENTS, LLC: PRODUCT SEGMENTS
- TABLE 160. FOODS & INGREDIENTS, LLC: SERVICE SEGMENTS
- TABLE 161. FOODS & INGREDIENTS, LLC: PRODUCT PORTFOLIO
- TABLE 162. FOODS & INGREDIENTS, LLC: KEY STRATERGIES
- TABLE 163. OLIVENATION LLC: KEY EXECUTIVES
- TABLE 164. OLIVENATION LLC: COMPANY SNAPSHOT
- TABLE 165. OLIVENATION LLC: PRODUCT SEGMENTS
- TABLE 166. OLIVENATION LLC: SERVICE SEGMENTS
- TABLE 167. OLIVENATION LLC: PRODUCT PORTFOLIO
- TABLE 168. OLIVENATION LLC: KEY STRATERGIES
- TABLE 169. NIELSEN-MASSEY VANILLAS, INC.: KEY EXECUTIVES
- TABLE 170. NIELSEN-MASSEY VANILLAS, INC.: COMPANY SNAPSHOT
- TABLE 171. NIELSEN-MASSEY VANILLAS, INC.: PRODUCT SEGMENTS
- TABLE 172. NIELSEN-MASSEY VANILLAS, INC.: SERVICE SEGMENTS
- TABLE 173. NIELSEN-MASSEY VANILLAS, INC.: PRODUCT PORTFOLIO
- TABLE 174. NIELSEN-MASSEY VANILLAS, INC.: KEY STRATERGIES
- TABLE 175. NATURALIGHT FOODS INC.: KEY EXECUTIVES
- TABLE 176. NATURALIGHT FOODS INC.: COMPANY SNAPSHOT
- TABLE 177. NATURALIGHT FOODS INC.: PRODUCT SEGMENTS
- TABLE 178. NATURALIGHT FOODS INC.: SERVICE SEGMENTS
- TABLE 179. NATURALIGHT FOODS INC.: PRODUCT PORTFOLIO
- TABLE 180. NATURALIGHT FOODS INC.: KEY STRATERGIES
- TABLE 181. FRONTIER CO-OP.: KEY EXECUTIVES
- TABLE 182. FRONTIER CO-OP.: COMPANY SNAPSHOT
- TABLE 183. FRONTIER CO-OP.: PRODUCT SEGMENTS
- TABLE 184. FRONTIER CO-OP.: SERVICE SEGMENTS
- TABLE 185. FRONTIER CO-OP.: PRODUCT PORTFOLIO
- TABLE 186. FRONTIER CO-OP.: KEY STRATERGIES
- TABLE 187. KERRY GROUP PLC.: KEY EXECUTIVES
- TABLE 188. KERRY GROUP PLC.: COMPANY SNAPSHOT
- TABLE 189. KERRY GROUP PLC.: PRODUCT SEGMENTS
- TABLE 190. KERRY GROUP PLC.: SERVICE SEGMENTS
- TABLE 191. KERRY GROUP PLC.: PRODUCT PORTFOLIO
- TABLE 192. KERRY GROUP PLC.: KEY STRATERGIES
- TABLE 193. SAUCER BRANDS, INC.: KEY EXECUTIVES
- TABLE 194. SAUCER BRANDS, INC.: COMPANY SNAPSHOT
- TABLE 195. SAUCER BRANDS, INC.: PRODUCT SEGMENTS
- TABLE 196. SAUCER BRANDS, INC.: SERVICE SEGMENTS
- TABLE 197. SAUCER BRANDS, INC.: PRODUCT PORTFOLIO
- TABLE 198. SAUCER BRANDS, INC.: KEY STRATERGIES
LIST OF FIGURES
- FIGURE 01. VANILLA EXTRACT MARKET, 2022-2032
- FIGURE 02. SEGMENTATION OF VANILLA EXTRACT MARKET,2022-2032
- FIGURE 03. TOP IMPACTING FACTORS IN VANILLA EXTRACT MARKET
- FIGURE 04. TOP INVESTMENT POCKETS IN VANILLA EXTRACT MARKET (2023-2032)
- FIGURE 05. BARGAINING POWER OF SUPPLIERS
- FIGURE 06. BARGAINING POWER OF BUYERS
- FIGURE 07. THREAT OF SUBSTITUTION
- FIGURE 08. THREAT OF SUBSTITUTION
- FIGURE 09. COMPETITIVE RIVALRY
- FIGURE 10. GLOBAL VANILLA EXTRACT MARKET:DRIVERS, RESTRAINTS AND OPPORTUNITIES
- FIGURE 11. VANILLA EXTRACT MARKET, BY PRODUCT TYPE, 2022 AND 2032(%)
- FIGURE 12. COMPARATIVE SHARE ANALYSIS OF VANILLA EXTRACT MARKET FOR POWDER, BY COUNTRY 2022 AND 2032(%)
- FIGURE 13. COMPARATIVE SHARE ANALYSIS OF VANILLA EXTRACT MARKET FOR LIQUID, BY COUNTRY 2022 AND 2032(%)
- FIGURE 14. VANILLA EXTRACT MARKET, BY SOURCE, 2022 AND 2032(%)
- FIGURE 15. COMPARATIVE SHARE ANALYSIS OF VANILLA EXTRACT MARKET FOR NATURAL, BY COUNTRY 2022 AND 2032(%)
- FIGURE 16. COMPARATIVE SHARE ANALYSIS OF VANILLA EXTRACT MARKET FOR SYNTHETIC, BY COUNTRY 2022 AND 2032(%)
- FIGURE 17. VANILLA EXTRACT MARKET, BY APPLICATION, 2022 AND 2032(%)
- FIGURE 18. COMPARATIVE SHARE ANALYSIS OF VANILLA EXTRACT MARKET FOR FOOD AND BEVERAGES, BY COUNTRY 2022 AND 2032(%)
- FIGURE 19. COMPARATIVE SHARE ANALYSIS OF VANILLA EXTRACT MARKET FOR PERSONAL CARE, BY COUNTRY 2022 AND 2032(%)
- FIGURE 20. COMPARATIVE SHARE ANALYSIS OF VANILLA EXTRACT MARKET FOR OTHERS, BY COUNTRY 2022 AND 2032(%)
- FIGURE 21. VANILLA EXTRACT MARKET, BY DISTRIBUTION CHANNEL, 2022 AND 2032(%)
- FIGURE 22. COMPARATIVE SHARE ANALYSIS OF VANILLA EXTRACT MARKET FOR BUSINESS-TO-BUSINESS, BY COUNTRY 2022 AND 2032(%)
- FIGURE 23. COMPARATIVE SHARE ANALYSIS OF VANILLA EXTRACT MARKET FOR SUPERMARKETS-HYPERMARKETS, BY COUNTRY 2022 AND 2032(%)
- FIGURE 24. COMPARATIVE SHARE ANALYSIS OF VANILLA EXTRACT MARKET FOR CONVENIENCE STORES, BY COUNTRY 2022 AND 2032(%)
- FIGURE 25. COMPARATIVE SHARE ANALYSIS OF VANILLA EXTRACT MARKET FOR DEPARTMENTAL STORES, BY COUNTRY 2022 AND 2032(%)
- FIGURE 26. COMPARATIVE SHARE ANALYSIS OF VANILLA EXTRACT MARKET FOR ONLINE SALES CHANNELS, BY COUNTRY 2022 AND 2032(%)
- FIGURE 27. VANILLA EXTRACT MARKET BY REGION, 2022 AND 2032(%)
- FIGURE 28. U.S. VANILLA EXTRACT MARKET, 2022-2032 ($MILLION)
- FIGURE 29. CANADA VANILLA EXTRACT MARKET, 2022-2032 ($MILLION)
- FIGURE 30. MEXICO VANILLA EXTRACT MARKET, 2022-2032 ($MILLION)
- FIGURE 31. GERMANY VANILLA EXTRACT MARKET, 2022-2032 ($MILLION)
- FIGURE 32. UK VANILLA EXTRACT MARKET, 2022-2032 ($MILLION)
- FIGURE 33. FRANCE VANILLA EXTRACT MARKET, 2022-2032 ($MILLION)
- FIGURE 34. ITALY VANILLA EXTRACT MARKET, 2022-2032 ($MILLION)
- FIGURE 35. SPAIN VANILLA EXTRACT MARKET, 2022-2032 ($MILLION)
- FIGURE 36. DENMARK VANILLA EXTRACT MARKET, 2022-2032 ($MILLION)
- FIGURE 37. REST OF EUROPE VANILLA EXTRACT MARKET, 2022-2032 ($MILLION)
- FIGURE 38. CHINA VANILLA EXTRACT MARKET, 2022-2032 ($MILLION)
- FIGURE 39. INDIA VANILLA EXTRACT MARKET, 2022-2032 ($MILLION)
- FIGURE 40. JAPAN VANILLA EXTRACT MARKET, 2022-2032 ($MILLION)
- FIGURE 41. THAILAND VANILLA EXTRACT MARKET, 2022-2032 ($MILLION)
- FIGURE 42. SINGAPORE VANILLA EXTRACT MARKET, 2022-2032 ($MILLION)
- FIGURE 43. REST OF ASIA-PACIFIC VANILLA EXTRACT MARKET, 2022-2032 ($MILLION)
- FIGURE 44. BRAZIL VANILLA EXTRACT MARKET, 2022-2032 ($MILLION)
- FIGURE 45. ARGENTINA VANILLA EXTRACT MARKET, 2022-2032 ($MILLION)
- FIGURE 46. COLOMBIA VANILLA EXTRACT MARKET, 2022-2032 ($MILLION)
- FIGURE 47. REST OF LATIN AMERICA VANILLA EXTRACT MARKET, 2022-2032 ($MILLION)
- FIGURE 48. GCC VANILLA EXTRACT MARKET, 2022-2032 ($MILLION)
- FIGURE 49. SOUTH AFRICA VANILLA EXTRACT MARKET, 2022-2032 ($MILLION)
- FIGURE 50. NORTH AFRICA VANILLA EXTRACT MARKET, 2022-2032 ($MILLION)
- FIGURE 51. REST OF MIDDLE EAST AND AFRICA VANILLA EXTRACT MARKET, 2022-2032 ($MILLION)
- FIGURE 52. TOP WINNING STRATEGIES, BY YEAR
- FIGURE 53. TOP WINNING STRATEGIES, BY DEVELOPMENT
- FIGURE 54. TOP WINNING STRATEGIES, BY COMPANY
- FIGURE 55. PRODUCT MAPPING OF TOP 10 PLAYERS
- FIGURE 56. COMPETITIVE DASHBOARD
- FIGURE 57. COMPETITIVE HEATMAP: VANILLA EXTRACT MARKET
- FIGURE 58. TOP PLAYER POSITIONING, 2022
The global vanilla extract market was valued at $4,799.5 million in 2022, and is projected to reach $7,767.3 million by 2032, registering a CAGR of 4.9% from 2023 to 2032.
Currently, vanilla extract plays a major role in the food and beverage product, exerting significant influence on the global food and beverage industry. The growing awareness of diverse and authentic flavors, along with a rising interest in international cuisines, has fueled the demand for a wide range of vanilla extract products.
The growing demand for processed and baked food products has emerged as a significant driver for the increasing market growth of vanilla extract products. The rise in demand for processed bakery food products has significantly helped to boost the market demand for vanilla extracts. Vanilla is a classic flavor that is used in a wide range of baked goods, which includes cakes, cookies, pastries, muffins, and bread items, increases the demand for vanilla extracts in baking industry. The characteristic quality of vanilla extract strengthens the overall flavor profile of these products, which makes them more appealing to consumers. There are many consumers those associate vanilla with ease and tradition in baked goods. As the bakery industry caters to consumer preferences for familiar and classic flavors, the demand for vanilla extracts is expected to increase in coming years.
Moreover, the trend toward premium and high-quality baked goods has led to an increased use of natural and premium ingredients, including vanilla extract. Consumers are willing to pay more for bakery products that offer superior taste and quality, and vanilla plays a crucial role in delivering a premium sensory experience. In addition, baked food items are often associated with celebrations, special occasions, and holidays. Vanilla-flavored treats, such as birthday cakes, wedding cakes, and holiday cookies, are staples in these baked items, which thus helps to drive seasonal and event-based demand for vanilla extract.
Another noteworthy trend in the vanilla extract industry is globalization, which crosses regional boundaries. The brands operating in the vanilla extract market are expanding into emerging markets, which helps the sector grow. The global supply chain involves several nations in the procurement of ingredients, production, and packaging processes, promoting product variety and accessibility to consumers around the world. The regulatory environment, which varies by nation and region, is essential to the vanilla extract market. These regulations affect product development and marketing as they address product safety, labeling specifications, and ingredient limitations. Increased customer demand for ingredient disclosure and stronger regulations are driving the emergence of clean and organic vanilla extract products.
The vanilla extract industry has experienced a significant move toward online sales channels and direct-to-consumer (DTC) models owing to the digital revolution. While DTC models enable brands to forge direct connections with consumers, online platforms provide convenience, a wide range of products, and personalized shopping experiences. Consumer engagement and sales are mostly driven by digital marketing, including influencer partnerships and sample try-on services. Sustainability and ethical concerns, such as using eco-friendly packaging and sourcing ingredients ethically, have become more important. The demand for organic vanilla extract among consumers is changing how products are sourced and catered.
The vanilla extract market is analyzed on the basis of product type, source, application, distribution channel, and region. By product type, the market is bifurcated into powder and liquid. By source, the market is segmented into natural and synthetic. By application, the market is divided into food and beverages, personal care, and others. Depending on distribution channel, it is classified into B2B, supermarkets/hypermarkets, convenience stores, departmental stores, and online sales channel. Region-wise, the market is analyzed across North America (the U.S., Canada, and Mexico), Europe (Germany, the UK, France, Italy, Spain, Denmark, and the rest of Europe), Asia-Pacific (China, India, Japan, Thailand, Singapore, and the rest of Asia-Pacific), Latin America (Brazil, Peru, Colombia, Argentina, and the rest of Latin America), and MEA (South Africa, Saudi Arabia, Egypt, Nigeria, and the rest of MEA).
The major players operating in the global vanilla extract market are McCormick & Company, Inc., Firmenich SA, Adams Flavors, Foods & Ingredients, LLC, OliveNation LLC, Nielsen-Massey Vanillas, Inc., Naturalight Foods Inc., Frontier Co-op., Kerry Group plc., and Saucer Brands, Inc.
Key Benefits For Stakeholders
- This report provides a quantitative analysis of the market segments, current trends, estimations, and dynamics of the vanilla extract market analysis from 2022 to 2032 to identify the prevailing vanilla extract market opportunities.
- The market research is offered along with information related to key drivers, restraints, and opportunities.
- Porter's five forces analysis highlights the potency of buyers and suppliers to enable stakeholders make profit-oriented business decisions and strengthen their supplier-buyer network.
- In-depth analysis of the vanilla extract market segmentation assists to determine the prevailing market opportunities.
- Major countries in each region are mapped according to their revenue contribution to the global market.
- Market player positioning facilitates benchmarking and provides a clear understanding of the present position of the market players.
- The report includes the analysis of the regional as well as global vanilla extract market trends, key players, market segments, application areas, and market growth strategies.
Additional benefits you will get with this purchase are:
- Quarterly Update and* (only available with a corporate license, on listed price)
- 5 additional Company Profile of client Choice pre- or Post-purchase, as a free update.
- Free Upcoming Version on the Purchase of Five and Enterprise User License.
- 16 analyst hours of support* (post-purchase, if you find additional data requirements upon review of the report, you may receive support amounting to 16 analyst hours to solve questions, and post-sale queries)
- 15% Free Customization* (in case the scope or segment of the report does not match your requirements, 15% is equivalent to 3 working days of free work, applicable once)
- Free data Pack on the Five and Enterprise User License. (Excel version of the report)
- Free Updated report if the report is 6-12 months old or older.
- 24-hour priority response*
- Free Industry updates and white papers.
Possible Customization with this report (with additional cost and timeline, please talk to the sales executive to know more)
- Analysis of raw material in a product (by %)
- Consumer Buying Behavior Analysis
- End user preferences and pain points
- Product Life Cycles
- Supply Chain Analysis & Vendor Margins
- Average Consumer Expenditure
- Consumer Preference and Product Specifications
- Distributor margin Analysis
- Regulatory Guidelines
- Additional company profiles with specific to client's interest
- Additional country or region analysis- market size and forecast
- Brands Share Analysis
- Expanded list for Company Profiles
- Historic market data
- Import Export Analysis/Data
- Key player details (including location, contact details, supplier/vendor network etc. in excel format)
- List of customers/consumers/raw material suppliers- value chain analysis
- Market share analysis of players at global/region/country level
- SWOT Analysis
Key Market Segments
By Product Type
- Powder
- Liquid
By Source
- Natural
- Synthetic
By Application
- Food and Beverages
- Personal Care
- Others
By Distribution Channel
- Business-to-Business
- Supermarkets-Hypermarkets
- Convenience Stores
- Departmental Stores
- Online Sales Channels
By Region
- North America
- U.S.
- Canada
- Mexico
- Europe
- Germany
- UK
- France
- Italy
- Spain
- Denmark
- Rest of Europe
- Asia-Pacific
- China
- India
- Japan
- Thailand
- Singapore
- Rest of Asia-Pacific
- Latin America
- Brazil
- Argentina
- Colombia
- Rest of Latin America
- Middle East and Africa
- Gcc
- South Africa
- North Africa
- Rest of Middle East And Africa
Key Market Players:
- McCormick & Company, Inc.
- Firmenich SA
- Adams Flavors
- Foods & Ingredients, LLC
- OliveNation LLC
- Nielsen-Massey Vanillas, Inc.
- Naturalight Foods Inc.
- Frontier Co-op.
- Kerry Group plc.
- Saucer Brands, Inc.
TABLE OF CONTENTS
CHAPTER 1: INTRODUCTION
- 1.1. Report description
- 1.2. Key market segments
- 1.3. Key benefits to the stakeholders
- 1.4. Research methodology
- 1.4.1. Primary research
- 1.4.2. Secondary research
- 1.4.3. Analyst tools and models
CHAPTER 2: EXECUTIVE SUMMARY
- 2.1. CXO Perspective
CHAPTER 3: MARKET OVERVIEW
- 3.1. Market definition and scope
- 3.2. Key findings
- 3.2.1. Top impacting factors
- 3.2.2. Top investment pockets
- 3.3. Porter's five forces analysis
- 3.4. Market dynamics
- 3.4.1. Drivers
- 3.4.2. Restraints
- 3.4.3. Opportunities
CHAPTER 4: VANILLA EXTRACT MARKET, BY PRODUCT TYPE
- 4.1. Overview
- 4.1.1. Market size and forecast
- 4.2. Powder
- 4.2.1. Key market trends, growth factors and opportunities
- 4.2.2. Market size and forecast, by region
- 4.2.3. Market share analysis by country
- 4.3. Liquid
- 4.3.1. Key market trends, growth factors and opportunities
- 4.3.2. Market size and forecast, by region
- 4.3.3. Market share analysis by country
CHAPTER 5: VANILLA EXTRACT MARKET, BY SOURCE
- 5.1. Overview
- 5.1.1. Market size and forecast
- 5.2. Natural
- 5.2.1. Key market trends, growth factors and opportunities
- 5.2.2. Market size and forecast, by region
- 5.2.3. Market share analysis by country
- 5.3. Synthetic
- 5.3.1. Key market trends, growth factors and opportunities
- 5.3.2. Market size and forecast, by region
- 5.3.3. Market share analysis by country
CHAPTER 6: VANILLA EXTRACT MARKET, BY APPLICATION
- 6.1. Overview
- 6.1.1. Market size and forecast
- 6.2. Food and Beverages
- 6.2.1. Key market trends, growth factors and opportunities
- 6.2.2. Market size and forecast, by region
- 6.2.3. Market share analysis by country
- 6.3. Personal Care
- 6.3.1. Key market trends, growth factors and opportunities
- 6.3.2. Market size and forecast, by region
- 6.3.3. Market share analysis by country
- 6.4. Others
- 6.4.1. Key market trends, growth factors and opportunities
- 6.4.2. Market size and forecast, by region
- 6.4.3. Market share analysis by country
CHAPTER 7: VANILLA EXTRACT MARKET, BY DISTRIBUTION CHANNEL
- 7.1. Overview
- 7.1.1. Market size and forecast
- 7.2. Business-to-Business
- 7.2.1. Key market trends, growth factors and opportunities
- 7.2.2. Market size and forecast, by region
- 7.2.3. Market share analysis by country
- 7.3. Supermarkets-Hypermarkets
- 7.3.1. Key market trends, growth factors and opportunities
- 7.3.2. Market size and forecast, by region
- 7.3.3. Market share analysis by country
- 7.4. Convenience Stores
- 7.4.1. Key market trends, growth factors and opportunities
- 7.4.2. Market size and forecast, by region
- 7.4.3. Market share analysis by country
- 7.5. Departmental Stores
- 7.5.1. Key market trends, growth factors and opportunities
- 7.5.2. Market size and forecast, by region
- 7.5.3. Market share analysis by country
- 7.6. Online Sales Channels
- 7.6.1. Key market trends, growth factors and opportunities
- 7.6.2. Market size and forecast, by region
- 7.6.3. Market share analysis by country
CHAPTER 8: VANILLA EXTRACT MARKET, BY REGION
- 8.1. Overview
- 8.1.1. Market size and forecast By Region
- 8.2. North America
- 8.2.1. Key market trends, growth factors and opportunities
- 8.2.2. Market size and forecast, by Product Type
- 8.2.3. Market size and forecast, by Source
- 8.2.4. Market size and forecast, by Application
- 8.2.5. Market size and forecast, by Distribution Channel
- 8.2.6. Market size and forecast, by country
- 8.2.6.1. U.S.
- 8.2.6.1.1. Market size and forecast, by Product Type
- 8.2.6.1.2. Market size and forecast, by Source
- 8.2.6.1.3. Market size and forecast, by Application
- 8.2.6.1.4. Market size and forecast, by Distribution Channel
- 8.2.6.2. Canada
- 8.2.6.2.1. Market size and forecast, by Product Type
- 8.2.6.2.2. Market size and forecast, by Source
- 8.2.6.2.3. Market size and forecast, by Application
- 8.2.6.2.4. Market size and forecast, by Distribution Channel
- 8.2.6.3. Mexico
- 8.2.6.3.1. Market size and forecast, by Product Type
- 8.2.6.3.2. Market size and forecast, by Source
- 8.2.6.3.3. Market size and forecast, by Application
- 8.2.6.3.4. Market size and forecast, by Distribution Channel
- 8.3. Europe
- 8.3.1. Key market trends, growth factors and opportunities
- 8.3.2. Market size and forecast, by Product Type
- 8.3.3. Market size and forecast, by Source
- 8.3.4. Market size and forecast, by Application
- 8.3.5. Market size and forecast, by Distribution Channel
- 8.3.6. Market size and forecast, by country
- 8.3.6.1. Germany
- 8.3.6.1.1. Market size and forecast, by Product Type
- 8.3.6.1.2. Market size and forecast, by Source
- 8.3.6.1.3. Market size and forecast, by Application
- 8.3.6.1.4. Market size and forecast, by Distribution Channel
- 8.3.6.2. UK
- 8.3.6.2.1. Market size and forecast, by Product Type
- 8.3.6.2.2. Market size and forecast, by Source
- 8.3.6.2.3. Market size and forecast, by Application
- 8.3.6.2.4. Market size and forecast, by Distribution Channel
- 8.3.6.3. France
- 8.3.6.3.1. Market size and forecast, by Product Type
- 8.3.6.3.2. Market size and forecast, by Source
- 8.3.6.3.3. Market size and forecast, by Application
- 8.3.6.3.4. Market size and forecast, by Distribution Channel
- 8.3.6.4. Italy
- 8.3.6.4.1. Market size and forecast, by Product Type
- 8.3.6.4.2. Market size and forecast, by Source
- 8.3.6.4.3. Market size and forecast, by Application
- 8.3.6.4.4. Market size and forecast, by Distribution Channel
- 8.3.6.5. Spain
- 8.3.6.5.1. Market size and forecast, by Product Type
- 8.3.6.5.2. Market size and forecast, by Source
- 8.3.6.5.3. Market size and forecast, by Application
- 8.3.6.5.4. Market size and forecast, by Distribution Channel
- 8.3.6.6. Denmark
- 8.3.6.6.1. Market size and forecast, by Product Type
- 8.3.6.6.2. Market size and forecast, by Source
- 8.3.6.6.3. Market size and forecast, by Application
- 8.3.6.6.4. Market size and forecast, by Distribution Channel
- 8.3.6.7. Rest of Europe
- 8.3.6.7.1. Market size and forecast, by Product Type
- 8.3.6.7.2. Market size and forecast, by Source
- 8.3.6.7.3. Market size and forecast, by Application
- 8.3.6.7.4. Market size and forecast, by Distribution Channel
- 8.4. Asia-Pacific
- 8.4.1. Key market trends, growth factors and opportunities
- 8.4.2. Market size and forecast, by Product Type
- 8.4.3. Market size and forecast, by Source
- 8.4.4. Market size and forecast, by Application
- 8.4.5. Market size and forecast, by Distribution Channel
- 8.4.6. Market size and forecast, by country
- 8.4.6.1. China
- 8.4.6.1.1. Market size and forecast, by Product Type
- 8.4.6.1.2. Market size and forecast, by Source
- 8.4.6.1.3. Market size and forecast, by Application
- 8.4.6.1.4. Market size and forecast, by Distribution Channel
- 8.4.6.2. India
- 8.4.6.2.1. Market size and forecast, by Product Type
- 8.4.6.2.2. Market size and forecast, by Source
- 8.4.6.2.3. Market size and forecast, by Application
- 8.4.6.2.4. Market size and forecast, by Distribution Channel
- 8.4.6.3. Japan
- 8.4.6.3.1. Market size and forecast, by Product Type
- 8.4.6.3.2. Market size and forecast, by Source
- 8.4.6.3.3. Market size and forecast, by Application
- 8.4.6.3.4. Market size and forecast, by Distribution Channel
- 8.4.6.4. Thailand
- 8.4.6.4.1. Market size and forecast, by Product Type
- 8.4.6.4.2. Market size and forecast, by Source
- 8.4.6.4.3. Market size and forecast, by Application
- 8.4.6.4.4. Market size and forecast, by Distribution Channel
- 8.4.6.5. Singapore
- 8.4.6.5.1. Market size and forecast, by Product Type
- 8.4.6.5.2. Market size and forecast, by Source
- 8.4.6.5.3. Market size and forecast, by Application
- 8.4.6.5.4. Market size and forecast, by Distribution Channel
- 8.4.6.6. Rest of Asia-Pacific
- 8.4.6.6.1. Market size and forecast, by Product Type
- 8.4.6.6.2. Market size and forecast, by Source
- 8.4.6.6.3. Market size and forecast, by Application
- 8.4.6.6.4. Market size and forecast, by Distribution Channel
- 8.5. Latin America
- 8.5.1. Key market trends, growth factors and opportunities
- 8.5.2. Market size and forecast, by Product Type
- 8.5.3. Market size and forecast, by Source
- 8.5.4. Market size and forecast, by Application
- 8.5.5. Market size and forecast, by Distribution Channel
- 8.5.6. Market size and forecast, by country
- 8.5.6.1. Brazil
- 8.5.6.1.1. Market size and forecast, by Product Type
- 8.5.6.1.2. Market size and forecast, by Source
- 8.5.6.1.3. Market size and forecast, by Application
- 8.5.6.1.4. Market size and forecast, by Distribution Channel
- 8.5.6.2. Argentina
- 8.5.6.2.1. Market size and forecast, by Product Type
- 8.5.6.2.2. Market size and forecast, by Source
- 8.5.6.2.3. Market size and forecast, by Application
- 8.5.6.2.4. Market size and forecast, by Distribution Channel
- 8.5.6.3. Colombia
- 8.5.6.3.1. Market size and forecast, by Product Type
- 8.5.6.3.2. Market size and forecast, by Source
- 8.5.6.3.3. Market size and forecast, by Application
- 8.5.6.3.4. Market size and forecast, by Distribution Channel
- 8.5.6.4. Rest of Latin America
- 8.5.6.4.1. Market size and forecast, by Product Type
- 8.5.6.4.2. Market size and forecast, by Source
- 8.5.6.4.3. Market size and forecast, by Application
- 8.5.6.4.4. Market size and forecast, by Distribution Channel
- 8.6. Middle East and Africa
- 8.6.1. Key market trends, growth factors and opportunities
- 8.6.2. Market size and forecast, by Product Type
- 8.6.3. Market size and forecast, by Source
- 8.6.4. Market size and forecast, by Application
- 8.6.5. Market size and forecast, by Distribution Channel
- 8.6.6. Market size and forecast, by country
- 8.6.6.1. Gcc
- 8.6.6.1.1. Market size and forecast, by Product Type
- 8.6.6.1.2. Market size and forecast, by Source
- 8.6.6.1.3. Market size and forecast, by Application
- 8.6.6.1.4. Market size and forecast, by Distribution Channel
- 8.6.6.2. South Africa
- 8.6.6.2.1. Market size and forecast, by Product Type
- 8.6.6.2.2. Market size and forecast, by Source
- 8.6.6.2.3. Market size and forecast, by Application
- 8.6.6.2.4. Market size and forecast, by Distribution Channel
- 8.6.6.3. North Africa
- 8.6.6.3.1. Market size and forecast, by Product Type
- 8.6.6.3.2. Market size and forecast, by Source
- 8.6.6.3.3. Market size and forecast, by Application
- 8.6.6.3.4. Market size and forecast, by Distribution Channel
- 8.6.6.4. Rest of Middle East And Africa
- 8.6.6.4.1. Market size and forecast, by Product Type
- 8.6.6.4.2. Market size and forecast, by Source
- 8.6.6.4.3. Market size and forecast, by Application
- 8.6.6.4.4. Market size and forecast, by Distribution Channel
CHAPTER 9: COMPETITIVE LANDSCAPE
- 9.1. Introduction
- 9.2. Top winning strategies
- 9.3. Product mapping of top 10 player
- 9.4. Competitive dashboard
- 9.5. Competitive heatmap
- 9.6. Top player positioning, 2022
CHAPTER 10: COMPANY PROFILES
- 10.1. McCormick & Company, Inc.
- 10.1.1. Company overview
- 10.1.2. Key executives
- 10.1.3. Company snapshot
- 10.1.4. Operating business segments
- 10.1.5. Product portfolio
- 10.1.6. Business performance
- 10.1.7. Key strategic moves and developments
- 10.2. Firmenich SA
- 10.2.1. Company overview
- 10.2.2. Key executives
- 10.2.3. Company snapshot
- 10.2.4. Operating business segments
- 10.2.5. Product portfolio
- 10.2.6. Business performance
- 10.2.7. Key strategic moves and developments
- 10.3. Adams Flavors
- 10.3.1. Company overview
- 10.3.2. Key executives
- 10.3.3. Company snapshot
- 10.3.4. Operating business segments
- 10.3.5. Product portfolio
- 10.3.6. Business performance
- 10.3.7. Key strategic moves and developments
- 10.4. Foods & Ingredients, LLC
- 10.4.1. Company overview
- 10.4.2. Key executives
- 10.4.3. Company snapshot
- 10.4.4. Operating business segments
- 10.4.5. Product portfolio
- 10.4.6. Business performance
- 10.4.7. Key strategic moves and developments
- 10.5. OliveNation LLC
- 10.5.1. Company overview
- 10.5.2. Key executives
- 10.5.3. Company snapshot
- 10.5.4. Operating business segments
- 10.5.5. Product portfolio
- 10.5.6. Business performance
- 10.5.7. Key strategic moves and developments
- 10.6. Nielsen-Massey Vanillas, Inc.
- 10.6.1. Company overview
- 10.6.2. Key executives
- 10.6.3. Company snapshot
- 10.6.4. Operating business segments
- 10.6.5. Product portfolio
- 10.6.6. Business performance
- 10.6.7. Key strategic moves and developments
- 10.7. Naturalight Foods Inc.
- 10.7.1. Company overview
- 10.7.2. Key executives
- 10.7.3. Company snapshot
- 10.7.4. Operating business segments
- 10.7.5. Product portfolio
- 10.7.6. Business performance
- 10.7.7. Key strategic moves and developments
- 10.8. Frontier Co-op.
- 10.8.1. Company overview
- 10.8.2. Key executives
- 10.8.3. Company snapshot
- 10.8.4. Operating business segments
- 10.8.5. Product portfolio
- 10.8.6. Business performance
- 10.8.7. Key strategic moves and developments
- 10.9. Kerry Group plc.
- 10.9.1. Company overview
- 10.9.2. Key executives
- 10.9.3. Company snapshot
- 10.9.4. Operating business segments
- 10.9.5. Product portfolio
- 10.9.6. Business performance
- 10.9.7. Key strategic moves and developments
- 10.10. Saucer Brands, Inc.
- 10.10.1. Company overview
- 10.10.2. Key executives
- 10.10.3. Company snapshot
- 10.10.4. Operating business segments
- 10.10.5. Product portfolio
- 10.10.6. Business performance
- 10.10.7. Key strategic moves and developments