|
|
市場調査レポート
商品コード
1446944
解体用油圧アタッチメント市場:タイプ別、用途別、エンドユーザー別:世界の機会分析と産業予測、2024年~2033年Hydraulic Attachments For Demolition Market By Type, By Application, By End-User : Global Opportunity Analysis and Industry Forecast, 2024-2033 |
||||||
|
|
|||||||


| 解体用油圧アタッチメント市場:タイプ別、用途別、エンドユーザー別:世界の機会分析と産業予測、2024年~2033年 |
|
出版日: 2024年02月01日
発行: Allied Market Research
ページ情報: 英文 271 Pages
納期: 2~3営業日
|
- 全表示
- 概要
- 図表
- 目次
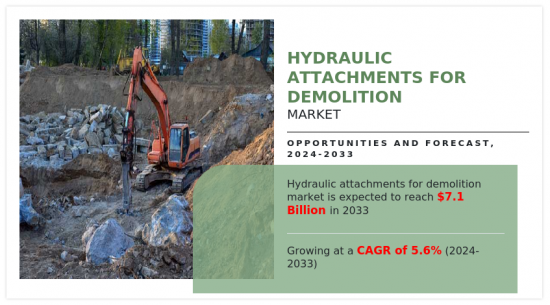
世界の解体用油圧アタッチメント市場は、2023年には41億3,670万米ドルと評価され、2024年から2033年までのCAGRは5.6%を記録し、2033年には71億3,310万米ドルに達すると予測されています。
解体用油圧アタッチメントは、建築現場の解体作業の効率と精度を向上させる独自設計のツールです。この広範なカテゴリーには、柔軟なマテリアルハンドリングのためのグラップル、岩石やコンクリート表面を破壊するためのブレーカー/ハンマーアタッチメント、建築資材を処理しリサイクルするためのクラッシャー/シャーアタッチメント、瓦礫を粉砕・粉砕するためのパルベライザー、引き裂き、圧縮、精密なハンドリングなどの追加機能を提供するサム、リッパー、クランチャーなどのアタッチメントが含まれます。これらの油圧アタッチメントは、インフラや建設プロジェクトのための建物解体に関わるあらゆる課題に対応できる柔軟性と汎用性を備えているため、解体プロセスの合理化に不可欠です。
世界の解体用油圧アタッチメント市場の成長に影響を与える重要な要因としては、先進国における建設・インフラ活動の増加が挙げられます。さらに、鉱業部門の開拓と石炭、金属、鉱物の需要の増加が、解体用油圧アタッチメント市場の成長を加速させています。しかし、熟練した有資格オペレーターの不足と新規建設活動の減少が市場成長を阻害する要因となっています。逆に、鉱業分野では技術的に先進的な機器への需要が高まっており、今後の成長機会が期待されます。
コスト削減を重視する建設会社は、解体用油圧アタッチメントから大きな利益を得ることができます。解体用油圧アタッチメントは、メンテナンスにグリースやオイルを必要とするため、内部部品は潤滑状態に保たれ、メンテナンスの手間を減らすことができます。解体工具が長持ちすればするほど、設備にかかる費用は少なくなります。したがって、主要プレーヤーは、鉱業や建設セクターのための高度で費用対効果の高い解体用油圧アタッチメントを製造しています。
例えば、2023年11月、SANY Groupは、2024年に正式発売を予定している、機能と性能を強化した小型掘削機の新モデル5機種を発表しました。欧州および北米市場向けに設計されたSY60C、SY75C、SY80U、SY95C、およびSY135Cは、江蘇省昆山にあるSANYの工業団地で生産されています。これは、SANYの海外市場向け世界製品戦略における重要な成果です。新モデルの発売は、油圧アタッチメントの需要を生み出すと期待されています。このような事例が、ひいては市場の成長を促進すると予想されます。
中国、インド、米国などの新興諸国における人口増加は、急速な都市化をもたらし、住宅セクターの発展を後押しし、油圧アタッチメントの需要を促進すると予想されます。国連(UN)によると、2050年までに世界人口の約68%が都市部に住むようになると予想されています。これにより、住宅、インフラ、非住宅の建設活動が世界中で増加すると予想されます。このように、これらすべての要因が総合的に解体用油圧アタッチメント市場の成長を後押ししています。
利害関係者にとっての主なメリット
- 当レポートでは、2023年から2033年までの解体用油圧アタッチメント市場分析の市場セグメント、現在の動向、推定・動向、力学の定量分析を提供し、解体用油圧アタッチメント市場の有力な市場機会を特定します。
- 市場促進要因、市場抑制要因、市場機会に関連する情報とともに市場調査を提供します。
- ポーターのファイブフォース分析では、利害関係者が利益重視のビジネス決定を下し、サプライヤーとバイヤーのネットワークを強化できるように、バイヤーとサプライヤーの潜在力を強調します。
- 解体用油圧アタッチメントの市場セグメンテーションを詳細に分析することで、市場機会を見極めることができます。
- 各地域の主要国は、世界市場への収益貢献度に応じてマッピングされています。
- 市場プレイヤーのポジショニングは、ベンチマーキングを容易にし、市場プレイヤーの現在のポジションの明確な理解を提供します。
- 本レポートには、地域別および世界の解体用油圧アタッチメント市場動向、主要企業、市場セグメント、応用分野、市場成長戦略の分析が含まれています。
本レポートで可能なカスタマイズ(追加費用とスケジュールがあります。)
- 投資機会
- 主要企業の新製品開発/製品マトリックス
- 顧客の関心に応じた追加企業プロファイル
- 国別または地域別の追加分析-市場規模と予測
- 企業プロファイルの拡張リスト
目次
第1章 イントロダクション
第2章 エグゼクティブサマリー
第3章 市場概要
- 市場の定義と範囲
- 主な調査結果
- 影響要因
- 主な投資機会
- ポーターのファイブフォース分析
- 市場力学
- 促進要因
- 石炭、金属、鉱山の需要の増加
- 急速な都市化と工業化
- 住宅・非住宅建設活動の急増
- 抑制要因
- 熟練した有資格オペレーターの不足
- 高い初期費用と設備投資
- 機会
- 鉱業部門における技術的に高度な機器への需要の高まり
- 建築インフラ部門への政府投資
- 促進要因
第4章 解体用油圧アタッチメント市場:タイプ別
- 概要
- ブレーカー/ハンマー
- クラッシャー/シャー
- パルベライザー
- グラップル
- その他
第5章 解体用油圧アタッチメント市場:用途別
- 概要
- 採鉱と掘削
- 土木工事と解体工事
第6章 解体用油圧アタッチメント市場:エンドユーザー別
- 概要
- 建設
- 鉱業
- 廃棄物処理とリサイクル
- ユーティリティ
第7章 解体用油圧アタッチメント市場:地域別
- 概要
- 北米
- 米国
- カナダ
- メキシコ
- 欧州
- ドイツ
- フランス
- 英国
- イタリア
- スペイン
- その他
- アジア太平洋
- 中国
- インド
- 日本
- 韓国
- オーストラリア
- その他
- ラテンアメリカ
- ラテンアメリカ
- 中東
- アフリカ
第8章 競合情勢
- イントロダクション
- 主要成功戦略
- 主要10社の製品マッピング
- 競合ダッシュボード
- 競合ヒートマップ
- 主要企業のポジショニング、2023年
第9章 企業プロファイル
- Sandvik AB
- Caterpillar
- Atlas Copco AB
- Epiroc AB
- Soosan Heavy Industries Co., Ltd.
- OKADA
- Montabert SAS
- Genesis Attachments
- Indeco
- Xcentric
LIST OF TABLES
- TABLE 01. GLOBAL HYDRAULIC ATTACHMENTS FOR DEMOLITION MARKET, BY TYPE, 2023-2033 ($MILLION)
- TABLE 02. HYDRAULIC ATTACHMENTS FOR DEMOLITION MARKET FOR BREAKER/HAMMER, BY REGION, 2023-2033 ($MILLION)
- TABLE 03. HYDRAULIC ATTACHMENTS FOR DEMOLITION MARKET FOR CRUSHER/SHEAR, BY REGION, 2023-2033 ($MILLION)
- TABLE 04. HYDRAULIC ATTACHMENTS FOR DEMOLITION MARKET FOR PULVERIZER, BY REGION, 2023-2033 ($MILLION)
- TABLE 05. HYDRAULIC ATTACHMENTS FOR DEMOLITION MARKET FOR GRAPPLE, BY REGION, 2023-2033 ($MILLION)
- TABLE 06. HYDRAULIC ATTACHMENTS FOR DEMOLITION MARKET FOR OTHERS, BY REGION, 2023-2033 ($MILLION)
- TABLE 07. GLOBAL HYDRAULIC ATTACHMENTS FOR DEMOLITION MARKET, BY APPLICATION, 2023-2033 ($MILLION)
- TABLE 08. HYDRAULIC ATTACHMENTS FOR DEMOLITION MARKET FOR MINING AND EXCAVATION, BY REGION, 2023-2033 ($MILLION)
- TABLE 09. HYDRAULIC ATTACHMENTS FOR DEMOLITION MARKET FOR EARTH MOVING AND DEMOLITION, BY REGION, 2023-2033 ($MILLION)
- TABLE 10. GLOBAL HYDRAULIC ATTACHMENTS FOR DEMOLITION MARKET, BY END-USER, 2023-2033 ($MILLION)
- TABLE 11. HYDRAULIC ATTACHMENTS FOR DEMOLITION MARKET FOR CONSTRUCTION, BY REGION, 2023-2033 ($MILLION)
- TABLE 12. HYDRAULIC ATTACHMENTS FOR DEMOLITION MARKET FOR MINING, BY REGION, 2023-2033 ($MILLION)
- TABLE 13. HYDRAULIC ATTACHMENTS FOR DEMOLITION MARKET FOR WASTE MANAGEMENT AND RECYCLING, BY REGION, 2023-2033 ($MILLION)
- TABLE 14. HYDRAULIC ATTACHMENTS FOR DEMOLITION MARKET FOR UTILITY, BY REGION, 2023-2033 ($MILLION)
- TABLE 15. HYDRAULIC ATTACHMENTS FOR DEMOLITION MARKET, BY REGION, 2023-2033 ($MILLION)
- TABLE 16. NORTH AMERICA HYDRAULIC ATTACHMENTS FOR DEMOLITION MARKET, BY TYPE, 2023-2033 ($MILLION)
- TABLE 17. NORTH AMERICA HYDRAULIC ATTACHMENTS FOR DEMOLITION MARKET, BY APPLICATION, 2023-2033 ($MILLION)
- TABLE 18. NORTH AMERICA HYDRAULIC ATTACHMENTS FOR DEMOLITION MARKET, BY END-USER, 2023-2033 ($MILLION)
- TABLE 19. NORTH AMERICA HYDRAULIC ATTACHMENTS FOR DEMOLITION MARKET, BY COUNTRY, 2023-2033 ($MILLION)
- TABLE 20. U.S. HYDRAULIC ATTACHMENTS FOR DEMOLITION MARKET, BY TYPE, 2023-2033 ($MILLION)
- TABLE 21. U.S. HYDRAULIC ATTACHMENTS FOR DEMOLITION MARKET, BY APPLICATION, 2023-2033 ($MILLION)
- TABLE 22. U.S. HYDRAULIC ATTACHMENTS FOR DEMOLITION MARKET, BY END-USER, 2023-2033 ($MILLION)
- TABLE 23. CANADA HYDRAULIC ATTACHMENTS FOR DEMOLITION MARKET, BY TYPE, 2023-2033 ($MILLION)
- TABLE 24. CANADA HYDRAULIC ATTACHMENTS FOR DEMOLITION MARKET, BY APPLICATION, 2023-2033 ($MILLION)
- TABLE 25. CANADA HYDRAULIC ATTACHMENTS FOR DEMOLITION MARKET, BY END-USER, 2023-2033 ($MILLION)
- TABLE 26. MEXICO HYDRAULIC ATTACHMENTS FOR DEMOLITION MARKET, BY TYPE, 2023-2033 ($MILLION)
- TABLE 27. MEXICO HYDRAULIC ATTACHMENTS FOR DEMOLITION MARKET, BY APPLICATION, 2023-2033 ($MILLION)
- TABLE 28. MEXICO HYDRAULIC ATTACHMENTS FOR DEMOLITION MARKET, BY END-USER, 2023-2033 ($MILLION)
- TABLE 29. EUROPE HYDRAULIC ATTACHMENTS FOR DEMOLITION MARKET, BY TYPE, 2023-2033 ($MILLION)
- TABLE 30. EUROPE HYDRAULIC ATTACHMENTS FOR DEMOLITION MARKET, BY APPLICATION, 2023-2033 ($MILLION)
- TABLE 31. EUROPE HYDRAULIC ATTACHMENTS FOR DEMOLITION MARKET, BY END-USER, 2023-2033 ($MILLION)
- TABLE 32. EUROPE HYDRAULIC ATTACHMENTS FOR DEMOLITION MARKET, BY COUNTRY, 2023-2033 ($MILLION)
- TABLE 33. GERMANY HYDRAULIC ATTACHMENTS FOR DEMOLITION MARKET, BY TYPE, 2023-2033 ($MILLION)
- TABLE 34. GERMANY HYDRAULIC ATTACHMENTS FOR DEMOLITION MARKET, BY APPLICATION, 2023-2033 ($MILLION)
- TABLE 35. GERMANY HYDRAULIC ATTACHMENTS FOR DEMOLITION MARKET, BY END-USER, 2023-2033 ($MILLION)
- TABLE 36. FRANCE HYDRAULIC ATTACHMENTS FOR DEMOLITION MARKET, BY TYPE, 2023-2033 ($MILLION)
- TABLE 37. FRANCE HYDRAULIC ATTACHMENTS FOR DEMOLITION MARKET, BY APPLICATION, 2023-2033 ($MILLION)
- TABLE 38. FRANCE HYDRAULIC ATTACHMENTS FOR DEMOLITION MARKET, BY END-USER, 2023-2033 ($MILLION)
- TABLE 39. UK HYDRAULIC ATTACHMENTS FOR DEMOLITION MARKET, BY TYPE, 2023-2033 ($MILLION)
- TABLE 40. UK HYDRAULIC ATTACHMENTS FOR DEMOLITION MARKET, BY APPLICATION, 2023-2033 ($MILLION)
- TABLE 41. UK HYDRAULIC ATTACHMENTS FOR DEMOLITION MARKET, BY END-USER, 2023-2033 ($MILLION)
- TABLE 42. ITALY HYDRAULIC ATTACHMENTS FOR DEMOLITION MARKET, BY TYPE, 2023-2033 ($MILLION)
- TABLE 43. ITALY HYDRAULIC ATTACHMENTS FOR DEMOLITION MARKET, BY APPLICATION, 2023-2033 ($MILLION)
- TABLE 44. ITALY HYDRAULIC ATTACHMENTS FOR DEMOLITION MARKET, BY END-USER, 2023-2033 ($MILLION)
- TABLE 45. SPAIN HYDRAULIC ATTACHMENTS FOR DEMOLITION MARKET, BY TYPE, 2023-2033 ($MILLION)
- TABLE 46. SPAIN HYDRAULIC ATTACHMENTS FOR DEMOLITION MARKET, BY APPLICATION, 2023-2033 ($MILLION)
- TABLE 47. SPAIN HYDRAULIC ATTACHMENTS FOR DEMOLITION MARKET, BY END-USER, 2023-2033 ($MILLION)
- TABLE 48. REST OF EUROPE HYDRAULIC ATTACHMENTS FOR DEMOLITION MARKET, BY TYPE, 2023-2033 ($MILLION)
- TABLE 49. REST OF EUROPE HYDRAULIC ATTACHMENTS FOR DEMOLITION MARKET, BY APPLICATION, 2023-2033 ($MILLION)
- TABLE 50. REST OF EUROPE HYDRAULIC ATTACHMENTS FOR DEMOLITION MARKET, BY END-USER, 2023-2033 ($MILLION)
- TABLE 51. ASIA-PACIFIC HYDRAULIC ATTACHMENTS FOR DEMOLITION MARKET, BY TYPE, 2023-2033 ($MILLION)
- TABLE 52. ASIA-PACIFIC HYDRAULIC ATTACHMENTS FOR DEMOLITION MARKET, BY APPLICATION, 2023-2033 ($MILLION)
- TABLE 53. ASIA-PACIFIC HYDRAULIC ATTACHMENTS FOR DEMOLITION MARKET, BY END-USER, 2023-2033 ($MILLION)
- TABLE 54. ASIA-PACIFIC HYDRAULIC ATTACHMENTS FOR DEMOLITION MARKET, BY COUNTRY, 2023-2033 ($MILLION)
- TABLE 55. CHINA HYDRAULIC ATTACHMENTS FOR DEMOLITION MARKET, BY TYPE, 2023-2033 ($MILLION)
- TABLE 56. CHINA HYDRAULIC ATTACHMENTS FOR DEMOLITION MARKET, BY APPLICATION, 2023-2033 ($MILLION)
- TABLE 57. CHINA HYDRAULIC ATTACHMENTS FOR DEMOLITION MARKET, BY END-USER, 2023-2033 ($MILLION)
- TABLE 58. INDIA HYDRAULIC ATTACHMENTS FOR DEMOLITION MARKET, BY TYPE, 2023-2033 ($MILLION)
- TABLE 59. INDIA HYDRAULIC ATTACHMENTS FOR DEMOLITION MARKET, BY APPLICATION, 2023-2033 ($MILLION)
- TABLE 60. INDIA HYDRAULIC ATTACHMENTS FOR DEMOLITION MARKET, BY END-USER, 2023-2033 ($MILLION)
- TABLE 61. JAPAN HYDRAULIC ATTACHMENTS FOR DEMOLITION MARKET, BY TYPE, 2023-2033 ($MILLION)
- TABLE 62. JAPAN HYDRAULIC ATTACHMENTS FOR DEMOLITION MARKET, BY APPLICATION, 2023-2033 ($MILLION)
- TABLE 63. JAPAN HYDRAULIC ATTACHMENTS FOR DEMOLITION MARKET, BY END-USER, 2023-2033 ($MILLION)
- TABLE 64. SOUTH KOREA HYDRAULIC ATTACHMENTS FOR DEMOLITION MARKET, BY TYPE, 2023-2033 ($MILLION)
- TABLE 65. SOUTH KOREA HYDRAULIC ATTACHMENTS FOR DEMOLITION MARKET, BY APPLICATION, 2023-2033 ($MILLION)
- TABLE 66. SOUTH KOREA HYDRAULIC ATTACHMENTS FOR DEMOLITION MARKET, BY END-USER, 2023-2033 ($MILLION)
- TABLE 67. AUSTRALIA HYDRAULIC ATTACHMENTS FOR DEMOLITION MARKET, BY TYPE, 2023-2033 ($MILLION)
- TABLE 68. AUSTRALIA HYDRAULIC ATTACHMENTS FOR DEMOLITION MARKET, BY APPLICATION, 2023-2033 ($MILLION)
- TABLE 69. AUSTRALIA HYDRAULIC ATTACHMENTS FOR DEMOLITION MARKET, BY END-USER, 2023-2033 ($MILLION)
- TABLE 70. REST OF ASIA-PACIFIC HYDRAULIC ATTACHMENTS FOR DEMOLITION MARKET, BY TYPE, 2023-2033 ($MILLION)
- TABLE 71. REST OF ASIA-PACIFIC HYDRAULIC ATTACHMENTS FOR DEMOLITION MARKET, BY APPLICATION, 2023-2033 ($MILLION)
- TABLE 72. REST OF ASIA-PACIFIC HYDRAULIC ATTACHMENTS FOR DEMOLITION MARKET, BY END-USER, 2023-2033 ($MILLION)
- TABLE 73. LAMEA HYDRAULIC ATTACHMENTS FOR DEMOLITION MARKET, BY TYPE, 2023-2033 ($MILLION)
- TABLE 74. LAMEA HYDRAULIC ATTACHMENTS FOR DEMOLITION MARKET, BY APPLICATION, 2023-2033 ($MILLION)
- TABLE 75. LAMEA HYDRAULIC ATTACHMENTS FOR DEMOLITION MARKET, BY END-USER, 2023-2033 ($MILLION)
- TABLE 76. LAMEA HYDRAULIC ATTACHMENTS FOR DEMOLITION MARKET, BY COUNTRY, 2023-2033 ($MILLION)
- TABLE 77. LATIN AMERICA HYDRAULIC ATTACHMENTS FOR DEMOLITION MARKET, BY TYPE, 2023-2033 ($MILLION)
- TABLE 78. LATIN AMERICA HYDRAULIC ATTACHMENTS FOR DEMOLITION MARKET, BY APPLICATION, 2023-2033 ($MILLION)
- TABLE 79. LATIN AMERICA HYDRAULIC ATTACHMENTS FOR DEMOLITION MARKET, BY END-USER, 2023-2033 ($MILLION)
- TABLE 80. MIDDLE EAST HYDRAULIC ATTACHMENTS FOR DEMOLITION MARKET, BY TYPE, 2023-2033 ($MILLION)
- TABLE 81. MIDDLE EAST HYDRAULIC ATTACHMENTS FOR DEMOLITION MARKET, BY APPLICATION, 2023-2033 ($MILLION)
- TABLE 82. MIDDLE EAST HYDRAULIC ATTACHMENTS FOR DEMOLITION MARKET, BY END-USER, 2023-2033 ($MILLION)
- TABLE 83. AFRICA HYDRAULIC ATTACHMENTS FOR DEMOLITION MARKET, BY TYPE, 2023-2033 ($MILLION)
- TABLE 84. AFRICA HYDRAULIC ATTACHMENTS FOR DEMOLITION MARKET, BY APPLICATION, 2023-2033 ($MILLION)
- TABLE 85. AFRICA HYDRAULIC ATTACHMENTS FOR DEMOLITION MARKET, BY END-USER, 2023-2033 ($MILLION)
- TABLE 86. SANDVIK AB: KEY EXECUTIVES
- TABLE 87. SANDVIK AB: COMPANY SNAPSHOT
- TABLE 88. SANDVIK AB: PRODUCT SEGMENTS
- TABLE 89. SANDVIK AB: PRODUCT PORTFOLIO
- TABLE 90. SANDVIK AB: KEY STRATERGIES
- TABLE 91. CATERPILLAR: KEY EXECUTIVES
- TABLE 92. CATERPILLAR: COMPANY SNAPSHOT
- TABLE 93. CATERPILLAR: PRODUCT SEGMENTS
- TABLE 94. CATERPILLAR: PRODUCT PORTFOLIO
- TABLE 95. CATERPILLAR: KEY STRATERGIES
- TABLE 96. ATLAS COPCO AB: KEY EXECUTIVES
- TABLE 97. ATLAS COPCO AB: COMPANY SNAPSHOT
- TABLE 98. ATLAS COPCO AB: PRODUCT SEGMENTS
- TABLE 99. ATLAS COPCO AB: PRODUCT PORTFOLIO
- TABLE 100. EPIROC AB: KEY EXECUTIVES
- TABLE 101. EPIROC AB: COMPANY SNAPSHOT
- TABLE 102. EPIROC AB: PRODUCT SEGMENTS
- TABLE 103. EPIROC AB: PRODUCT PORTFOLIO
- TABLE 104. EPIROC AB: KEY STRATERGIES
- TABLE 105. SOOSAN HEAVY INDUSTRIES CO., LTD.: KEY EXECUTIVES
- TABLE 106. SOOSAN HEAVY INDUSTRIES CO., LTD.: COMPANY SNAPSHOT
- TABLE 107. SOOSAN HEAVY INDUSTRIES CO., LTD.: PRODUCT SEGMENTS
- TABLE 108. SOOSAN HEAVY INDUSTRIES CO., LTD.: PRODUCT PORTFOLIO
- TABLE 109. OKADA: KEY EXECUTIVES
- TABLE 110. OKADA: COMPANY SNAPSHOT
- TABLE 111. OKADA: PRODUCT SEGMENTS
- TABLE 112. OKADA: PRODUCT PORTFOLIO
- TABLE 113. OKADA: KEY STRATERGIES
- TABLE 114. MONTABERT SAS: KEY EXECUTIVES
- TABLE 115. MONTABERT SAS: COMPANY SNAPSHOT
- TABLE 116. MONTABERT SAS: SERVICE SEGMENTS
- TABLE 117. MONTABERT SAS: PRODUCT PORTFOLIO
- TABLE 118. MONTABERT SAS: KEY STRATERGIES
- TABLE 119. GENESIS ATTACHMENTS: KEY EXECUTIVES
- TABLE 120. GENESIS ATTACHMENTS: COMPANY SNAPSHOT
- TABLE 121. GENESIS ATTACHMENTS: PRODUCT SEGMENTS
- TABLE 122. GENESIS ATTACHMENTS: PRODUCT PORTFOLIO
- TABLE 123. GENESIS ATTACHMENTS: KEY STRATERGIES
- TABLE 124. INDECO: KEY EXECUTIVES
- TABLE 125. INDECO: COMPANY SNAPSHOT
- TABLE 126. INDECO: PRODUCT SEGMENTS
- TABLE 127. INDECO: PRODUCT PORTFOLIO
- TABLE 128. XCENTRIC: KEY EXECUTIVES
- TABLE 129. XCENTRIC: COMPANY SNAPSHOT
- TABLE 130. XCENTRIC: PRODUCT SEGMENTS
- TABLE 131. XCENTRIC: PRODUCT PORTFOLIO
- TABLE 132. XCENTRIC: KEY STRATERGIES
LIST OF FIGURES
- FIGURE 01. HYDRAULIC ATTACHMENTS FOR DEMOLITION MARKET, 2023-2033
- FIGURE 02. SEGMENTATION OF HYDRAULIC ATTACHMENTS FOR DEMOLITION MARKET,2023-2033
- FIGURE 03. TOP IMPACTING FACTORS IN HYDRAULIC ATTACHMENTS FOR DEMOLITION MARKET (2023 TO 2033)
- FIGURE 04. TOP INVESTMENT POCKETS IN HYDRAULIC ATTACHMENTS FOR DEMOLITION MARKET (2024-2033)
- FIGURE 05. LOW BARGAINING POWER OF SUPPLIERS
- FIGURE 06. LOW THREAT OF NEW ENTRANTS
- FIGURE 07. LOW THREAT OF SUBSTITUTES
- FIGURE 08. LOW INTENSITY OF RIVALRY
- FIGURE 09. LOW BARGAINING POWER OF BUYERS
- FIGURE 10. GLOBAL HYDRAULIC ATTACHMENTS FOR DEMOLITION MARKET:DRIVERS, RESTRAINTS AND OPPORTUNITIES
- FIGURE 11. HYDRAULIC ATTACHMENTS FOR DEMOLITION MARKET, BY TYPE, 2023 AND 2033(%)
- FIGURE 12. COMPARATIVE SHARE ANALYSIS OF HYDRAULIC ATTACHMENTS FOR DEMOLITION MARKET FOR BREAKER/HAMMER, BY COUNTRY 2023 AND 2033(%)
- FIGURE 13. COMPARATIVE SHARE ANALYSIS OF HYDRAULIC ATTACHMENTS FOR DEMOLITION MARKET FOR CRUSHER/SHEAR, BY COUNTRY 2023 AND 2033(%)
- FIGURE 14. COMPARATIVE SHARE ANALYSIS OF HYDRAULIC ATTACHMENTS FOR DEMOLITION MARKET FOR PULVERIZER, BY COUNTRY 2023 AND 2033(%)
- FIGURE 15. COMPARATIVE SHARE ANALYSIS OF HYDRAULIC ATTACHMENTS FOR DEMOLITION MARKET FOR GRAPPLE, BY COUNTRY 2023 AND 2033(%)
- FIGURE 16. COMPARATIVE SHARE ANALYSIS OF HYDRAULIC ATTACHMENTS FOR DEMOLITION MARKET FOR OTHERS, BY COUNTRY 2023 AND 2033(%)
- FIGURE 17. HYDRAULIC ATTACHMENTS FOR DEMOLITION MARKET, BY APPLICATION, 2023 AND 2033(%)
- FIGURE 18. COMPARATIVE SHARE ANALYSIS OF HYDRAULIC ATTACHMENTS FOR DEMOLITION MARKET FOR MINING AND EXCAVATION, BY COUNTRY 2023 AND 2033(%)
- FIGURE 19. COMPARATIVE SHARE ANALYSIS OF HYDRAULIC ATTACHMENTS FOR DEMOLITION MARKET FOR EARTH MOVING AND DEMOLITION, BY COUNTRY 2023 AND 2033(%)
- FIGURE 20. HYDRAULIC ATTACHMENTS FOR DEMOLITION MARKET, BY END-USER, 2023 AND 2033(%)
- FIGURE 21. COMPARATIVE SHARE ANALYSIS OF HYDRAULIC ATTACHMENTS FOR DEMOLITION MARKET FOR CONSTRUCTION, BY COUNTRY 2023 AND 2033(%)
- FIGURE 22. COMPARATIVE SHARE ANALYSIS OF HYDRAULIC ATTACHMENTS FOR DEMOLITION MARKET FOR MINING, BY COUNTRY 2023 AND 2033(%)
- FIGURE 23. COMPARATIVE SHARE ANALYSIS OF HYDRAULIC ATTACHMENTS FOR DEMOLITION MARKET FOR WASTE MANAGEMENT AND RECYCLING, BY COUNTRY 2023 AND 2033(%)
- FIGURE 24. COMPARATIVE SHARE ANALYSIS OF HYDRAULIC ATTACHMENTS FOR DEMOLITION MARKET FOR UTILITY, BY COUNTRY 2023 AND 2033(%)
- FIGURE 25. HYDRAULIC ATTACHMENTS FOR DEMOLITION MARKET BY REGION, 2023 AND 2033(%)
- FIGURE 26. U.S. HYDRAULIC ATTACHMENTS FOR DEMOLITION MARKET, 2023-2033 ($MILLION)
- FIGURE 27. CANADA HYDRAULIC ATTACHMENTS FOR DEMOLITION MARKET, 2023-2033 ($MILLION)
- FIGURE 28. MEXICO HYDRAULIC ATTACHMENTS FOR DEMOLITION MARKET, 2023-2033 ($MILLION)
- FIGURE 29. GERMANY HYDRAULIC ATTACHMENTS FOR DEMOLITION MARKET, 2023-2033 ($MILLION)
- FIGURE 30. FRANCE HYDRAULIC ATTACHMENTS FOR DEMOLITION MARKET, 2023-2033 ($MILLION)
- FIGURE 31. UK HYDRAULIC ATTACHMENTS FOR DEMOLITION MARKET, 2023-2033 ($MILLION)
- FIGURE 32. ITALY HYDRAULIC ATTACHMENTS FOR DEMOLITION MARKET, 2023-2033 ($MILLION)
- FIGURE 33. SPAIN HYDRAULIC ATTACHMENTS FOR DEMOLITION MARKET, 2023-2033 ($MILLION)
- FIGURE 34. REST OF EUROPE HYDRAULIC ATTACHMENTS FOR DEMOLITION MARKET, 2023-2033 ($MILLION)
- FIGURE 35. CHINA HYDRAULIC ATTACHMENTS FOR DEMOLITION MARKET, 2023-2033 ($MILLION)
- FIGURE 36. INDIA HYDRAULIC ATTACHMENTS FOR DEMOLITION MARKET, 2023-2033 ($MILLION)
- FIGURE 37. JAPAN HYDRAULIC ATTACHMENTS FOR DEMOLITION MARKET, 2023-2033 ($MILLION)
- FIGURE 38. SOUTH KOREA HYDRAULIC ATTACHMENTS FOR DEMOLITION MARKET, 2023-2033 ($MILLION)
- FIGURE 39. AUSTRALIA HYDRAULIC ATTACHMENTS FOR DEMOLITION MARKET, 2023-2033 ($MILLION)
- FIGURE 40. REST OF ASIA-PACIFIC HYDRAULIC ATTACHMENTS FOR DEMOLITION MARKET, 2023-2033 ($MILLION)
- FIGURE 41. LATIN AMERICA HYDRAULIC ATTACHMENTS FOR DEMOLITION MARKET, 2023-2033 ($MILLION)
- FIGURE 42. MIDDLE EAST HYDRAULIC ATTACHMENTS FOR DEMOLITION MARKET, 2023-2033 ($MILLION)
- FIGURE 43. AFRICA HYDRAULIC ATTACHMENTS FOR DEMOLITION MARKET, 2023-2033 ($MILLION)
- FIGURE 44. TOP WINNING STRATEGIES, BY YEAR (2020-2023)
- FIGURE 45. TOP WINNING STRATEGIES, BY DEVELOPMENT (2020-2023)
- FIGURE 46. TOP WINNING STRATEGIES, BY COMPANY (2020-2023)
- FIGURE 47. PRODUCT MAPPING OF TOP 10 PLAYERS
- FIGURE 48. COMPETITIVE DASHBOARD
- FIGURE 49. COMPETITIVE HEATMAP: HYDRAULIC ATTACHMENTS FOR DEMOLITION MARKET
- FIGURE 50. TOP PLAYER POSITIONING, 2023
- FIGURE 51. SANDVIK AB: NET SALES, 2020-2022 ($MILLION)
- FIGURE 52. SANDVIK AB: REVENUE SHARE BY SEGMENT, 2022 (%)
- FIGURE 53. SANDVIK AB: REVENUE SHARE BY REGION, 2022 (%)
- FIGURE 54. CATERPILLAR: NET SALES, 2020-2022 ($MILLION)
- FIGURE 55. CATERPILLAR: RESEARCH & DEVELOPMENT EXPENDITURE, 2020-2022 ($MILLION)
- FIGURE 56. CATERPILLAR: REVENUE SHARE BY SEGMENT, 2022 (%)
- FIGURE 57. CATERPILLAR: REVENUE SHARE BY REGION, 2022 (%)
- FIGURE 58. ATLAS COPCO AB: NET SALES, 2020-2022 ($MILLION)
- FIGURE 59. ATLAS COPCO AB: RESEARCH & DEVELOPMENT EXPENDITURE, 2020-2022 ($MILLION)
- FIGURE 60. ATLAS COPCO AB: REVENUE SHARE BY SEGMENT, 2022 (%)
- FIGURE 61. ATLAS COPCO AB: REVENUE SHARE BY REGION, 2022 (%)
- FIGURE 62. EPIROC AB: NET SALES, 2020-2022 ($MILLION)
- FIGURE 63. EPIROC AB: RESEARCH & DEVELOPMENT EXPENDITURE, 2020-2022
- FIGURE 64. EPIROC AB: REVENUE SHARE BY SEGMENT, 2021 (%)
- FIGURE 65. EPIROC AB: REVENUE SHARE BY REGION, 2021 (%)
- FIGURE 66. OKADA: NET SALES, 2020-2022 ($MILLION)
- FIGURE 67. OKADA: REVENUE SHARE BY REGION, 2022 (%)
- FIGURE 68. MONTABERT SAS: NET SALES, 2020-2022 ($MILLION)
- FIGURE 69. MONTABERT SAS: REVENUE SHARE BY SEGMENT, 2022 (%)
The global hydraulic attachments for demolition market were valued at $4,136.7 million in 2023, and is projected to reach $7,133.1 million by 2033, registering a CAGR of 5.6% from 2024 to 2033.
Hydraulic attachments for demolishing are uniquely designed tools that improve the efficiency and precision of building site deconstruction activities. This broad category includes grapples for flexible material handling; breaker/hammer attachments for breaking down rock and concrete surfaces; crusher/shear attachments for processing and recycling building materials; pulverizer for crushing and grinding debris; and other attachments like thumbs, rippers, and crunchers that provide extra functions, including tearing, compacting, and precise handling. These hydraulic attachments are essential for streamlining the demolition process as they are flexible and versatile enough to handle every challenge involved in demolishing buildings for infrastructure and construction projects.
Some significant factors that impact the growth of the global hydraulic attachments for demolition market include increase in construction and infrastructure activities in developed nations. Furthermore, development of the mining sector and increase in demand for coal, metal, and minerals are accelerating the hydraulic attachments for demolition market growth. However, lack of skilled & qualified operators and decrease in new construction activity are the factors anticipated to hinder the growth of the market. On the contrary, rise in demand for technologically advanced equipment in the mining sector is expected to provide future growth opportunities in the market.
Construction companies that focus on cutting down costs can highly benefit from hydraulic attachments for demolitions. Since hydraulic attachments for demolitions require grease and oil to maintain, the internal components are kept lubricated, which reduces the amount of upkeep. The longer the demolition tool lasts, the less money will be spent on equipment. Hence, key players are manufacturing advanced and cost-effective hydraulic attachments for demolition for mining and construction sectors.
For instance, in November 2023, SANY Group introduced five brand-new small excavator models with enhanced features and performance, scheduled for official release in 2024. Tailored for the European and North American markets, the SY60C, SY75C, SY80U, SY95C, and SY135C have been produced at SANY's industry park in Kunshan, Jiangsu Province. This marks a significant achievement in SANY's global product strategy for overseas markets. Launch of new models are expected to create demand for hydraulic attachments. These instances, in turn, is expected to drive the growth of the market.
Population growth in the developing countries-such as China, India-and the U.S. is expected to bring about rapid urbanization, boost the development of the housing sector, and foster the demand for hydraulic attachments. According to the United Nations (UN), about 68% of the world's population is expected to live in urban areas by 2050. This is expected to increase construction activities for housing, infrastructure, and non-residential construction worldwide. Thus, all these factors collectively drive the growth of the hydraulic attachments for demolition market.
Key Benefits For Stakeholders
- This report provides a quantitative analysis of the market segments, current trends, estimations, and dynamics of the hydraulic attachments for demolition market analysis from 2023 to 2033 to identify the prevailing hydraulic attachments for demolition market opportunities.
- The market research is offered along with information related to key drivers, restraints, and opportunities.
- Porter's five forces analysis highlights the potency of buyers and suppliers to enable stakeholders make profit-oriented business decisions and strengthen their supplier-buyer network.
- In-depth analysis of the hydraulic attachments for demolition market segmentation assists to determine the prevailing market opportunities.
- Major countries in each region are mapped according to their revenue contribution to the global market.
- Market player positioning facilitates benchmarking and provides a clear understanding of the present position of the market players.
- The report includes the analysis of the regional as well as global hydraulic attachments for demolition market trends, key players, market segments, application areas, and market growth strategies.
Additional benefits you will get with this purchase are:
- Quarterly Update and* (only available with a corporate license, on listed price)
- 5 additional Company Profile of client Choice pre- or Post-purchase, as a free update.
- Free Upcoming Version on the Purchase of Five and Enterprise User License.
- 16 analyst hours of support* (post-purchase, if you find additional data requirements upon review of the report, you may receive support amounting to 16 analyst hours to solve questions, and post-sale queries)
- 15% Free Customization* (in case the scope or segment of the report does not match your requirements, 15% is equivalent to 3 working days of free work, applicable once)
- Free data Pack on the Five and Enterprise User License. (Excel version of the report)
- Free Updated report if the report is 6-12 months old or older.
- 24-hour priority response*
- Free Industry updates and white papers.
Possible Customization with this report (with additional cost and timeline, please talk to the sales executive to know more)
- Investment Opportunities
- New Product Development/ Product Matrix of Key Players
- Additional company profiles with specific to client's interest
- Additional country or region analysis- market size and forecast
- Expanded list for Company Profiles
Key Market Segments
By Type
- Breaker/Hammer
- Crusher/Shear
- Pulverizer
- Grapple
- Others
By Application
- Mining and Excavation
- Earth Moving and Demolition
By End-User
- Construction
- Mining
- Waste management and Recycling
- Utility
By Region
- North America
- U.S.
- Canada
- Mexico
- Europe
- Germany
- France
- UK
- Italy
- Spain
- Rest of Europe
- Asia-Pacific
- China
- India
- Japan
- South Korea
- Australia
- Rest of Asia-Pacific
- LAMEA
- Latin America
- Middle East
- Africa
Key Market Players:
- Caterpillar
- Atlas Copco AB
- Epiroc AB
- Montabert SAS
- Sandvik AB
- Genesis Attachments
- Soosan Heavy Industries Co., Ltd.
- OKADA
- Indeco
- Xcentric
TABLE OF CONTENTS
CHAPTER 1: INTRODUCTION
- 1.1. Report description
- 1.2. Key market segments
- 1.3. Key benefits to the stakeholders
- 1.4. Research methodology
- 1.4.1. Primary research
- 1.4.2. Secondary research
- 1.4.3. Analyst tools and models
CHAPTER 2: EXECUTIVE SUMMARY
- 2.1. CXO Perspective
CHAPTER 3: MARKET OVERVIEW
- 3.1. Market definition and scope
- 3.2. Key findings
- 3.2.1. Top impacting factors
- 3.2.2. Top investment pockets
- 3.3. Porter's five forces analysis
- 3.3.1. Low bargaining power of suppliers
- 3.3.2. Low threat of new entrants
- 3.3.3. Low threat of substitutes
- 3.3.4. Low intensity of rivalry
- 3.3.5. Low bargaining power of buyers
- 3.4. Market dynamics
- 3.4.1. Drivers
- 3.4.1.1. Increase in demand for coal, metal, and mineral mine
- 3.4.1.2. Rapid urbanization & industrialization
- 3.4.1.3. Surge in residential & nonresidential construction activities
- 3.4.2. Restraints
- 3.4.2.1. Lack of skilled and qualified operators
- 3.4.2.2. High initial costs and equipment investment
- 3.4.3. Opportunities
- 3.4.3.1. Rise in demand for technologically advanced equipment in the mining sector
- 3.4.3.2. Government investments in the building infrastructure sector
- 3.4.1. Drivers
CHAPTER 4: HYDRAULIC ATTACHMENTS FOR DEMOLITION MARKET, BY TYPE
- 4.1. Overview
- 4.1.1. Market size and forecast
- 4.2. Breaker/Hammer
- 4.2.1. Key market trends, growth factors and opportunities
- 4.2.2. Market size and forecast, by region
- 4.2.3. Market share analysis by country
- 4.3. Crusher/Shear
- 4.3.1. Key market trends, growth factors and opportunities
- 4.3.2. Market size and forecast, by region
- 4.3.3. Market share analysis by country
- 4.4. Pulverizer
- 4.4.1. Key market trends, growth factors and opportunities
- 4.4.2. Market size and forecast, by region
- 4.4.3. Market share analysis by country
- 4.5. Grapple
- 4.5.1. Key market trends, growth factors and opportunities
- 4.5.2. Market size and forecast, by region
- 4.5.3. Market share analysis by country
- 4.6. Others
- 4.6.1. Key market trends, growth factors and opportunities
- 4.6.2. Market size and forecast, by region
- 4.6.3. Market share analysis by country
CHAPTER 5: HYDRAULIC ATTACHMENTS FOR DEMOLITION MARKET, BY APPLICATION
- 5.1. Overview
- 5.1.1. Market size and forecast
- 5.2. Mining and Excavation
- 5.2.1. Key market trends, growth factors and opportunities
- 5.2.2. Market size and forecast, by region
- 5.2.3. Market share analysis by country
- 5.3. Earth Moving and Demolition
- 5.3.1. Key market trends, growth factors and opportunities
- 5.3.2. Market size and forecast, by region
- 5.3.3. Market share analysis by country
CHAPTER 6: HYDRAULIC ATTACHMENTS FOR DEMOLITION MARKET, BY END-USER
- 6.1. Overview
- 6.1.1. Market size and forecast
- 6.2. Construction
- 6.2.1. Key market trends, growth factors and opportunities
- 6.2.2. Market size and forecast, by region
- 6.2.3. Market share analysis by country
- 6.3. Mining
- 6.3.1. Key market trends, growth factors and opportunities
- 6.3.2. Market size and forecast, by region
- 6.3.3. Market share analysis by country
- 6.4. Waste management and Recycling
- 6.4.1. Key market trends, growth factors and opportunities
- 6.4.2. Market size and forecast, by region
- 6.4.3. Market share analysis by country
- 6.5. Utility
- 6.5.1. Key market trends, growth factors and opportunities
- 6.5.2. Market size and forecast, by region
- 6.5.3. Market share analysis by country
CHAPTER 7: HYDRAULIC ATTACHMENTS FOR DEMOLITION MARKET, BY REGION
- 7.1. Overview
- 7.1.1. Market size and forecast By Region
- 7.2. North America
- 7.2.1. Key market trends, growth factors and opportunities
- 7.2.2. Market size and forecast, by Type
- 7.2.3. Market size and forecast, by Application
- 7.2.4. Market size and forecast, by End-User
- 7.2.5. Market size and forecast, by country
- 7.2.5.1. U.S.
- 7.2.5.1.1. Market size and forecast, by Type
- 7.2.5.1.2. Market size and forecast, by Application
- 7.2.5.1.3. Market size and forecast, by End-User
- 7.2.5.2. Canada
- 7.2.5.2.1. Market size and forecast, by Type
- 7.2.5.2.2. Market size and forecast, by Application
- 7.2.5.2.3. Market size and forecast, by End-User
- 7.2.5.3. Mexico
- 7.2.5.3.1. Market size and forecast, by Type
- 7.2.5.3.2. Market size and forecast, by Application
- 7.2.5.3.3. Market size and forecast, by End-User
- 7.3. Europe
- 7.3.1. Key market trends, growth factors and opportunities
- 7.3.2. Market size and forecast, by Type
- 7.3.3. Market size and forecast, by Application
- 7.3.4. Market size and forecast, by End-User
- 7.3.5. Market size and forecast, by country
- 7.3.5.1. Germany
- 7.3.5.1.1. Market size and forecast, by Type
- 7.3.5.1.2. Market size and forecast, by Application
- 7.3.5.1.3. Market size and forecast, by End-User
- 7.3.5.2. France
- 7.3.5.2.1. Market size and forecast, by Type
- 7.3.5.2.2. Market size and forecast, by Application
- 7.3.5.2.3. Market size and forecast, by End-User
- 7.3.5.3. UK
- 7.3.5.3.1. Market size and forecast, by Type
- 7.3.5.3.2. Market size and forecast, by Application
- 7.3.5.3.3. Market size and forecast, by End-User
- 7.3.5.4. Italy
- 7.3.5.4.1. Market size and forecast, by Type
- 7.3.5.4.2. Market size and forecast, by Application
- 7.3.5.4.3. Market size and forecast, by End-User
- 7.3.5.5. Spain
- 7.3.5.5.1. Market size and forecast, by Type
- 7.3.5.5.2. Market size and forecast, by Application
- 7.3.5.5.3. Market size and forecast, by End-User
- 7.3.5.6. Rest of Europe
- 7.3.5.6.1. Market size and forecast, by Type
- 7.3.5.6.2. Market size and forecast, by Application
- 7.3.5.6.3. Market size and forecast, by End-User
- 7.4. Asia-Pacific
- 7.4.1. Key market trends, growth factors and opportunities
- 7.4.2. Market size and forecast, by Type
- 7.4.3. Market size and forecast, by Application
- 7.4.4. Market size and forecast, by End-User
- 7.4.5. Market size and forecast, by country
- 7.4.5.1. China
- 7.4.5.1.1. Market size and forecast, by Type
- 7.4.5.1.2. Market size and forecast, by Application
- 7.4.5.1.3. Market size and forecast, by End-User
- 7.4.5.2. India
- 7.4.5.2.1. Market size and forecast, by Type
- 7.4.5.2.2. Market size and forecast, by Application
- 7.4.5.2.3. Market size and forecast, by End-User
- 7.4.5.3. Japan
- 7.4.5.3.1. Market size and forecast, by Type
- 7.4.5.3.2. Market size and forecast, by Application
- 7.4.5.3.3. Market size and forecast, by End-User
- 7.4.5.4. South Korea
- 7.4.5.4.1. Market size and forecast, by Type
- 7.4.5.4.2. Market size and forecast, by Application
- 7.4.5.4.3. Market size and forecast, by End-User
- 7.4.5.5. Australia
- 7.4.5.5.1. Market size and forecast, by Type
- 7.4.5.5.2. Market size and forecast, by Application
- 7.4.5.5.3. Market size and forecast, by End-User
- 7.4.5.6. Rest of Asia-Pacific
- 7.4.5.6.1. Market size and forecast, by Type
- 7.4.5.6.2. Market size and forecast, by Application
- 7.4.5.6.3. Market size and forecast, by End-User
- 7.5. LAMEA
- 7.5.1. Key market trends, growth factors and opportunities
- 7.5.2. Market size and forecast, by Type
- 7.5.3. Market size and forecast, by Application
- 7.5.4. Market size and forecast, by End-User
- 7.5.5. Market size and forecast, by country
- 7.5.5.1. Latin America
- 7.5.5.1.1. Market size and forecast, by Type
- 7.5.5.1.2. Market size and forecast, by Application
- 7.5.5.1.3. Market size and forecast, by End-User
- 7.5.5.2. Middle East
- 7.5.5.2.1. Market size and forecast, by Type
- 7.5.5.2.2. Market size and forecast, by Application
- 7.5.5.2.3. Market size and forecast, by End-User
- 7.5.5.3. Africa
- 7.5.5.3.1. Market size and forecast, by Type
- 7.5.5.3.2. Market size and forecast, by Application
- 7.5.5.3.3. Market size and forecast, by End-User
CHAPTER 8: COMPETITIVE LANDSCAPE
- 8.1. Introduction
- 8.2. Top winning strategies
- 8.3. Product mapping of top 10 player
- 8.4. Competitive dashboard
- 8.5. Competitive heatmap
- 8.6. Top player positioning, 2023
CHAPTER 9: COMPANY PROFILES
- 9.1. Sandvik AB
- 9.1.1. Company overview
- 9.1.2. Key executives
- 9.1.3. Company snapshot
- 9.1.4. Operating business segments
- 9.1.5. Product portfolio
- 9.1.6. Business performance
- 9.1.7. Key strategic moves and developments
- 9.2. Caterpillar
- 9.2.1. Company overview
- 9.2.2. Key executives
- 9.2.3. Company snapshot
- 9.2.4. Operating business segments
- 9.2.5. Product portfolio
- 9.2.6. Business performance
- 9.2.7. Key strategic moves and developments
- 9.3. Atlas Copco AB
- 9.3.1. Company overview
- 9.3.2. Key executives
- 9.3.3. Company snapshot
- 9.3.4. Operating business segments
- 9.3.5. Product portfolio
- 9.3.6. Business performance
- 9.4. Epiroc AB
- 9.4.1. Company overview
- 9.4.2. Key executives
- 9.4.3. Company snapshot
- 9.4.4. Operating business segments
- 9.4.5. Product portfolio
- 9.4.6. Business performance
- 9.4.7. Key strategic moves and developments
- 9.5. Soosan Heavy Industries Co., Ltd.
- 9.5.1. Company overview
- 9.5.2. Key executives
- 9.5.3. Company snapshot
- 9.5.4. Operating business segments
- 9.5.5. Product portfolio
- 9.6. OKADA
- 9.6.1. Company overview
- 9.6.2. Key executives
- 9.6.3. Company snapshot
- 9.6.4. Operating business segments
- 9.6.5. Product portfolio
- 9.6.6. Business performance
- 9.6.7. Key strategic moves and developments
- 9.7. Montabert SAS
- 9.7.1. Company overview
- 9.7.2. Key executives
- 9.7.3. Company snapshot
- 9.7.4. Operating business segments
- 9.7.5. Product portfolio
- 9.7.6. Business performance
- 9.7.7. Key strategic moves and developments
- 9.8. Genesis Attachments
- 9.8.1. Company overview
- 9.8.2. Key executives
- 9.8.3. Company snapshot
- 9.8.4. Operating business segments
- 9.8.5. Product portfolio
- 9.8.6. Key strategic moves and developments
- 9.9. Indeco
- 9.9.1. Company overview
- 9.9.2. Key executives
- 9.9.3. Company snapshot
- 9.9.4. Operating business segments
- 9.9.5. Product portfolio
- 9.10. Xcentric
- 9.10.1. Company overview
- 9.10.2. Key executives
- 9.10.3. Company snapshot
- 9.10.4. Operating business segments
- 9.10.5. Product portfolio
- 9.10.6. Key strategic moves and developments