
|
市場調査レポート
商品コード
1446933
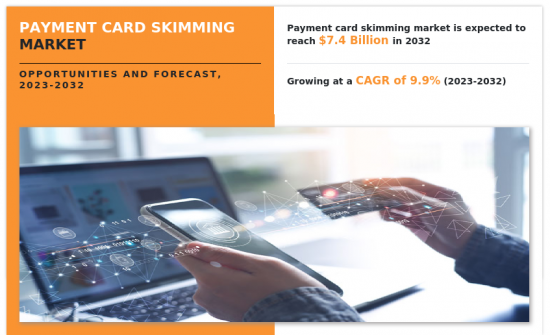
ペイメントカードスキミング市場:コンポーネント別、展開モード別、組織規模別、用途別:世界の機会分析と産業予測、2023年~2032年Payment Card Skimming Market By Component, By Deployment Mode, By Organization Size, By Application : Global Opportunity Analysis and Industry Forecast, 2023-2032 |
||||||
|
|||||||

| ペイメントカードスキミング市場:コンポーネント別、展開モード別、組織規模別、用途別:世界の機会分析と産業予測、2023年~2032年 |
|
出版日: 2024年02月01日
発行: Allied Market Research
ページ情報: 英文 268 Pages
納期: 2~3営業日
|

- 全表示
- 概要
- 図表
- 目次
ペイメントカードスキミングとは、クレジットカード、デビットカード、その他のペイメントカードの磁気ストライプから、カード所有者が知らないうちにデータを取得する違法な行為を指します。
スキミング装置は小型で目立たないことが多く、通常、ATM、ガソリンスタンド、POS端末などの正規のカード読み取り装置に設置されます。これらの装置は、カード番号、有効期限、時にはカード所有者の名前など、カードの磁気ストライプ情報を密かに記録するように設計されています。さらに、犯罪者は盗んだカード情報を使って偽造カードを作ったり、不正な取引を行ったりするため、カード所有者は金銭的な損失を被ることになります。スキミングは、ペイメントカード取引のセキュリティに重大な脅威をもたらすクレジットカード詐欺の一形態です。スキミングの被害に遭うリスクを最小限に抑えるため、個人はカードリーダーに異常な添付物がないか点検し、暗証番号を入力する際にはキーパッドを覆い、不正な取引がないか定期的に口座明細を監視することをお勧めします。また、企業や金融機関は、スキミング行為を検知・防止するため、さまざまなセキュリティ対策を採用しています。
電子決済手段への依存度の高まりとカードベースの取引の普及は、ペイメントカード・スキミング市場の成長に寄与しています。デジタル決済ソリューションを採用する個人や企業が増えるにつれて、決済システムの脆弱性を突こうとするサイバー犯罪者にとって、膨大な取引量が魅力的な標的となります。また、ATMやガソリンスタンドなど、広く利用されているプラットフォームにスキミング装置を導入することが比較的容易なため、詐欺師は広く網を張り、無防備な利用者から機密カード情報を取得することができます。しかし、厳しい規制や法的措置が市場の成長を妨げています。それとは逆に、チップベースのカードや非接触型決済への移行など、決済技術の絶え間ない進化は、取引のセキュリティを強化し、スキミングの影響を受けにくくする好機となっています。より安全な決済方法への移行は、犯罪者に適応を迫り、脆弱性を悪用する新たな方法を見つけさせ、セキュリティ技術の革新を促しています。さらに、包括的なサイバーセキュリティ・ソリューションに対する需要の高まりは、不正行為の検出、防止、回復を専門とする企業の市場を形成しています。効果的なセキュリティ対策を開発・導入できる企業は、ペイメントカードスキミングという永続的な脅威に対処するサービスやソリューションを提供し、この進化する情勢において利益を得る立場にあります。
世界のペイメントカードスキミング市場は、コンポーネント、導入形態、組織規模、用途、地域に区分されます。コンポーネントに基づいて、市場はソリューションとサービスに分類されます。展開に基づいて、市場はオンプレミスとクラウドに区分されます。組織規模ベースでは、市場は大企業と中小企業に区分されます。用途別では、個人情報の脅威、決済詐欺、マネーロンダリング、ATM、その他に区分されます。地域別では、ペイメントカードスキミング市場は北米、欧州、アジア太平洋、ラテンアメリカ、中東・アフリカに渡って調査されます。
利害関係者にとっての主なメリット
- 当調査は、ペイメントカードスキミング市場の詳細な推定・動向分析を提供し、現在の動向と将来予測を示し、差し迫った投資ポケットを説明します。
- 主要促進要因、阻害要因、機会、およびそれらがペイメントカードスキミング市場規模に与える影響分析に関する情報は、レポートで提供されます。
- ポーターのファイブフォース分析では、業界で活動するバイヤーとサプライヤーの潜在力を図解しています。
- 2022年から2032年までのペイメントカードスキミング市場の定量分析は、市場の可能性を決定するために提供されます。
本レポートのカスタマイズの可能性(追加費用とスケジュールが必要です。)
- 投資機会
- 製品/セグメント別企業の市場シェア分析
- 規制ガイドライン
- クライアントの関心に応じた企業プロファイルの追加
- 国別または地域別の追加分析-市場規模と予測
- 企業プロファイルの拡張リスト
- 世界/地域/国別企業シェア分析
目次
第1章 イントロダクション
第2章 エグゼクティブサマリー
第3章 市場概要
- 市場の定義と範囲
- 主な調査結果
- 影響要因
- 主な投資機会
- ポーターのファイブフォース分析
- 市場力学
- 促進要因
- 抑制要因
- 機会
第4章 ペイメントカードスキミング市場:コンポーネント別
- 概要
- ソリューション
- サービス
第5章 ペイメントカードスキミング市場:展開モード別
- 概要
- オンプレミス
- クラウド
第6章 ペイメントカードスキミング市場:組織規模別
- 概要
- 大企業
- 中小企業
第7章 ペイメントカードスキミング市場:用途別
- 概要
- 個人情報窃盗
- 決済詐欺
- マネーロンダリング
- ATM
- その他
第8章 ペイメントカードスキミング市場:地域別
- 概要
- 北米
- 米国
- カナダ
- 欧州
- 英国
- ドイツ
- フランス
- イタリア
- スペイン
- その他
- アジア太平洋
- 中国
- 日本
- インド
- オーストラリア
- 韓国
- その他
- ラテンアメリカ
- ブラジル
- アルゼンチン
- その他のラテンアメリカ
- 中東・アフリカ
- Gcc諸国
- 南アフリカ
- その他の中東・アフリカ
第9章 競合情勢
- イントロダクション
- 主要成功戦略
- 主要10社の製品マッピング
- 競合ダッシュボード
- 競合ヒートマップ
- 主要企業のポジショニング、2022年
第10章 企業プロファイル
- Matrix IFS
- Fiserv Inc.
- investedge, inc.
- Complianceforge
- Riskskill Inc.
- Sesame Software
- C2C Smartcompliance
- Quercia Software
- BWise
- Rivial Data Security
LIST OF TABLES
- TABLE 01. GLOBAL PAYMENT CARD SKIMMING MARKET, BY COMPONENT, 2022-2032 ($MILLION)
- TABLE 02. PAYMENT CARD SKIMMING MARKET FOR SOLUTION, BY REGION, 2022-2032 ($MILLION)
- TABLE 03. PAYMENT CARD SKIMMING MARKET FOR SERVICE, BY REGION, 2022-2032 ($MILLION)
- TABLE 04. GLOBAL PAYMENT CARD SKIMMING MARKET, BY DEPLOYMENT MODE, 2022-2032 ($MILLION)
- TABLE 05. PAYMENT CARD SKIMMING MARKET FOR ON-PREMISE, BY REGION, 2022-2032 ($MILLION)
- TABLE 06. PAYMENT CARD SKIMMING MARKET FOR CLOUD, BY REGION, 2022-2032 ($MILLION)
- TABLE 07. GLOBAL PAYMENT CARD SKIMMING MARKET, BY ORGANIZATION SIZE, 2022-2032 ($MILLION)
- TABLE 08. PAYMENT CARD SKIMMING MARKET FOR LARGE ENTERPRISE, BY REGION, 2022-2032 ($MILLION)
- TABLE 09. PAYMENT CARD SKIMMING MARKET FOR SMALL AND MEDIUM-SIZED ENTERPRISES, BY REGION, 2022-2032 ($MILLION)
- TABLE 10. GLOBAL PAYMENT CARD SKIMMING MARKET, BY APPLICATION, 2022-2032 ($MILLION)
- TABLE 11. PAYMENT CARD SKIMMING MARKET FOR IDENTITY THEFT, BY REGION, 2022-2032 ($MILLION)
- TABLE 12. PAYMENT CARD SKIMMING MARKET FOR PAYMENT FRAUD, BY REGION, 2022-2032 ($MILLION)
- TABLE 13. PAYMENT CARD SKIMMING MARKET FOR MONEY LAUNDERING, BY REGION, 2022-2032 ($MILLION)
- TABLE 14. PAYMENT CARD SKIMMING MARKET FOR ATMS, BY REGION, 2022-2032 ($MILLION)
- TABLE 15. PAYMENT CARD SKIMMING MARKET FOR OTHERS, BY REGION, 2022-2032 ($MILLION)
- TABLE 16. PAYMENT CARD SKIMMING MARKET, BY REGION, 2022-2032 ($MILLION)
- TABLE 17. NORTH AMERICA PAYMENT CARD SKIMMING MARKET, BY COMPONENT, 2022-2032 ($MILLION)
- TABLE 18. NORTH AMERICA PAYMENT CARD SKIMMING MARKET, BY DEPLOYMENT MODE, 2022-2032 ($MILLION)
- TABLE 19. NORTH AMERICA PAYMENT CARD SKIMMING MARKET, BY ORGANIZATION SIZE, 2022-2032 ($MILLION)
- TABLE 20. NORTH AMERICA PAYMENT CARD SKIMMING MARKET, BY APPLICATION, 2022-2032 ($MILLION)
- TABLE 21. NORTH AMERICA PAYMENT CARD SKIMMING MARKET, BY COUNTRY, 2022-2032 ($MILLION)
- TABLE 22. U.S. PAYMENT CARD SKIMMING MARKET, BY COMPONENT, 2022-2032 ($MILLION)
- TABLE 23. U.S. PAYMENT CARD SKIMMING MARKET, BY DEPLOYMENT MODE, 2022-2032 ($MILLION)
- TABLE 24. U.S. PAYMENT CARD SKIMMING MARKET, BY ORGANIZATION SIZE, 2022-2032 ($MILLION)
- TABLE 25. U.S. PAYMENT CARD SKIMMING MARKET, BY APPLICATION, 2022-2032 ($MILLION)
- TABLE 26. CANADA PAYMENT CARD SKIMMING MARKET, BY COMPONENT, 2022-2032 ($MILLION)
- TABLE 27. CANADA PAYMENT CARD SKIMMING MARKET, BY DEPLOYMENT MODE, 2022-2032 ($MILLION)
- TABLE 28. CANADA PAYMENT CARD SKIMMING MARKET, BY ORGANIZATION SIZE, 2022-2032 ($MILLION)
- TABLE 29. CANADA PAYMENT CARD SKIMMING MARKET, BY APPLICATION, 2022-2032 ($MILLION)
- TABLE 30. EUROPE PAYMENT CARD SKIMMING MARKET, BY COMPONENT, 2022-2032 ($MILLION)
- TABLE 31. EUROPE PAYMENT CARD SKIMMING MARKET, BY DEPLOYMENT MODE, 2022-2032 ($MILLION)
- TABLE 32. EUROPE PAYMENT CARD SKIMMING MARKET, BY ORGANIZATION SIZE, 2022-2032 ($MILLION)
- TABLE 33. EUROPE PAYMENT CARD SKIMMING MARKET, BY APPLICATION, 2022-2032 ($MILLION)
- TABLE 34. EUROPE PAYMENT CARD SKIMMING MARKET, BY COUNTRY, 2022-2032 ($MILLION)
- TABLE 35. UK PAYMENT CARD SKIMMING MARKET, BY COMPONENT, 2022-2032 ($MILLION)
- TABLE 36. UK PAYMENT CARD SKIMMING MARKET, BY DEPLOYMENT MODE, 2022-2032 ($MILLION)
- TABLE 37. UK PAYMENT CARD SKIMMING MARKET, BY ORGANIZATION SIZE, 2022-2032 ($MILLION)
- TABLE 38. UK PAYMENT CARD SKIMMING MARKET, BY APPLICATION, 2022-2032 ($MILLION)
- TABLE 39. GERMANY PAYMENT CARD SKIMMING MARKET, BY COMPONENT, 2022-2032 ($MILLION)
- TABLE 40. GERMANY PAYMENT CARD SKIMMING MARKET, BY DEPLOYMENT MODE, 2022-2032 ($MILLION)
- TABLE 41. GERMANY PAYMENT CARD SKIMMING MARKET, BY ORGANIZATION SIZE, 2022-2032 ($MILLION)
- TABLE 42. GERMANY PAYMENT CARD SKIMMING MARKET, BY APPLICATION, 2022-2032 ($MILLION)
- TABLE 43. FRANCE PAYMENT CARD SKIMMING MARKET, BY COMPONENT, 2022-2032 ($MILLION)
- TABLE 44. FRANCE PAYMENT CARD SKIMMING MARKET, BY DEPLOYMENT MODE, 2022-2032 ($MILLION)
- TABLE 45. FRANCE PAYMENT CARD SKIMMING MARKET, BY ORGANIZATION SIZE, 2022-2032 ($MILLION)
- TABLE 46. FRANCE PAYMENT CARD SKIMMING MARKET, BY APPLICATION, 2022-2032 ($MILLION)
- TABLE 47. ITALY PAYMENT CARD SKIMMING MARKET, BY COMPONENT, 2022-2032 ($MILLION)
- TABLE 48. ITALY PAYMENT CARD SKIMMING MARKET, BY DEPLOYMENT MODE, 2022-2032 ($MILLION)
- TABLE 49. ITALY PAYMENT CARD SKIMMING MARKET, BY ORGANIZATION SIZE, 2022-2032 ($MILLION)
- TABLE 50. ITALY PAYMENT CARD SKIMMING MARKET, BY APPLICATION, 2022-2032 ($MILLION)
- TABLE 51. SPAIN PAYMENT CARD SKIMMING MARKET, BY COMPONENT, 2022-2032 ($MILLION)
- TABLE 52. SPAIN PAYMENT CARD SKIMMING MARKET, BY DEPLOYMENT MODE, 2022-2032 ($MILLION)
- TABLE 53. SPAIN PAYMENT CARD SKIMMING MARKET, BY ORGANIZATION SIZE, 2022-2032 ($MILLION)
- TABLE 54. SPAIN PAYMENT CARD SKIMMING MARKET, BY APPLICATION, 2022-2032 ($MILLION)
- TABLE 55. REST OF EUROPE PAYMENT CARD SKIMMING MARKET, BY COMPONENT, 2022-2032 ($MILLION)
- TABLE 56. REST OF EUROPE PAYMENT CARD SKIMMING MARKET, BY DEPLOYMENT MODE, 2022-2032 ($MILLION)
- TABLE 57. REST OF EUROPE PAYMENT CARD SKIMMING MARKET, BY ORGANIZATION SIZE, 2022-2032 ($MILLION)
- TABLE 58. REST OF EUROPE PAYMENT CARD SKIMMING MARKET, BY APPLICATION, 2022-2032 ($MILLION)
- TABLE 59. ASIA-PACIFIC PAYMENT CARD SKIMMING MARKET, BY COMPONENT, 2022-2032 ($MILLION)
- TABLE 60. ASIA-PACIFIC PAYMENT CARD SKIMMING MARKET, BY DEPLOYMENT MODE, 2022-2032 ($MILLION)
- TABLE 61. ASIA-PACIFIC PAYMENT CARD SKIMMING MARKET, BY ORGANIZATION SIZE, 2022-2032 ($MILLION)
- TABLE 62. ASIA-PACIFIC PAYMENT CARD SKIMMING MARKET, BY APPLICATION, 2022-2032 ($MILLION)
- TABLE 63. ASIA-PACIFIC PAYMENT CARD SKIMMING MARKET, BY COUNTRY, 2022-2032 ($MILLION)
- TABLE 64. CHINA PAYMENT CARD SKIMMING MARKET, BY COMPONENT, 2022-2032 ($MILLION)
- TABLE 65. CHINA PAYMENT CARD SKIMMING MARKET, BY DEPLOYMENT MODE, 2022-2032 ($MILLION)
- TABLE 66. CHINA PAYMENT CARD SKIMMING MARKET, BY ORGANIZATION SIZE, 2022-2032 ($MILLION)
- TABLE 67. CHINA PAYMENT CARD SKIMMING MARKET, BY APPLICATION, 2022-2032 ($MILLION)
- TABLE 68. JAPAN PAYMENT CARD SKIMMING MARKET, BY COMPONENT, 2022-2032 ($MILLION)
- TABLE 69. JAPAN PAYMENT CARD SKIMMING MARKET, BY DEPLOYMENT MODE, 2022-2032 ($MILLION)
- TABLE 70. JAPAN PAYMENT CARD SKIMMING MARKET, BY ORGANIZATION SIZE, 2022-2032 ($MILLION)
- TABLE 71. JAPAN PAYMENT CARD SKIMMING MARKET, BY APPLICATION, 2022-2032 ($MILLION)
- TABLE 72. INDIA PAYMENT CARD SKIMMING MARKET, BY COMPONENT, 2022-2032 ($MILLION)
- TABLE 73. INDIA PAYMENT CARD SKIMMING MARKET, BY DEPLOYMENT MODE, 2022-2032 ($MILLION)
- TABLE 74. INDIA PAYMENT CARD SKIMMING MARKET, BY ORGANIZATION SIZE, 2022-2032 ($MILLION)
- TABLE 75. INDIA PAYMENT CARD SKIMMING MARKET, BY APPLICATION, 2022-2032 ($MILLION)
- TABLE 76. AUSTRALIA PAYMENT CARD SKIMMING MARKET, BY COMPONENT, 2022-2032 ($MILLION)
- TABLE 77. AUSTRALIA PAYMENT CARD SKIMMING MARKET, BY DEPLOYMENT MODE, 2022-2032 ($MILLION)
- TABLE 78. AUSTRALIA PAYMENT CARD SKIMMING MARKET, BY ORGANIZATION SIZE, 2022-2032 ($MILLION)
- TABLE 79. AUSTRALIA PAYMENT CARD SKIMMING MARKET, BY APPLICATION, 2022-2032 ($MILLION)
- TABLE 80. SOUTH KOREA PAYMENT CARD SKIMMING MARKET, BY COMPONENT, 2022-2032 ($MILLION)
- TABLE 81. SOUTH KOREA PAYMENT CARD SKIMMING MARKET, BY DEPLOYMENT MODE, 2022-2032 ($MILLION)
- TABLE 82. SOUTH KOREA PAYMENT CARD SKIMMING MARKET, BY ORGANIZATION SIZE, 2022-2032 ($MILLION)
- TABLE 83. SOUTH KOREA PAYMENT CARD SKIMMING MARKET, BY APPLICATION, 2022-2032 ($MILLION)
- TABLE 84. REST OF ASIA-PACIFIC PAYMENT CARD SKIMMING MARKET, BY COMPONENT, 2022-2032 ($MILLION)
- TABLE 85. REST OF ASIA-PACIFIC PAYMENT CARD SKIMMING MARKET, BY DEPLOYMENT MODE, 2022-2032 ($MILLION)
- TABLE 86. REST OF ASIA-PACIFIC PAYMENT CARD SKIMMING MARKET, BY ORGANIZATION SIZE, 2022-2032 ($MILLION)
- TABLE 87. REST OF ASIA-PACIFIC PAYMENT CARD SKIMMING MARKET, BY APPLICATION, 2022-2032 ($MILLION)
- TABLE 88. LATIN AMERICA PAYMENT CARD SKIMMING MARKET, BY COMPONENT, 2022-2032 ($MILLION)
- TABLE 89. LATIN AMERICA PAYMENT CARD SKIMMING MARKET, BY DEPLOYMENT MODE, 2022-2032 ($MILLION)
- TABLE 90. LATIN AMERICA PAYMENT CARD SKIMMING MARKET, BY ORGANIZATION SIZE, 2022-2032 ($MILLION)
- TABLE 91. LATIN AMERICA PAYMENT CARD SKIMMING MARKET, BY APPLICATION, 2022-2032 ($MILLION)
- TABLE 92. LATIN AMERICA PAYMENT CARD SKIMMING MARKET, BY COUNTRY, 2022-2032 ($MILLION)
- TABLE 93. BRAZIL PAYMENT CARD SKIMMING MARKET, BY COMPONENT, 2022-2032 ($MILLION)
- TABLE 94. BRAZIL PAYMENT CARD SKIMMING MARKET, BY DEPLOYMENT MODE, 2022-2032 ($MILLION)
- TABLE 95. BRAZIL PAYMENT CARD SKIMMING MARKET, BY ORGANIZATION SIZE, 2022-2032 ($MILLION)
- TABLE 96. BRAZIL PAYMENT CARD SKIMMING MARKET, BY APPLICATION, 2022-2032 ($MILLION)
- TABLE 97. ARGENTINA PAYMENT CARD SKIMMING MARKET, BY COMPONENT, 2022-2032 ($MILLION)
- TABLE 98. ARGENTINA PAYMENT CARD SKIMMING MARKET, BY DEPLOYMENT MODE, 2022-2032 ($MILLION)
- TABLE 99. ARGENTINA PAYMENT CARD SKIMMING MARKET, BY ORGANIZATION SIZE, 2022-2032 ($MILLION)
- TABLE 100. ARGENTINA PAYMENT CARD SKIMMING MARKET, BY APPLICATION, 2022-2032 ($MILLION)
- TABLE 101. REST OF LATIN AMERICA PAYMENT CARD SKIMMING MARKET, BY COMPONENT, 2022-2032 ($MILLION)
- TABLE 102. REST OF LATIN AMERICA PAYMENT CARD SKIMMING MARKET, BY DEPLOYMENT MODE, 2022-2032 ($MILLION)
- TABLE 103. REST OF LATIN AMERICA PAYMENT CARD SKIMMING MARKET, BY ORGANIZATION SIZE, 2022-2032 ($MILLION)
- TABLE 104. REST OF LATIN AMERICA PAYMENT CARD SKIMMING MARKET, BY APPLICATION, 2022-2032 ($MILLION)
- TABLE 105. MIDDLE EAST AND AFRICA PAYMENT CARD SKIMMING MARKET, BY COMPONENT, 2022-2032 ($MILLION)
- TABLE 106. MIDDLE EAST AND AFRICA PAYMENT CARD SKIMMING MARKET, BY DEPLOYMENT MODE, 2022-2032 ($MILLION)
- TABLE 107. MIDDLE EAST AND AFRICA PAYMENT CARD SKIMMING MARKET, BY ORGANIZATION SIZE, 2022-2032 ($MILLION)
- TABLE 108. MIDDLE EAST AND AFRICA PAYMENT CARD SKIMMING MARKET, BY APPLICATION, 2022-2032 ($MILLION)
- TABLE 109. MIDDLE EAST AND AFRICA PAYMENT CARD SKIMMING MARKET, BY COUNTRY, 2022-2032 ($MILLION)
- TABLE 110. GCC COUNTRIES PAYMENT CARD SKIMMING MARKET, BY COMPONENT, 2022-2032 ($MILLION)
- TABLE 111. GCC COUNTRIES PAYMENT CARD SKIMMING MARKET, BY DEPLOYMENT MODE, 2022-2032 ($MILLION)
- TABLE 112. GCC COUNTRIES PAYMENT CARD SKIMMING MARKET, BY ORGANIZATION SIZE, 2022-2032 ($MILLION)
- TABLE 113. GCC COUNTRIES PAYMENT CARD SKIMMING MARKET, BY APPLICATION, 2022-2032 ($MILLION)
- TABLE 114. SOUTH AFRICA PAYMENT CARD SKIMMING MARKET, BY COMPONENT, 2022-2032 ($MILLION)
- TABLE 115. SOUTH AFRICA PAYMENT CARD SKIMMING MARKET, BY DEPLOYMENT MODE, 2022-2032 ($MILLION)
- TABLE 116. SOUTH AFRICA PAYMENT CARD SKIMMING MARKET, BY ORGANIZATION SIZE, 2022-2032 ($MILLION)
- TABLE 117. SOUTH AFRICA PAYMENT CARD SKIMMING MARKET, BY APPLICATION, 2022-2032 ($MILLION)
- TABLE 118. REST OF MIDDLE EAST AND AFRICA PAYMENT CARD SKIMMING MARKET, BY COMPONENT, 2022-2032 ($MILLION)
- TABLE 119. REST OF MIDDLE EAST AND AFRICA PAYMENT CARD SKIMMING MARKET, BY DEPLOYMENT MODE, 2022-2032 ($MILLION)
- TABLE 120. REST OF MIDDLE EAST AND AFRICA PAYMENT CARD SKIMMING MARKET, BY ORGANIZATION SIZE, 2022-2032 ($MILLION)
- TABLE 121. REST OF MIDDLE EAST AND AFRICA PAYMENT CARD SKIMMING MARKET, BY APPLICATION, 2022-2032 ($MILLION)
- TABLE 122. MATRIX IFS: KEY EXECUTIVES
- TABLE 123. MATRIX IFS: COMPANY SNAPSHOT
- TABLE 124. MATRIX IFS: PRODUCT SEGMENTS
- TABLE 125. MATRIX IFS: SERVICE SEGMENTS
- TABLE 126. MATRIX IFS: PRODUCT PORTFOLIO
- TABLE 127. MATRIX IFS: KEY STRATERGIES
- TABLE 128. FISERV INC.: KEY EXECUTIVES
- TABLE 129. FISERV INC.: COMPANY SNAPSHOT
- TABLE 130. FISERV INC.: PRODUCT SEGMENTS
- TABLE 131. FISERV INC.: SERVICE SEGMENTS
- TABLE 132. FISERV INC.: PRODUCT PORTFOLIO
- TABLE 133. FISERV INC.: KEY STRATERGIES
- TABLE 134. INVESTEDGE, INC.: KEY EXECUTIVES
- TABLE 135. INVESTEDGE, INC.: COMPANY SNAPSHOT
- TABLE 136. INVESTEDGE, INC.: PRODUCT SEGMENTS
- TABLE 137. INVESTEDGE, INC.: SERVICE SEGMENTS
- TABLE 138. INVESTEDGE, INC.: PRODUCT PORTFOLIO
- TABLE 139. INVESTEDGE, INC.: KEY STRATERGIES
- TABLE 140. COMPLIANCEFORGE: KEY EXECUTIVES
- TABLE 141. COMPLIANCEFORGE: COMPANY SNAPSHOT
- TABLE 142. COMPLIANCEFORGE: PRODUCT SEGMENTS
- TABLE 143. COMPLIANCEFORGE: SERVICE SEGMENTS
- TABLE 144. COMPLIANCEFORGE: PRODUCT PORTFOLIO
- TABLE 145. COMPLIANCEFORGE: KEY STRATERGIES
- TABLE 146. RISKSKILL INC.: KEY EXECUTIVES
- TABLE 147. RISKSKILL INC.: COMPANY SNAPSHOT
- TABLE 148. RISKSKILL INC.: PRODUCT SEGMENTS
- TABLE 149. RISKSKILL INC.: SERVICE SEGMENTS
- TABLE 150. RISKSKILL INC.: PRODUCT PORTFOLIO
- TABLE 151. RISKSKILL INC.: KEY STRATERGIES
- TABLE 152. SESAME SOFTWARE: KEY EXECUTIVES
- TABLE 153. SESAME SOFTWARE: COMPANY SNAPSHOT
- TABLE 154. SESAME SOFTWARE: PRODUCT SEGMENTS
- TABLE 155. SESAME SOFTWARE: SERVICE SEGMENTS
- TABLE 156. SESAME SOFTWARE: PRODUCT PORTFOLIO
- TABLE 157. SESAME SOFTWARE: KEY STRATERGIES
- TABLE 158. C2C SMARTCOMPLIANCE: KEY EXECUTIVES
- TABLE 159. C2C SMARTCOMPLIANCE: COMPANY SNAPSHOT
- TABLE 160. C2C SMARTCOMPLIANCE: PRODUCT SEGMENTS
- TABLE 161. C2C SMARTCOMPLIANCE: SERVICE SEGMENTS
- TABLE 162. C2C SMARTCOMPLIANCE: PRODUCT PORTFOLIO
- TABLE 163. C2C SMARTCOMPLIANCE: KEY STRATERGIES
- TABLE 164. QUERCIA SOFTWARE: KEY EXECUTIVES
- TABLE 165. QUERCIA SOFTWARE: COMPANY SNAPSHOT
- TABLE 166. QUERCIA SOFTWARE: PRODUCT SEGMENTS
- TABLE 167. QUERCIA SOFTWARE: SERVICE SEGMENTS
- TABLE 168. QUERCIA SOFTWARE: PRODUCT PORTFOLIO
- TABLE 169. QUERCIA SOFTWARE: KEY STRATERGIES
- TABLE 170. BWISE: KEY EXECUTIVES
- TABLE 171. BWISE: COMPANY SNAPSHOT
- TABLE 172. BWISE: PRODUCT SEGMENTS
- TABLE 173. BWISE: SERVICE SEGMENTS
- TABLE 174. BWISE: PRODUCT PORTFOLIO
- TABLE 175. BWISE: KEY STRATERGIES
- TABLE 176. RIVIAL DATA SECURITY: KEY EXECUTIVES
- TABLE 177. RIVIAL DATA SECURITY: COMPANY SNAPSHOT
- TABLE 178. RIVIAL DATA SECURITY: PRODUCT SEGMENTS
- TABLE 179. RIVIAL DATA SECURITY: SERVICE SEGMENTS
- TABLE 180. RIVIAL DATA SECURITY: PRODUCT PORTFOLIO
- TABLE 181. RIVIAL DATA SECURITY: KEY STRATERGIES
LIST OF FIGURES
- FIGURE 01. PAYMENT CARD SKIMMING MARKET, 2022-2032
- FIGURE 02. SEGMENTATION OF PAYMENT CARD SKIMMING MARKET,2022-2032
- FIGURE 03. TOP IMPACTING FACTORS IN PAYMENT CARD SKIMMING MARKET
- FIGURE 04. TOP INVESTMENT POCKETS IN PAYMENT CARD SKIMMING MARKET (2023-2032)
- FIGURE 05. BARGAINING POWER OF SUPPLIERS
- FIGURE 06. BARGAINING POWER OF BUYERS
- FIGURE 07. THREAT OF SUBSTITUTION
- FIGURE 08. THREAT OF SUBSTITUTION
- FIGURE 09. COMPETITIVE RIVALRY
- FIGURE 10. GLOBAL PAYMENT CARD SKIMMING MARKET:DRIVERS, RESTRAINTS AND OPPORTUNITIES
- FIGURE 11. PAYMENT CARD SKIMMING MARKET, BY COMPONENT, 2022 AND 2032(%)
- FIGURE 12. COMPARATIVE SHARE ANALYSIS OF PAYMENT CARD SKIMMING MARKET FOR SOLUTION, BY COUNTRY 2022 AND 2032(%)
- FIGURE 13. COMPARATIVE SHARE ANALYSIS OF PAYMENT CARD SKIMMING MARKET FOR SERVICE, BY COUNTRY 2022 AND 2032(%)
- FIGURE 14. PAYMENT CARD SKIMMING MARKET, BY DEPLOYMENT MODE, 2022 AND 2032(%)
- FIGURE 15. COMPARATIVE SHARE ANALYSIS OF PAYMENT CARD SKIMMING MARKET FOR ON-PREMISE, BY COUNTRY 2022 AND 2032(%)
- FIGURE 16. COMPARATIVE SHARE ANALYSIS OF PAYMENT CARD SKIMMING MARKET FOR CLOUD, BY COUNTRY 2022 AND 2032(%)
- FIGURE 17. PAYMENT CARD SKIMMING MARKET, BY ORGANIZATION SIZE, 2022 AND 2032(%)
- FIGURE 18. COMPARATIVE SHARE ANALYSIS OF PAYMENT CARD SKIMMING MARKET FOR LARGE ENTERPRISE, BY COUNTRY 2022 AND 2032(%)
- FIGURE 19. COMPARATIVE SHARE ANALYSIS OF PAYMENT CARD SKIMMING MARKET FOR SMALL AND MEDIUM-SIZED ENTERPRISES, BY COUNTRY 2022 AND 2032(%)
- FIGURE 20. PAYMENT CARD SKIMMING MARKET, BY APPLICATION, 2022 AND 2032(%)
- FIGURE 21. COMPARATIVE SHARE ANALYSIS OF PAYMENT CARD SKIMMING MARKET FOR IDENTITY THEFT, BY COUNTRY 2022 AND 2032(%)
- FIGURE 22. COMPARATIVE SHARE ANALYSIS OF PAYMENT CARD SKIMMING MARKET FOR PAYMENT FRAUD, BY COUNTRY 2022 AND 2032(%)
- FIGURE 23. COMPARATIVE SHARE ANALYSIS OF PAYMENT CARD SKIMMING MARKET FOR MONEY LAUNDERING, BY COUNTRY 2022 AND 2032(%)
- FIGURE 24. COMPARATIVE SHARE ANALYSIS OF PAYMENT CARD SKIMMING MARKET FOR ATMS, BY COUNTRY 2022 AND 2032(%)
- FIGURE 25. COMPARATIVE SHARE ANALYSIS OF PAYMENT CARD SKIMMING MARKET FOR OTHERS, BY COUNTRY 2022 AND 2032(%)
- FIGURE 26. PAYMENT CARD SKIMMING MARKET BY REGION, 2022 AND 2032(%)
- FIGURE 27. U.S. PAYMENT CARD SKIMMING MARKET, 2022-2032 ($MILLION)
- FIGURE 28. CANADA PAYMENT CARD SKIMMING MARKET, 2022-2032 ($MILLION)
- FIGURE 29. UK PAYMENT CARD SKIMMING MARKET, 2022-2032 ($MILLION)
- FIGURE 30. GERMANY PAYMENT CARD SKIMMING MARKET, 2022-2032 ($MILLION)
- FIGURE 31. FRANCE PAYMENT CARD SKIMMING MARKET, 2022-2032 ($MILLION)
- FIGURE 32. ITALY PAYMENT CARD SKIMMING MARKET, 2022-2032 ($MILLION)
- FIGURE 33. SPAIN PAYMENT CARD SKIMMING MARKET, 2022-2032 ($MILLION)
- FIGURE 34. REST OF EUROPE PAYMENT CARD SKIMMING MARKET, 2022-2032 ($MILLION)
- FIGURE 35. CHINA PAYMENT CARD SKIMMING MARKET, 2022-2032 ($MILLION)
- FIGURE 36. JAPAN PAYMENT CARD SKIMMING MARKET, 2022-2032 ($MILLION)
- FIGURE 37. INDIA PAYMENT CARD SKIMMING MARKET, 2022-2032 ($MILLION)
- FIGURE 38. AUSTRALIA PAYMENT CARD SKIMMING MARKET, 2022-2032 ($MILLION)
- FIGURE 39. SOUTH KOREA PAYMENT CARD SKIMMING MARKET, 2022-2032 ($MILLION)
- FIGURE 40. REST OF ASIA-PACIFIC PAYMENT CARD SKIMMING MARKET, 2022-2032 ($MILLION)
- FIGURE 41. BRAZIL PAYMENT CARD SKIMMING MARKET, 2022-2032 ($MILLION)
- FIGURE 42. ARGENTINA PAYMENT CARD SKIMMING MARKET, 2022-2032 ($MILLION)
- FIGURE 43. REST OF LATIN AMERICA PAYMENT CARD SKIMMING MARKET, 2022-2032 ($MILLION)
- FIGURE 44. GCC COUNTRIES PAYMENT CARD SKIMMING MARKET, 2022-2032 ($MILLION)
- FIGURE 45. SOUTH AFRICA PAYMENT CARD SKIMMING MARKET, 2022-2032 ($MILLION)
- FIGURE 46. REST OF MIDDLE EAST AND AFRICA PAYMENT CARD SKIMMING MARKET, 2022-2032 ($MILLION)
- FIGURE 47. TOP WINNING STRATEGIES, BY YEAR
- FIGURE 48. TOP WINNING STRATEGIES, BY DEVELOPMENT
- FIGURE 49. TOP WINNING STRATEGIES, BY COMPANY
- FIGURE 50. PRODUCT MAPPING OF TOP 10 PLAYERS
- FIGURE 51. COMPETITIVE DASHBOARD
- FIGURE 52. COMPETITIVE HEATMAP: PAYMENT CARD SKIMMING MARKET
- FIGURE 53. TOP PLAYER POSITIONING, 2022
Payment card skimming refers to the illegal practice of capturing data from the magnetic stripe of a credit, debit, or any other payment card without the cardholder's knowledge. Skimming devices, often small and inconspicuous, are typically placed on legitimate card-reading devices such as ATMs, gas pumps, or point-of-sale terminals. These devices are designed to surreptitiously record the card's magnetic stripe information, including the card number, expiration date, and sometimes the cardholder's name. Further, criminals use the stolen card data to create counterfeit cards or make unauthorized transactions, leading to financial losses for the cardholder. Skimming is a form of credit card fraud that poses a significant threat to the security of payment card transactions. To minimize the risk of falling victim to skimming, individuals are advised to inspect card readers for any unusual attachments, cover the keypad when entering PINs, and regularly monitor their account statements for any unauthorized transactions. In addition, businesses and financial institutions employ various security measures to detect and prevent skimming activities.
The increasing reliance on electronic payment methods and the proliferation of card-based transactions contribute to the growth of payment card skimming market. As more individuals and businesses adopt digital payment solutions, the sheer volume of transactions becomes an attractive target for cybercriminals seeking to exploit vulnerabilities in payment systems. In addition, the relative ease of deploying skimming devices on widely used platforms such as ATMs and gas pumps enables fraudsters to cast a wide net, capturing sensitive card information from unsuspecting users. However, stringent regulations and legal consequences hinders the growth of the market. On the contrary, the continuous evolution of payment technologies, including the transition to chip-based cards and contactless payments, presents an opportunity to enhance the security of transactions and reduce the susceptibility to skimming. This shift towards more secure payment methods forces criminals to adapt and find new ways to exploit vulnerabilities, driving innovation in security technologies. Moreover, the growing demand for comprehensive cybersecurity solutions creates a market for companies specializing in fraud detection, prevention, and recovery. Businesses that can develop and implement effective security measures stand to gain in this evolving landscape, providing services and solutions that address the persistent threat of payment card skimming.
The global payment card skimming market is segmented into component, deployment mode, organization size, application, and region. On the basis of component, the market is categorized into solution and service. Based on deployment, the market is segmented into on-premise and cloud. On the basis of organization size, the market is segmented into large enterprise and small and medium-sized enterprises. By application, the market is divided into identity threat, payment fraud, money laundering, ATMs, and others. Region-wise, the payment card skimming market is studied across into North America, Europe, Asia-Pacific, Latin America, Middle East and Africa.
The key players in the payment card skimming market include Fiserv Inc., Sesame Software, Complianceforge, Investedge, Riskskill Inc., Rivial Data Security, Matrix IFS, NASDAQ BWISE, Quercia Software, C2C Smartcompliance. These players have adopted numerous strategies to increase their marketplace penetration and strengthen their position in the payment card skimming market.
Key Benefits for Stakeholders
- The study provides in-depth analysis of the payment card skimming market along with current trends and future estimations to illustrate the imminent investment pockets.
- Information about key drivers, restrains, & opportunities and their impact analysis on the payment card skimming market size are provided in the report.
- The Porter's five forces analysis illustrates the potency of buyers and suppliers operating in the industry.
- The quantitative analysis of the payment card skimming market from 2022 to 2032 is provided to determine the market potential.
Additional benefits you will get with this purchase are:
- Quarterly Update and* (only available with a corporate license, on listed price)
- 5 additional Company Profile of client Choice pre- or Post-purchase, as a free update.
- Free Upcoming Version on the Purchase of Five and Enterprise User License.
- 16 analyst hours of support* (post-purchase, if you find additional data requirements upon review of the report, you may receive support amounting to 16 analyst hours to solve questions, and post-sale queries)
- 15% Free Customization* (in case the scope or segment of the report does not match your requirements, 15% is equivalent to 3 working days of free work, applicable once)
- Free data Pack on the Five and Enterprise User License. (Excel version of the report)
- Free Updated report if the report is 6-12 months old or older.
- 24-hour priority response*
- Free Industry updates and white papers.
Possible Customization with this report (with additional cost and timeline, please talk to the sales executive to know more)
- Investment Opportunities
- Market share analysis of players by products/segments
- Regulatory Guidelines
- Additional company profiles with specific to client's interest
- Additional country or region analysis- market size and forecast
- Expanded list for Company Profiles
- Market share analysis of players at global/region/country level
Key Market Segments
By Component
- Solution
- Service
By Deployment Mode
- On-Premise
- Cloud
By Organization Size
- Large Enterprise
- Small and Medium-sized Enterprises
By Application
- Identity Theft
- Payment Fraud
- Money Laundering
- ATMs
- Others
By Region
- North America
- U.S.
- Canada
- Europe
- UK
- Germany
- France
- Italy
- Spain
- Rest of Europe
- Asia-Pacific
- China
- Japan
- India
- Australia
- South Korea
- Rest of Asia-Pacific
- Latin America
- Brazil
- Argentina
- Rest of Latin America
- Middle East and Africa
- Gcc Countries
- South Africa
- Rest of Middle East And Africa
Key Market Players:
- Matrix IFS
- Fiserv Inc.
- investedge, inc.
- Complianceforge
- Riskskill Inc.
- Sesame Software
- C2C Smartcompliance
- Quercia Software
- BWise
- Rivial Data Security
TABLE OF CONTENTS
CHAPTER 1: INTRODUCTION
- 1.1. Report description
- 1.2. Key market segments
- 1.3. Key benefits to the stakeholders
- 1.4. Research methodology
- 1.4.1. Primary research
- 1.4.2. Secondary research
- 1.4.3. Analyst tools and models
CHAPTER 2: EXECUTIVE SUMMARY
- 2.1. CXO Perspective
CHAPTER 3: MARKET OVERVIEW
- 3.1. Market definition and scope
- 3.2. Key findings
- 3.2.1. Top impacting factors
- 3.2.2. Top investment pockets
- 3.3. Porter's five forces analysis
- 3.4. Market dynamics
- 3.4.1. Drivers
- 3.4.2. Restraints
- 3.4.3. Opportunities
CHAPTER 4: PAYMENT CARD SKIMMING MARKET, BY COMPONENT
- 4.1. Overview
- 4.1.1. Market size and forecast
- 4.2. Solution
- 4.2.1. Key market trends, growth factors and opportunities
- 4.2.2. Market size and forecast, by region
- 4.2.3. Market share analysis by country
- 4.3. Service
- 4.3.1. Key market trends, growth factors and opportunities
- 4.3.2. Market size and forecast, by region
- 4.3.3. Market share analysis by country
CHAPTER 5: PAYMENT CARD SKIMMING MARKET, BY DEPLOYMENT MODE
- 5.1. Overview
- 5.1.1. Market size and forecast
- 5.2. On-Premise
- 5.2.1. Key market trends, growth factors and opportunities
- 5.2.2. Market size and forecast, by region
- 5.2.3. Market share analysis by country
- 5.3. Cloud
- 5.3.1. Key market trends, growth factors and opportunities
- 5.3.2. Market size and forecast, by region
- 5.3.3. Market share analysis by country
CHAPTER 6: PAYMENT CARD SKIMMING MARKET, BY ORGANIZATION SIZE
- 6.1. Overview
- 6.1.1. Market size and forecast
- 6.2. Large Enterprise
- 6.2.1. Key market trends, growth factors and opportunities
- 6.2.2. Market size and forecast, by region
- 6.2.3. Market share analysis by country
- 6.3. Small and Medium-sized Enterprises
- 6.3.1. Key market trends, growth factors and opportunities
- 6.3.2. Market size and forecast, by region
- 6.3.3. Market share analysis by country
CHAPTER 7: PAYMENT CARD SKIMMING MARKET, BY APPLICATION
- 7.1. Overview
- 7.1.1. Market size and forecast
- 7.2. Identity Theft
- 7.2.1. Key market trends, growth factors and opportunities
- 7.2.2. Market size and forecast, by region
- 7.2.3. Market share analysis by country
- 7.3. Payment Fraud
- 7.3.1. Key market trends, growth factors and opportunities
- 7.3.2. Market size and forecast, by region
- 7.3.3. Market share analysis by country
- 7.4. Money Laundering
- 7.4.1. Key market trends, growth factors and opportunities
- 7.4.2. Market size and forecast, by region
- 7.4.3. Market share analysis by country
- 7.5. ATMs
- 7.5.1. Key market trends, growth factors and opportunities
- 7.5.2. Market size and forecast, by region
- 7.5.3. Market share analysis by country
- 7.6. Others
- 7.6.1. Key market trends, growth factors and opportunities
- 7.6.2. Market size and forecast, by region
- 7.6.3. Market share analysis by country
CHAPTER 8: PAYMENT CARD SKIMMING MARKET, BY REGION
- 8.1. Overview
- 8.1.1. Market size and forecast By Region
- 8.2. North America
- 8.2.1. Key market trends, growth factors and opportunities
- 8.2.2. Market size and forecast, by Component
- 8.2.3. Market size and forecast, by Deployment Mode
- 8.2.4. Market size and forecast, by Organization Size
- 8.2.5. Market size and forecast, by Application
- 8.2.6. Market size and forecast, by country
- 8.2.6.1. U.S.
- 8.2.6.1.1. Market size and forecast, by Component
- 8.2.6.1.2. Market size and forecast, by Deployment Mode
- 8.2.6.1.3. Market size and forecast, by Organization Size
- 8.2.6.1.4. Market size and forecast, by Application
- 8.2.6.2. Canada
- 8.2.6.2.1. Market size and forecast, by Component
- 8.2.6.2.2. Market size and forecast, by Deployment Mode
- 8.2.6.2.3. Market size and forecast, by Organization Size
- 8.2.6.2.4. Market size and forecast, by Application
- 8.3. Europe
- 8.3.1. Key market trends, growth factors and opportunities
- 8.3.2. Market size and forecast, by Component
- 8.3.3. Market size and forecast, by Deployment Mode
- 8.3.4. Market size and forecast, by Organization Size
- 8.3.5. Market size and forecast, by Application
- 8.3.6. Market size and forecast, by country
- 8.3.6.1. UK
- 8.3.6.1.1. Market size and forecast, by Component
- 8.3.6.1.2. Market size and forecast, by Deployment Mode
- 8.3.6.1.3. Market size and forecast, by Organization Size
- 8.3.6.1.4. Market size and forecast, by Application
- 8.3.6.2. Germany
- 8.3.6.2.1. Market size and forecast, by Component
- 8.3.6.2.2. Market size and forecast, by Deployment Mode
- 8.3.6.2.3. Market size and forecast, by Organization Size
- 8.3.6.2.4. Market size and forecast, by Application
- 8.3.6.3. France
- 8.3.6.3.1. Market size and forecast, by Component
- 8.3.6.3.2. Market size and forecast, by Deployment Mode
- 8.3.6.3.3. Market size and forecast, by Organization Size
- 8.3.6.3.4. Market size and forecast, by Application
- 8.3.6.4. Italy
- 8.3.6.4.1. Market size and forecast, by Component
- 8.3.6.4.2. Market size and forecast, by Deployment Mode
- 8.3.6.4.3. Market size and forecast, by Organization Size
- 8.3.6.4.4. Market size and forecast, by Application
- 8.3.6.5. Spain
- 8.3.6.5.1. Market size and forecast, by Component
- 8.3.6.5.2. Market size and forecast, by Deployment Mode
- 8.3.6.5.3. Market size and forecast, by Organization Size
- 8.3.6.5.4. Market size and forecast, by Application
- 8.3.6.6. Rest of Europe
- 8.3.6.6.1. Market size and forecast, by Component
- 8.3.6.6.2. Market size and forecast, by Deployment Mode
- 8.3.6.6.3. Market size and forecast, by Organization Size
- 8.3.6.6.4. Market size and forecast, by Application
- 8.4. Asia-Pacific
- 8.4.1. Key market trends, growth factors and opportunities
- 8.4.2. Market size and forecast, by Component
- 8.4.3. Market size and forecast, by Deployment Mode
- 8.4.4. Market size and forecast, by Organization Size
- 8.4.5. Market size and forecast, by Application
- 8.4.6. Market size and forecast, by country
- 8.4.6.1. China
- 8.4.6.1.1. Market size and forecast, by Component
- 8.4.6.1.2. Market size and forecast, by Deployment Mode
- 8.4.6.1.3. Market size and forecast, by Organization Size
- 8.4.6.1.4. Market size and forecast, by Application
- 8.4.6.2. Japan
- 8.4.6.2.1. Market size and forecast, by Component
- 8.4.6.2.2. Market size and forecast, by Deployment Mode
- 8.4.6.2.3. Market size and forecast, by Organization Size
- 8.4.6.2.4. Market size and forecast, by Application
- 8.4.6.3. India
- 8.4.6.3.1. Market size and forecast, by Component
- 8.4.6.3.2. Market size and forecast, by Deployment Mode
- 8.4.6.3.3. Market size and forecast, by Organization Size
- 8.4.6.3.4. Market size and forecast, by Application
- 8.4.6.4. Australia
- 8.4.6.4.1. Market size and forecast, by Component
- 8.4.6.4.2. Market size and forecast, by Deployment Mode
- 8.4.6.4.3. Market size and forecast, by Organization Size
- 8.4.6.4.4. Market size and forecast, by Application
- 8.4.6.5. South Korea
- 8.4.6.5.1. Market size and forecast, by Component
- 8.4.6.5.2. Market size and forecast, by Deployment Mode
- 8.4.6.5.3. Market size and forecast, by Organization Size
- 8.4.6.5.4. Market size and forecast, by Application
- 8.4.6.6. Rest of Asia-Pacific
- 8.4.6.6.1. Market size and forecast, by Component
- 8.4.6.6.2. Market size and forecast, by Deployment Mode
- 8.4.6.6.3. Market size and forecast, by Organization Size
- 8.4.6.6.4. Market size and forecast, by Application
- 8.5. Latin America
- 8.5.1. Key market trends, growth factors and opportunities
- 8.5.2. Market size and forecast, by Component
- 8.5.3. Market size and forecast, by Deployment Mode
- 8.5.4. Market size and forecast, by Organization Size
- 8.5.5. Market size and forecast, by Application
- 8.5.6. Market size and forecast, by country
- 8.5.6.1. Brazil
- 8.5.6.1.1. Market size and forecast, by Component
- 8.5.6.1.2. Market size and forecast, by Deployment Mode
- 8.5.6.1.3. Market size and forecast, by Organization Size
- 8.5.6.1.4. Market size and forecast, by Application
- 8.5.6.2. Argentina
- 8.5.6.2.1. Market size and forecast, by Component
- 8.5.6.2.2. Market size and forecast, by Deployment Mode
- 8.5.6.2.3. Market size and forecast, by Organization Size
- 8.5.6.2.4. Market size and forecast, by Application
- 8.5.6.3. Rest of Latin America
- 8.5.6.3.1. Market size and forecast, by Component
- 8.5.6.3.2. Market size and forecast, by Deployment Mode
- 8.5.6.3.3. Market size and forecast, by Organization Size
- 8.5.6.3.4. Market size and forecast, by Application
- 8.6. Middle East and Africa
- 8.6.1. Key market trends, growth factors and opportunities
- 8.6.2. Market size and forecast, by Component
- 8.6.3. Market size and forecast, by Deployment Mode
- 8.6.4. Market size and forecast, by Organization Size
- 8.6.5. Market size and forecast, by Application
- 8.6.6. Market size and forecast, by country
- 8.6.6.1. Gcc Countries
- 8.6.6.1.1. Market size and forecast, by Component
- 8.6.6.1.2. Market size and forecast, by Deployment Mode
- 8.6.6.1.3. Market size and forecast, by Organization Size
- 8.6.6.1.4. Market size and forecast, by Application
- 8.6.6.2. South Africa
- 8.6.6.2.1. Market size and forecast, by Component
- 8.6.6.2.2. Market size and forecast, by Deployment Mode
- 8.6.6.2.3. Market size and forecast, by Organization Size
- 8.6.6.2.4. Market size and forecast, by Application
- 8.6.6.3. Rest of Middle East And Africa
- 8.6.6.3.1. Market size and forecast, by Component
- 8.6.6.3.2. Market size and forecast, by Deployment Mode
- 8.6.6.3.3. Market size and forecast, by Organization Size
- 8.6.6.3.4. Market size and forecast, by Application
CHAPTER 9: COMPETITIVE LANDSCAPE
- 9.1. Introduction
- 9.2. Top winning strategies
- 9.3. Product mapping of top 10 player
- 9.4. Competitive dashboard
- 9.5. Competitive heatmap
- 9.6. Top player positioning, 2022
CHAPTER 10: COMPANY PROFILES
- 10.1. Matrix IFS
- 10.1.1. Company overview
- 10.1.2. Key executives
- 10.1.3. Company snapshot
- 10.1.4. Operating business segments
- 10.1.5. Product portfolio
- 10.1.6. Business performance
- 10.1.7. Key strategic moves and developments
- 10.2. Fiserv Inc.
- 10.2.1. Company overview
- 10.2.2. Key executives
- 10.2.3. Company snapshot
- 10.2.4. Operating business segments
- 10.2.5. Product portfolio
- 10.2.6. Business performance
- 10.2.7. Key strategic moves and developments
- 10.3. investedge, inc.
- 10.3.1. Company overview
- 10.3.2. Key executives
- 10.3.3. Company snapshot
- 10.3.4. Operating business segments
- 10.3.5. Product portfolio
- 10.3.6. Business performance
- 10.3.7. Key strategic moves and developments
- 10.4. Complianceforge
- 10.4.1. Company overview
- 10.4.2. Key executives
- 10.4.3. Company snapshot
- 10.4.4. Operating business segments
- 10.4.5. Product portfolio
- 10.4.6. Business performance
- 10.4.7. Key strategic moves and developments
- 10.5. Riskskill Inc.
- 10.5.1. Company overview
- 10.5.2. Key executives
- 10.5.3. Company snapshot
- 10.5.4. Operating business segments
- 10.5.5. Product portfolio
- 10.5.6. Business performance
- 10.5.7. Key strategic moves and developments
- 10.6. Sesame Software
- 10.6.1. Company overview
- 10.6.2. Key executives
- 10.6.3. Company snapshot
- 10.6.4. Operating business segments
- 10.6.5. Product portfolio
- 10.6.6. Business performance
- 10.6.7. Key strategic moves and developments
- 10.7. C2C Smartcompliance
- 10.7.1. Company overview
- 10.7.2. Key executives
- 10.7.3. Company snapshot
- 10.7.4. Operating business segments
- 10.7.5. Product portfolio
- 10.7.6. Business performance
- 10.7.7. Key strategic moves and developments
- 10.8. Quercia Software
- 10.8.1. Company overview
- 10.8.2. Key executives
- 10.8.3. Company snapshot
- 10.8.4. Operating business segments
- 10.8.5. Product portfolio
- 10.8.6. Business performance
- 10.8.7. Key strategic moves and developments
- 10.9. BWise
- 10.9.1. Company overview
- 10.9.2. Key executives
- 10.9.3. Company snapshot
- 10.9.4. Operating business segments
- 10.9.5. Product portfolio
- 10.9.6. Business performance
- 10.9.7. Key strategic moves and developments
- 10.10. Rivial Data Security
- 10.10.1. Company overview
- 10.10.2. Key executives
- 10.10.3. Company snapshot
- 10.10.4. Operating business segments
- 10.10.5. Product portfolio
- 10.10.6. Business performance
- 10.10.7. Key strategic moves and developments
