
|
市場調査レポート
商品コード
1446905
ソーラー充電器市場:タイプ別、ソーラーパネルタイプ別、用途別:世界の機会分析と産業予測、2023-2032年Solar Charger Market By Type (Portable, Standalone), By Solar Panel Type (Folding, Fixed, Flexible), By Application (Consumer Electronics, Transportation, Others): Global Opportunity Analysis and Industry Forecast, 2023-2032 |
||||||
|
|||||||

| ソーラー充電器市場:タイプ別、ソーラーパネルタイプ別、用途別:世界の機会分析と産業予測、2023-2032年 |
|
出版日: 2024年01月30日
発行: Allied Market Research
ページ情報: 英文 250 Pages
納期: 2~3営業日
|

- 全表示
- 概要
- 図表
- 目次
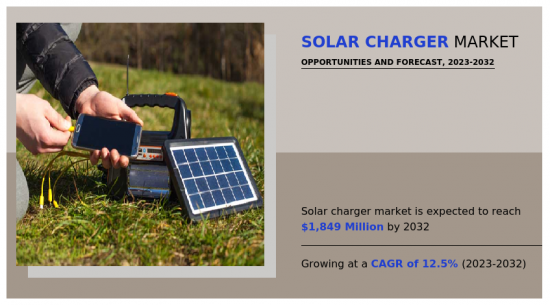
世界のソーラー充電器市場は、2022年に5億7,500万米ドルと評価され、2023年から2032年にかけてCAGR 12.5%で成長し、2032年には18億4,900万米ドルに達すると予測されています。
ソーラー充電器は、太陽光を利用してスマートフォンやタブレットなどの電子機器に電力を供給します。太陽エネルギーを電気に変換し、バッテリーに蓄えたり、デバイスの直接充電に使用したりする太陽光発電パネルで構成されます。持ち運びができるように設計されたソーラー充電器は、アウトドア活動や旅行、従来の電源がない地域での緊急時に理想的です。持続可能で環境に優しいソリューションであり、送電網への依存を減らし、再生可能な太陽エネルギーで機器に電力を供給する便利な手段を提供します。
電気自動車の急速な普及がソーラー充電器市場の成長促進要因となっています。電気自動車の普及による充電インフラへのニーズの高まりは、ソーラー充電器によって持続可能かつ分散的に満たされる可能性があります。ソーラー充電器市場は、環境意識、政府支援、技術進歩がこのシフトを推進しているため、持続可能なモビリティの方向性を決定する上で重要な役割を果たすと予想されます。
内燃エンジン車から電気自動車への転換が環境にもたらすメリットに対する顧客、企業、政府の意識の高まりが、世界の電気自動車導入の増加につながった。しかし、EVの利用拡大にはインフラ関連の問題があり、特に従来の電力網では対応できない可能性があります。電気自動車(EV)の所有者は、ソーラー充電器を採用することで、従来の電源の必要性を減らすことができます。
電気自動車の設計にソーラー・パネルを直接組み込む動きが活発化しているのも、太陽エネルギーと電気自動車が関係しているもうひとつの理由です。ソーラーパネルを電気自動車のボディに組み込み、太陽光を取り込んで電力を追加したり、バッテリーの充電に役立てたりしているメーカーもあります。この包括的な戦略は、外部ソーラー充電器の助けを借りて電気自動車のための包括的な太陽光発電エコシステムを構築することにより、持続可能な輸送をさらに促進します。このように、電気自動車の普及がソーラー充電器の需要を押し上げ、市場の成長につながると期待されています。
ソーラー充電器の開発と普及は、太陽エネルギーの断続的な性質によって妨げられています。天候、時間帯、場所などいくつかの要因による太陽の不規則性は、発電を太陽光に依存するソーラー充電器にとって当然の問題です。ソーラー充電器の断続的な性質は、一貫して確実に動作する能力を制限するため、電子機器の主要または唯一の電源としての適性に影響を与えます。
発電の予測不可能な性質は、太陽エネルギーの断続的な性質によって引き起こされる主な問題の一つです。ソーラー充電器は主に太陽光に依存して機能するため、雲や日陰のような障害物があると、その効果は大幅に低下します。特に日照時間の短い地域や悪天候時には、消費者がソーラー充電器に全面的に依存することは難しいです。
太陽エネルギーの断続的な性質は、日照時間の日較差や季節変動によってさらに悪化します。太陽は日中常に輝いているとは限らないため、ソーラー充電器は早朝、午後遅く、夜間には効率的に作動しない可能性があります。安定した信頼できる電源に依存している消費者にとって、このような発電量の変動は、特にエネルギー消費のピーク時に深刻な問題となる可能性があります。このように、太陽エネルギーの断続的な性質は、予測期間中のソーラー充電器市場の成長を抑制します。
ソーラーパネルのコスト低下はソーラー充電器市場にとって絶好の成長機会となった。ソーラーパネルのコストが比較的高いことが、ソーラー技術、特にソーラー充電器を広く利用する上での主な障壁の一つでした。製造技術の向上、規模の経済、競争の激化によりソーラーパネルのコストは低下したが、ソーラー充電器市場は大きく成長しました。
市場の力と技術の進歩が相まって、ソーラー・パネルのコストは低下しました。太陽電池の効率は時間の経過とともに大幅に向上し、生産者はより少ない部品でより多くの電気を作ることができるようになった。
さらに、製造方法と材料の進歩により、ソーラーパネル製造プロセスの手頃な価格と拡張性が向上しました。生産コストが低下し、ソーラーパネルの効率が向上したため、太陽光発電の出力1ワットあたりのコストは大幅に低下し、ソーラー充電器はより幅広い消費者にとってより身近で手頃なものとなった。このように、ソーラーパネルのコスト低下は、ソーラー充電器市場に有利な成長機会をもたらしました。
ソーラー充電器市場は、タイプ別、ソーラーパネルタイプ別、用途別、地域別に区分されます。タイプ別では、市場はポータブルとスタンドアロンに分けられます。ソーラーパネルタイプ別では、市場は固定型、折りたたみ型、フレキシブル型に分類されます。用途別では、家電、輸送、その他に分類されます。地域別では、北米、欧州、アジア太平洋、LAMEAで調査されています。
世界のソーラー充電器市場で事業を展開している主要企業は、Allpowers Industrial International、Goal Zero、letsolar、RAVPower、Renogy、Secur、Solar Frontier Europe GmbH、Solar Technology International、The NOCO Company、YOLKです。
その他、Anker、BioLite Inc.、Choetech Store、Hanergy Thin Film Power Group Europe、Little Sun、OUTXE、Suntrica、ToughTested、Voltaic Systems、Xtormなどがあります。
利害関係者にとっての主なメリット
- 当レポートでは、2022年から2032年にかけてのソーラー充電器市場分析の市場セグメント、現在の動向、推定・動向分析、ダイナミクスを定量的に分析し、ソーラー充電器の有力な市場機会を特定します。
- 市場促進要因、市場抑制要因、市場機会に関連する情報とともに市場調査を提供します。
- ポーターのファイブフォース分析では、利害関係者が利益重視のビジネス決定を下し、サプライヤーとバイヤーのネットワークを強化できるように、バイヤーとサプライヤーの力を強調します。
- ソーラー充電器の市場セグメンテーションの詳細な分析は、市場機会を決定するのに役立ちます。
- 各地域の主要国は、世界市場への収益貢献度に応じてマッピングされています。
- 市場プレイヤーのポジショニングは、ベンチマーキングを容易にし、市場プレイヤーの現在のポジションの明確な理解を提供します。
- 本レポートには、地域別および世界のソーラー充電器市場動向、主要企業、市場セグメント、応用分野、市場成長戦略の分析が含まれています。
本レポートで可能なカスタマイズ
- 製品ベンチマーク/製品仕様と用途
- 製品ライフサイクル
- サプライチェーン分析とベンダーマージン
- 地域別新規参入企業
- 平均消費支出
- 製品/セグメント別の市場セグメンテーション
- 主なプレイヤーの新製品開発/製品マトリックス
- 規制ガイドライン
- 顧客の関心に応じた追加企業プロファイル
- 国別または地域別追加分析-市場規模と予測
- 平均販売価格分析/プライスポイント分析
- 企業プロファイルの拡張リスト
- 過去の市場データ
- 世界/地域/国別レベルでのプレーヤーの市場シェア分析
- SWOT分析
目次
第1章 イントロダクション
第2章 エグゼクティブサマリー
第3章 市場概要
- 市場の定義と範囲
- 主な調査結果
- 影響要因
- 主な投資機会
- ポーターのファイブフォース分析
- 市場力学
- 促進要因
- 抑制要因
- 機会
- バリューチェーン分析
第4章 ソーラー充電器市場:タイプ別
- 概要
- ポータブル
- 独立型
第5章 ソーラー充電器市場:ソーラーパネルタイプ別
- 概要
- 折りたたみ式
- 固定式
- フレキシブル
第6章 ソーラー充電器市場:用途別
- 概要
- コンシューマーエレクトロニクス
- 輸送機器
- その他
第7章 ソーラー充電器市場:地域別
- 概要
- 北米
- 米国
- カナダ
- メキシコ
- 欧州
- ドイツ
- 英国
- フランス
- イタリア
- スペイン
- その他
- アジア太平洋
- 中国
- 日本
- インド
- 韓国
- オーストラリア
- その他
- ラテンアメリカ・中東・アフリカ
- ブラジル
- 南アフリカ
- サウジアラビア
- その他
第8章 競争情勢
- イントロダクション
- 主要成功戦略
- 主要10社の製品マッピング
- 競合ダッシュボード
- 競合ヒートマップ
- 主要企業のポジショニング、2022年
第9章 企業プロファイル
- Goal Zero
- Allpowers Industrial International
- letsolar
- RAVPower
- renogy-solar
- Secur.
- Solar Frontier Europe GmbH
- Solar Technology International
- the noco company
- yolk
LIST OF TABLES
- TABLE 01. GLOBAL SOLAR CHARGER MARKET, BY TYPE, 2022-2032 ($THOUSAND)
- TABLE 02. SOLAR CHARGER MARKET FOR PORTABLE, BY REGION, 2022-2032 ($THOUSAND)
- TABLE 03. SOLAR CHARGER MARKET FOR STANDALONE, BY REGION, 2022-2032 ($THOUSAND)
- TABLE 04. GLOBAL SOLAR CHARGER MARKET, BY SOLAR PANEL TYPE, 2022-2032 ($THOUSAND)
- TABLE 05. SOLAR CHARGER MARKET FOR FOLDING, BY REGION, 2022-2032 ($THOUSAND)
- TABLE 06. SOLAR CHARGER MARKET FOR FIXED, BY REGION, 2022-2032 ($THOUSAND)
- TABLE 07. SOLAR CHARGER MARKET FOR FLEXIBLE, BY REGION, 2022-2032 ($THOUSAND)
- TABLE 08. GLOBAL SOLAR CHARGER MARKET, BY APPLICATION, 2022-2032 ($THOUSAND)
- TABLE 09. SOLAR CHARGER MARKET FOR CONSUMER ELECTRONICS, BY REGION, 2022-2032 ($THOUSAND)
- TABLE 10. SOLAR CHARGER MARKET FOR TRANSPORTATION, BY REGION, 2022-2032 ($THOUSAND)
- TABLE 11. SOLAR CHARGER MARKET FOR OTHERS, BY REGION, 2022-2032 ($THOUSAND)
- TABLE 12. SOLAR CHARGER MARKET, BY REGION, 2022-2032 ($THOUSAND)
- TABLE 13. NORTH AMERICA SOLAR CHARGER MARKET, BY TYPE, 2022-2032 ($THOUSAND)
- TABLE 14. NORTH AMERICA SOLAR CHARGER MARKET, BY SOLAR PANEL TYPE, 2022-2032 ($THOUSAND)
- TABLE 15. NORTH AMERICA SOLAR CHARGER MARKET, BY APPLICATION, 2022-2032 ($THOUSAND)
- TABLE 16. NORTH AMERICA SOLAR CHARGER MARKET, BY COUNTRY, 2022-2032 ($THOUSAND)
- TABLE 17. U.S. SOLAR CHARGER MARKET, BY TYPE, 2022-2032 ($THOUSAND)
- TABLE 18. U.S. SOLAR CHARGER MARKET, BY SOLAR PANEL TYPE, 2022-2032 ($THOUSAND)
- TABLE 19. U.S. SOLAR CHARGER MARKET, BY APPLICATION, 2022-2032 ($THOUSAND)
- TABLE 20. CANADA SOLAR CHARGER MARKET, BY TYPE, 2022-2032 ($THOUSAND)
- TABLE 21. CANADA SOLAR CHARGER MARKET, BY SOLAR PANEL TYPE, 2022-2032 ($THOUSAND)
- TABLE 22. CANADA SOLAR CHARGER MARKET, BY APPLICATION, 2022-2032 ($THOUSAND)
- TABLE 23. MEXICO SOLAR CHARGER MARKET, BY TYPE, 2022-2032 ($THOUSAND)
- TABLE 24. MEXICO SOLAR CHARGER MARKET, BY SOLAR PANEL TYPE, 2022-2032 ($THOUSAND)
- TABLE 25. MEXICO SOLAR CHARGER MARKET, BY APPLICATION, 2022-2032 ($THOUSAND)
- TABLE 26. EUROPE SOLAR CHARGER MARKET, BY TYPE, 2022-2032 ($THOUSAND)
- TABLE 27. EUROPE SOLAR CHARGER MARKET, BY SOLAR PANEL TYPE, 2022-2032 ($THOUSAND)
- TABLE 28. EUROPE SOLAR CHARGER MARKET, BY APPLICATION, 2022-2032 ($THOUSAND)
- TABLE 29. EUROPE SOLAR CHARGER MARKET, BY COUNTRY, 2022-2032 ($THOUSAND)
- TABLE 30. GERMANY SOLAR CHARGER MARKET, BY TYPE, 2022-2032 ($THOUSAND)
- TABLE 31. GERMANY SOLAR CHARGER MARKET, BY SOLAR PANEL TYPE, 2022-2032 ($THOUSAND)
- TABLE 32. GERMANY SOLAR CHARGER MARKET, BY APPLICATION, 2022-2032 ($THOUSAND)
- TABLE 33. UK SOLAR CHARGER MARKET, BY TYPE, 2022-2032 ($THOUSAND)
- TABLE 34. UK SOLAR CHARGER MARKET, BY SOLAR PANEL TYPE, 2022-2032 ($THOUSAND)
- TABLE 35. UK SOLAR CHARGER MARKET, BY APPLICATION, 2022-2032 ($THOUSAND)
- TABLE 36. FRANCE SOLAR CHARGER MARKET, BY TYPE, 2022-2032 ($THOUSAND)
- TABLE 37. FRANCE SOLAR CHARGER MARKET, BY SOLAR PANEL TYPE, 2022-2032 ($THOUSAND)
- TABLE 38. FRANCE SOLAR CHARGER MARKET, BY APPLICATION, 2022-2032 ($THOUSAND)
- TABLE 39. ITALY SOLAR CHARGER MARKET, BY TYPE, 2022-2032 ($THOUSAND)
- TABLE 40. ITALY SOLAR CHARGER MARKET, BY SOLAR PANEL TYPE, 2022-2032 ($THOUSAND)
- TABLE 41. ITALY SOLAR CHARGER MARKET, BY APPLICATION, 2022-2032 ($THOUSAND)
- TABLE 42. SPAIN SOLAR CHARGER MARKET, BY TYPE, 2022-2032 ($THOUSAND)
- TABLE 43. SPAIN SOLAR CHARGER MARKET, BY SOLAR PANEL TYPE, 2022-2032 ($THOUSAND)
- TABLE 44. SPAIN SOLAR CHARGER MARKET, BY APPLICATION, 2022-2032 ($THOUSAND)
- TABLE 45. REST OF EUROPE SOLAR CHARGER MARKET, BY TYPE, 2022-2032 ($THOUSAND)
- TABLE 46. REST OF EUROPE SOLAR CHARGER MARKET, BY SOLAR PANEL TYPE, 2022-2032 ($THOUSAND)
- TABLE 47. REST OF EUROPE SOLAR CHARGER MARKET, BY APPLICATION, 2022-2032 ($THOUSAND)
- TABLE 48. ASIA-PACIFIC SOLAR CHARGER MARKET, BY TYPE, 2022-2032 ($THOUSAND)
- TABLE 49. ASIA-PACIFIC SOLAR CHARGER MARKET, BY SOLAR PANEL TYPE, 2022-2032 ($THOUSAND)
- TABLE 50. ASIA-PACIFIC SOLAR CHARGER MARKET, BY APPLICATION, 2022-2032 ($THOUSAND)
- TABLE 51. ASIA-PACIFIC SOLAR CHARGER MARKET, BY COUNTRY, 2022-2032 ($THOUSAND)
- TABLE 52. CHINA SOLAR CHARGER MARKET, BY TYPE, 2022-2032 ($THOUSAND)
- TABLE 53. CHINA SOLAR CHARGER MARKET, BY SOLAR PANEL TYPE, 2022-2032 ($THOUSAND)
- TABLE 54. CHINA SOLAR CHARGER MARKET, BY APPLICATION, 2022-2032 ($THOUSAND)
- TABLE 55. JAPAN SOLAR CHARGER MARKET, BY TYPE, 2022-2032 ($THOUSAND)
- TABLE 56. JAPAN SOLAR CHARGER MARKET, BY SOLAR PANEL TYPE, 2022-2032 ($THOUSAND)
- TABLE 57. JAPAN SOLAR CHARGER MARKET, BY APPLICATION, 2022-2032 ($THOUSAND)
- TABLE 58. INDIA SOLAR CHARGER MARKET, BY TYPE, 2022-2032 ($THOUSAND)
- TABLE 59. INDIA SOLAR CHARGER MARKET, BY SOLAR PANEL TYPE, 2022-2032 ($THOUSAND)
- TABLE 60. INDIA SOLAR CHARGER MARKET, BY APPLICATION, 2022-2032 ($THOUSAND)
- TABLE 61. SOUTH KOREA SOLAR CHARGER MARKET, BY TYPE, 2022-2032 ($THOUSAND)
- TABLE 62. SOUTH KOREA SOLAR CHARGER MARKET, BY SOLAR PANEL TYPE, 2022-2032 ($THOUSAND)
- TABLE 63. SOUTH KOREA SOLAR CHARGER MARKET, BY APPLICATION, 2022-2032 ($THOUSAND)
- TABLE 64. AUSTRALIA SOLAR CHARGER MARKET, BY TYPE, 2022-2032 ($THOUSAND)
- TABLE 65. AUSTRALIA SOLAR CHARGER MARKET, BY SOLAR PANEL TYPE, 2022-2032 ($THOUSAND)
- TABLE 66. AUSTRALIA SOLAR CHARGER MARKET, BY APPLICATION, 2022-2032 ($THOUSAND)
- TABLE 67. REST OF ASIA-PACIFIC SOLAR CHARGER MARKET, BY TYPE, 2022-2032 ($THOUSAND)
- TABLE 68. REST OF ASIA-PACIFIC SOLAR CHARGER MARKET, BY SOLAR PANEL TYPE, 2022-2032 ($THOUSAND)
- TABLE 69. REST OF ASIA-PACIFIC SOLAR CHARGER MARKET, BY APPLICATION, 2022-2032 ($THOUSAND)
- TABLE 70. LAMEA SOLAR CHARGER MARKET, BY TYPE, 2022-2032 ($THOUSAND)
- TABLE 71. LAMEA SOLAR CHARGER MARKET, BY SOLAR PANEL TYPE, 2022-2032 ($THOUSAND)
- TABLE 72. LAMEA SOLAR CHARGER MARKET, BY APPLICATION, 2022-2032 ($THOUSAND)
- TABLE 73. LAMEA SOLAR CHARGER MARKET, BY COUNTRY, 2022-2032 ($THOUSAND)
- TABLE 74. BRAZIL SOLAR CHARGER MARKET, BY TYPE, 2022-2032 ($THOUSAND)
- TABLE 75. BRAZIL SOLAR CHARGER MARKET, BY SOLAR PANEL TYPE, 2022-2032 ($THOUSAND)
- TABLE 76. BRAZIL SOLAR CHARGER MARKET, BY APPLICATION, 2022-2032 ($THOUSAND)
- TABLE 77. SOUTH AFRICA SOLAR CHARGER MARKET, BY TYPE, 2022-2032 ($THOUSAND)
- TABLE 78. SOUTH AFRICA SOLAR CHARGER MARKET, BY SOLAR PANEL TYPE, 2022-2032 ($THOUSAND)
- TABLE 79. SOUTH AFRICA SOLAR CHARGER MARKET, BY APPLICATION, 2022-2032 ($THOUSAND)
- TABLE 80. SAUDI ARABIA SOLAR CHARGER MARKET, BY TYPE, 2022-2032 ($THOUSAND)
- TABLE 81. SAUDI ARABIA SOLAR CHARGER MARKET, BY SOLAR PANEL TYPE, 2022-2032 ($THOUSAND)
- TABLE 82. SAUDI ARABIA SOLAR CHARGER MARKET, BY APPLICATION, 2022-2032 ($THOUSAND)
- TABLE 83. REST OF LAMEA SOLAR CHARGER MARKET, BY TYPE, 2022-2032 ($THOUSAND)
- TABLE 84. REST OF LAMEA SOLAR CHARGER MARKET, BY SOLAR PANEL TYPE, 2022-2032 ($THOUSAND)
- TABLE 85. REST OF LAMEA SOLAR CHARGER MARKET, BY APPLICATION, 2022-2032 ($THOUSAND)
- TABLE 86. GOAL ZERO: KEY EXECUTIVES
- TABLE 87. GOAL ZERO: COMPANY SNAPSHOT
- TABLE 88. GOAL ZERO: PRODUCT SEGMENTS
- TABLE 89. GOAL ZERO: SERVICE SEGMENTS
- TABLE 90. GOAL ZERO: PRODUCT PORTFOLIO
- TABLE 91. GOAL ZERO: KEY STRATERGIES
- TABLE 92. ALLPOWERS INDUSTRIAL INTERNATIONAL: KEY EXECUTIVES
- TABLE 93. ALLPOWERS INDUSTRIAL INTERNATIONAL: COMPANY SNAPSHOT
- TABLE 94. ALLPOWERS INDUSTRIAL INTERNATIONAL: PRODUCT SEGMENTS
- TABLE 95. ALLPOWERS INDUSTRIAL INTERNATIONAL: SERVICE SEGMENTS
- TABLE 96. ALLPOWERS INDUSTRIAL INTERNATIONAL: PRODUCT PORTFOLIO
- TABLE 97. ALLPOWERS INDUSTRIAL INTERNATIONAL: KEY STRATERGIES
- TABLE 98. LETSOLAR: KEY EXECUTIVES
- TABLE 99. LETSOLAR: COMPANY SNAPSHOT
- TABLE 100. LETSOLAR: PRODUCT SEGMENTS
- TABLE 101. LETSOLAR: SERVICE SEGMENTS
- TABLE 102. LETSOLAR: PRODUCT PORTFOLIO
- TABLE 103. LETSOLAR: KEY STRATERGIES
- TABLE 104. RAVPOWER: KEY EXECUTIVES
- TABLE 105. RAVPOWER: COMPANY SNAPSHOT
- TABLE 106. RAVPOWER: PRODUCT SEGMENTS
- TABLE 107. RAVPOWER: SERVICE SEGMENTS
- TABLE 108. RAVPOWER: PRODUCT PORTFOLIO
- TABLE 109. RAVPOWER: KEY STRATERGIES
- TABLE 110. RENOGY-SOLAR: KEY EXECUTIVES
- TABLE 111. RENOGY-SOLAR: COMPANY SNAPSHOT
- TABLE 112. RENOGY-SOLAR: PRODUCT SEGMENTS
- TABLE 113. RENOGY-SOLAR: SERVICE SEGMENTS
- TABLE 114. RENOGY-SOLAR: PRODUCT PORTFOLIO
- TABLE 115. RENOGY-SOLAR: KEY STRATERGIES
- TABLE 116. SECUR.: KEY EXECUTIVES
- TABLE 117. SECUR.: COMPANY SNAPSHOT
- TABLE 118. SECUR.: PRODUCT SEGMENTS
- TABLE 119. SECUR.: SERVICE SEGMENTS
- TABLE 120. SECUR.: PRODUCT PORTFOLIO
- TABLE 121. SECUR.: KEY STRATERGIES
- TABLE 122. SOLAR FRONTIER EUROPE GMBH: KEY EXECUTIVES
- TABLE 123. SOLAR FRONTIER EUROPE GMBH: COMPANY SNAPSHOT
- TABLE 124. SOLAR FRONTIER EUROPE GMBH: PRODUCT SEGMENTS
- TABLE 125. SOLAR FRONTIER EUROPE GMBH: SERVICE SEGMENTS
- TABLE 126. SOLAR FRONTIER EUROPE GMBH: PRODUCT PORTFOLIO
- TABLE 127. SOLAR FRONTIER EUROPE GMBH: KEY STRATERGIES
- TABLE 128. SOLAR TECHNOLOGY INTERNATIONAL: KEY EXECUTIVES
- TABLE 129. SOLAR TECHNOLOGY INTERNATIONAL: COMPANY SNAPSHOT
- TABLE 130. SOLAR TECHNOLOGY INTERNATIONAL: PRODUCT SEGMENTS
- TABLE 131. SOLAR TECHNOLOGY INTERNATIONAL: SERVICE SEGMENTS
- TABLE 132. SOLAR TECHNOLOGY INTERNATIONAL: PRODUCT PORTFOLIO
- TABLE 133. SOLAR TECHNOLOGY INTERNATIONAL: KEY STRATERGIES
- TABLE 134. THE NOCO COMPANY: KEY EXECUTIVES
- TABLE 135. THE NOCO COMPANY: COMPANY SNAPSHOT
- TABLE 136. THE NOCO COMPANY: PRODUCT SEGMENTS
- TABLE 137. THE NOCO COMPANY: SERVICE SEGMENTS
- TABLE 138. THE NOCO COMPANY: PRODUCT PORTFOLIO
- TABLE 139. THE NOCO COMPANY: KEY STRATERGIES
- TABLE 140. YOLK: KEY EXECUTIVES
- TABLE 141. YOLK: COMPANY SNAPSHOT
- TABLE 142. YOLK: PRODUCT SEGMENTS
- TABLE 143. YOLK: SERVICE SEGMENTS
- TABLE 144. YOLK: PRODUCT PORTFOLIO
- TABLE 145. YOLK: KEY STRATERGIES
LIST OF FIGURES
- FIGURE 01. SOLAR CHARGER MARKET, 2022-2032
- FIGURE 02. SEGMENTATION OF SOLAR CHARGER MARKET,2022-2032
- FIGURE 03. TOP IMPACTING FACTORS IN SOLAR CHARGER MARKET
- FIGURE 04. TOP INVESTMENT POCKETS IN SOLAR CHARGER MARKET (2023-2032)
- FIGURE 05. BARGAINING POWER OF SUPPLIERS
- FIGURE 06. BARGAINING POWER OF BUYERS
- FIGURE 07. THREAT OF SUBSTITUTION
- FIGURE 08. THREAT OF SUBSTITUTION
- FIGURE 09. COMPETITIVE RIVALRY
- FIGURE 10. GLOBAL SOLAR CHARGER MARKET:DRIVERS, RESTRAINTS AND OPPORTUNITIES
- FIGURE 11. SOLAR CHARGER MARKET, BY TYPE, 2022 AND 2032(%)
- FIGURE 12. COMPARATIVE SHARE ANALYSIS OF SOLAR CHARGER MARKET FOR PORTABLE, BY COUNTRY 2022 AND 2032(%)
- FIGURE 13. COMPARATIVE SHARE ANALYSIS OF SOLAR CHARGER MARKET FOR STANDALONE, BY COUNTRY 2022 AND 2032(%)
- FIGURE 14. SOLAR CHARGER MARKET, BY SOLAR PANEL TYPE, 2022 AND 2032(%)
- FIGURE 15. COMPARATIVE SHARE ANALYSIS OF SOLAR CHARGER MARKET FOR FOLDING, BY COUNTRY 2022 AND 2032(%)
- FIGURE 16. COMPARATIVE SHARE ANALYSIS OF SOLAR CHARGER MARKET FOR FIXED, BY COUNTRY 2022 AND 2032(%)
- FIGURE 17. COMPARATIVE SHARE ANALYSIS OF SOLAR CHARGER MARKET FOR FLEXIBLE, BY COUNTRY 2022 AND 2032(%)
- FIGURE 18. SOLAR CHARGER MARKET, BY APPLICATION, 2022 AND 2032(%)
- FIGURE 19. COMPARATIVE SHARE ANALYSIS OF SOLAR CHARGER MARKET FOR CONSUMER ELECTRONICS, BY COUNTRY 2022 AND 2032(%)
- FIGURE 20. COMPARATIVE SHARE ANALYSIS OF SOLAR CHARGER MARKET FOR TRANSPORTATION, BY COUNTRY 2022 AND 2032(%)
- FIGURE 21. COMPARATIVE SHARE ANALYSIS OF SOLAR CHARGER MARKET FOR OTHERS, BY COUNTRY 2022 AND 2032(%)
- FIGURE 22. SOLAR CHARGER MARKET BY REGION, 2022 AND 2032(%)
- FIGURE 23. U.S. SOLAR CHARGER MARKET, 2022-2032 ($THOUSAND)
- FIGURE 24. CANADA SOLAR CHARGER MARKET, 2022-2032 ($THOUSAND)
- FIGURE 25. MEXICO SOLAR CHARGER MARKET, 2022-2032 ($THOUSAND)
- FIGURE 26. GERMANY SOLAR CHARGER MARKET, 2022-2032 ($THOUSAND)
- FIGURE 27. UK SOLAR CHARGER MARKET, 2022-2032 ($THOUSAND)
- FIGURE 28. FRANCE SOLAR CHARGER MARKET, 2022-2032 ($THOUSAND)
- FIGURE 29. ITALY SOLAR CHARGER MARKET, 2022-2032 ($THOUSAND)
- FIGURE 30. SPAIN SOLAR CHARGER MARKET, 2022-2032 ($THOUSAND)
- FIGURE 31. REST OF EUROPE SOLAR CHARGER MARKET, 2022-2032 ($THOUSAND)
- FIGURE 32. CHINA SOLAR CHARGER MARKET, 2022-2032 ($THOUSAND)
- FIGURE 33. JAPAN SOLAR CHARGER MARKET, 2022-2032 ($THOUSAND)
- FIGURE 34. INDIA SOLAR CHARGER MARKET, 2022-2032 ($THOUSAND)
- FIGURE 35. SOUTH KOREA SOLAR CHARGER MARKET, 2022-2032 ($THOUSAND)
- FIGURE 36. AUSTRALIA SOLAR CHARGER MARKET, 2022-2032 ($THOUSAND)
- FIGURE 37. REST OF ASIA-PACIFIC SOLAR CHARGER MARKET, 2022-2032 ($THOUSAND)
- FIGURE 38. BRAZIL SOLAR CHARGER MARKET, 2022-2032 ($THOUSAND)
- FIGURE 39. SOUTH AFRICA SOLAR CHARGER MARKET, 2022-2032 ($THOUSAND)
- FIGURE 40. SAUDI ARABIA SOLAR CHARGER MARKET, 2022-2032 ($THOUSAND)
- FIGURE 41. REST OF LAMEA SOLAR CHARGER MARKET, 2022-2032 ($THOUSAND)
- FIGURE 42. TOP WINNING STRATEGIES, BY YEAR
- FIGURE 43. TOP WINNING STRATEGIES, BY DEVELOPMENT
- FIGURE 44. TOP WINNING STRATEGIES, BY COMPANY
- FIGURE 45. PRODUCT MAPPING OF TOP 10 PLAYERS
- FIGURE 46. COMPETITIVE DASHBOARD
- FIGURE 47. COMPETITIVE HEATMAP: SOLAR CHARGER MARKET
- FIGURE 48. TOP PLAYER POSITIONING, 2022
The global solar charger market was valued at $575 million in 2022, and is projected to reach $1,849 million by 2032, growing at a CAGR of 12.5% from 2023 to 2032.
Solar chargers harness sunlight to generate power for electronic devices such as smartphones and tablets. It comprises photovoltaic panels that convert solar energy into electricity and store it in batteries or are used for direct device charging. Designed for portability, solar chargers are ideal for outdoor activities, travel, and emergencies in areas lacking conventional power sources. They present a sustainable and eco-friendly solution, which reduces reliance on the grid and offers a convenient means of powering devices through renewable solar energy.
Surge in adoption of electric vehicles serves as a driver for the growth of the solar charger market. Rise in need for charging infrastructure driven by the popularity of electric vehicles may be met sustainably and decentralized by solar chargers. The market for solar chargers is expected to play a significant part in determining the direction of sustainable mobility, as environmental awareness, government assistance, and technological advances are propelling this shift.
Rise in awareness of the environmental benefits of converting from internal combustion engine vehicles to electric vehicles among customers, companies, and governments led to rise in the adoption of electric vehicles globally. However, expansion of EV use presents infrastructure-related problems, particularly in places where conventional power grids may not be able to support them. Owners of electric vehicles (EVs) may reduce their need on traditional power sources by employing solar chargers, which provide a decentralized and off-grid solution to this problem.
The rise in integration of solar panels directly into electric car designs is another way that solar energy and electric vehicles are related. Several manufacturers are incorporating solar panels into the body of electric automobiles to capture sunlight for additional electricity or to help in the vehicle's battery charge. This comprehensive strategy further promotes sustainable transportation by building an all-encompassing solar-powered ecosystem for electric vehicles with the help of external solar chargers. Thus, increase in adoption of EV vehicles is expected to drive the demand for solar chargers, leading to the market growth.
Development and widespread use of solar chargers are hampered by the intermittent nature of solar energy. The inconsistency of the sun owing to several factors like weather, time of day, and location presents natural problems for solar chargers, which depend on sunlight to generate electricity. The intermittent nature of solar chargers limits their capacity to operate consistently and dependably, thus affecting their suitability as the major or only power source for electronic devices.
The unpredictable nature of electricity generation is one of the main problems caused by solar energy's intermittent nature. As solar chargers rely primarily on sunlight to function, any type of obstacle, like clouds or shade, can drastically lower their effectiveness. It is difficult for consumers to rely entirely on solar chargers owing to this unpredictability, especially in areas with little sunlight or during bad weather.
The intermittent nature of solar energy is exacerbated by the daily and seasonal variations in sunlight. As the sun does not always shine during the day, solar chargers may operate less efficiently in the early morning, late afternoon, and at night. For consumers that depend on a steady and dependable power source, this variability in power generation may pose a serious challenge, particularly during times of peak energy consumption. Thus, the intermittent nature of solar energy restrains the growth of the solar charger market during the forecast period.
Decrease in solar panel costs presented an excellent growth opportunity for the solar charger market. The relatively high cost of solar panels was one of the main barriers to the broad use of solar technologies, particularly solar chargers. While the cost of solar panels decreased due to improved manufacturing techniques, economies of scale, and increased competition, the market for solar chargers has grown significantly.
The combination of market forces and advances in technology led to decrease in the cost of solar panels. The efficiency of solar cells significantly increased over time, which enables producers to create more electricity using fewer components.
Furthermore, advancements in production methods and materials have improved the solar panel manufacturing process's affordability and scalability. The cost per watt of solar power output significantly decreased as production costs have decreased and solar panel efficiency has increased, making solar chargers more accessible and affordable for a wider range of consumers. Thus, decrease in solar panel costs presented a lucrative growth opportunity for the solar charger market.
The solar charger market is segmented by type, solar panel type, application, and region. On the basis of type, the market is divided into portable and standalone. By solar panel type, the market is classified into fixed, folding, and flexible. Depending on application, it is categorized into consumer electronics, transportation, and others. Region-wise, the market is studied across North America, Europe, Asia-Pacific, and LAMEA.
The major players operating in the global solar charger market are Allpowers Industrial International, Goal Zero, letsolar, RAVPower, Renogy, Secur, Solar Frontier Europe GmbH, Solar Technology International, The NOCO Company, and YOLK.
Other players include Anker, BioLite Inc., Choetech Store, Hanergy Thin Film Power Group Europe, Little Sun, OUTXE, Suntrica, ToughTested, Voltaic Systems, and Xtorm.
Key Benefits For Stakeholders
- This report provides a quantitative analysis of the market segments, current trends, estimations, and dynamics of the solar charger market analysis from 2022 to 2032 to identify the prevailing solar charger market opportunities.
- The market research is offered along with information related to key drivers, restraints, and opportunities.
- Porter's five forces analysis highlights the potency of buyers and suppliers to enable stakeholders make profit-oriented business decisions and strengthen their supplier-buyer network.
- In-depth analysis of the solar charger market segmentation assists to determine the prevailing market opportunities.
- Major countries in each region are mapped according to their revenue contribution to the global market.
- Market player positioning facilitates benchmarking and provides a clear understanding of the present position of the market players.
- The report includes the analysis of the regional as well as global solar charger market trends, key players, market segments, application areas, and market growth strategies.
Additional benefits you will get with this purchase are:
- Quarterly Update and* (only available with a corporate license, on listed price)
- 5 additional Company Profile of client Choice pre- or Post-purchase, as a free update.
- Free Upcoming Version on the Purchase of Five and Enterprise User License.
- 16 analyst hours of support* (post-purchase, if you find additional data requirements upon review of the report, you may receive support amounting to 16 analyst hours to solve questions, and post-sale queries)
- 15% Free Customization* (in case the scope or segment of the report does not match your requirements, 15% is equivalent to 3 working days of free work, applicable once)
- Free data Pack on the Five and Enterprise User License. (Excel version of the report)
- Free Updated report if the report is 6-12 months old or older.
- 24-hour priority response*
- Free Industry updates and white papers.
Possible Customization with this report (with additional cost and timeline, please talk to the sales executive to know more)
- Product Benchmarking / Product specification and applications
- Product Life Cycles
- Supply Chain Analysis & Vendor Margins
- Upcoming/New Entrant by Regions
- Average Consumer Expenditure
- Market share analysis of players by products/segments
- New Product Development/ Product Matrix of Key Players
- Regulatory Guidelines
- Additional company profiles with specific to client's interest
- Additional country or region analysis- market size and forecast
- Average Selling Price Analysis / Price Point Analysis
- Expanded list for Company Profiles
- Historic market data
- Market share analysis of players at global/region/country level
- SWOT Analysis
Key Market Segments
By Type
- Portable
- Standalone
By Solar Panel Type
- Folding
- Fixed
- Flexible
By Application
- Consumer Electronics
- Transportation
- Others
By Region
- North America
- U.S.
- Canada
- Mexico
- Europe
- Germany
- UK
- France
- Italy
- Spain
- Rest of Europe
- Asia-Pacific
- China
- Japan
- India
- South Korea
- Australia
- Rest of Asia-Pacific
- LAMEA
- Brazil
- South Africa
- Saudi Arabia
- Rest of LAMEA
Key Market Players:
- Goal Zero
- Allpowers Industrial International
- letsolar
- RAVPower
- renogy-solar
- Secur.
- Solar Frontier Europe GmbH
- Solar Technology International
- the noco company
- yolk
TABLE OF CONTENTS
CHAPTER 1: INTRODUCTION
- 1.1. Report description
- 1.2. Key market segments
- 1.3. Key benefits to the stakeholders
- 1.4. Research methodology
- 1.4.1. Primary research
- 1.4.2. Secondary research
- 1.4.3. Analyst tools and models
CHAPTER 2: EXECUTIVE SUMMARY
- 2.1. CXO Perspective
CHAPTER 3: MARKET OVERVIEW
- 3.1. Market definition and scope
- 3.2. Key findings
- 3.2.1. Top impacting factors
- 3.2.2. Top investment pockets
- 3.3. Porter's five forces analysis
- 3.4. Market dynamics
- 3.4.1. Drivers
- 3.4.2. Restraints
- 3.4.3. Opportunities
- 3.5. Value Chain Analysis
CHAPTER 4: SOLAR CHARGER MARKET, BY TYPE
- 4.1. Overview
- 4.1.1. Market size and forecast
- 4.2. Portable
- 4.2.1. Key market trends, growth factors and opportunities
- 4.2.2. Market size and forecast, by region
- 4.2.3. Market share analysis by country
- 4.3. Standalone
- 4.3.1. Key market trends, growth factors and opportunities
- 4.3.2. Market size and forecast, by region
- 4.3.3. Market share analysis by country
CHAPTER 5: SOLAR CHARGER MARKET, BY SOLAR PANEL TYPE
- 5.1. Overview
- 5.1.1. Market size and forecast
- 5.2. Folding
- 5.2.1. Key market trends, growth factors and opportunities
- 5.2.2. Market size and forecast, by region
- 5.2.3. Market share analysis by country
- 5.3. Fixed
- 5.3.1. Key market trends, growth factors and opportunities
- 5.3.2. Market size and forecast, by region
- 5.3.3. Market share analysis by country
- 5.4. Flexible
- 5.4.1. Key market trends, growth factors and opportunities
- 5.4.2. Market size and forecast, by region
- 5.4.3. Market share analysis by country
CHAPTER 6: SOLAR CHARGER MARKET, BY APPLICATION
- 6.1. Overview
- 6.1.1. Market size and forecast
- 6.2. Consumer Electronics
- 6.2.1. Key market trends, growth factors and opportunities
- 6.2.2. Market size and forecast, by region
- 6.2.3. Market share analysis by country
- 6.3. Transportation
- 6.3.1. Key market trends, growth factors and opportunities
- 6.3.2. Market size and forecast, by region
- 6.3.3. Market share analysis by country
- 6.4. Others
- 6.4.1. Key market trends, growth factors and opportunities
- 6.4.2. Market size and forecast, by region
- 6.4.3. Market share analysis by country
CHAPTER 7: SOLAR CHARGER MARKET, BY REGION
- 7.1. Overview
- 7.1.1. Market size and forecast By Region
- 7.2. North America
- 7.2.1. Key market trends, growth factors and opportunities
- 7.2.2. Market size and forecast, by Type
- 7.2.3. Market size and forecast, by Solar Panel Type
- 7.2.4. Market size and forecast, by Application
- 7.2.5. Market size and forecast, by country
- 7.2.5.1. U.S.
- 7.2.5.1.1. Market size and forecast, by Type
- 7.2.5.1.2. Market size and forecast, by Solar Panel Type
- 7.2.5.1.3. Market size and forecast, by Application
- 7.2.5.2. Canada
- 7.2.5.2.1. Market size and forecast, by Type
- 7.2.5.2.2. Market size and forecast, by Solar Panel Type
- 7.2.5.2.3. Market size and forecast, by Application
- 7.2.5.3. Mexico
- 7.2.5.3.1. Market size and forecast, by Type
- 7.2.5.3.2. Market size and forecast, by Solar Panel Type
- 7.2.5.3.3. Market size and forecast, by Application
- 7.3. Europe
- 7.3.1. Key market trends, growth factors and opportunities
- 7.3.2. Market size and forecast, by Type
- 7.3.3. Market size and forecast, by Solar Panel Type
- 7.3.4. Market size and forecast, by Application
- 7.3.5. Market size and forecast, by country
- 7.3.5.1. Germany
- 7.3.5.1.1. Market size and forecast, by Type
- 7.3.5.1.2. Market size and forecast, by Solar Panel Type
- 7.3.5.1.3. Market size and forecast, by Application
- 7.3.5.2. UK
- 7.3.5.2.1. Market size and forecast, by Type
- 7.3.5.2.2. Market size and forecast, by Solar Panel Type
- 7.3.5.2.3. Market size and forecast, by Application
- 7.3.5.3. France
- 7.3.5.3.1. Market size and forecast, by Type
- 7.3.5.3.2. Market size and forecast, by Solar Panel Type
- 7.3.5.3.3. Market size and forecast, by Application
- 7.3.5.4. Italy
- 7.3.5.4.1. Market size and forecast, by Type
- 7.3.5.4.2. Market size and forecast, by Solar Panel Type
- 7.3.5.4.3. Market size and forecast, by Application
- 7.3.5.5. Spain
- 7.3.5.5.1. Market size and forecast, by Type
- 7.3.5.5.2. Market size and forecast, by Solar Panel Type
- 7.3.5.5.3. Market size and forecast, by Application
- 7.3.5.6. Rest of Europe
- 7.3.5.6.1. Market size and forecast, by Type
- 7.3.5.6.2. Market size and forecast, by Solar Panel Type
- 7.3.5.6.3. Market size and forecast, by Application
- 7.4. Asia-Pacific
- 7.4.1. Key market trends, growth factors and opportunities
- 7.4.2. Market size and forecast, by Type
- 7.4.3. Market size and forecast, by Solar Panel Type
- 7.4.4. Market size and forecast, by Application
- 7.4.5. Market size and forecast, by country
- 7.4.5.1. China
- 7.4.5.1.1. Market size and forecast, by Type
- 7.4.5.1.2. Market size and forecast, by Solar Panel Type
- 7.4.5.1.3. Market size and forecast, by Application
- 7.4.5.2. Japan
- 7.4.5.2.1. Market size and forecast, by Type
- 7.4.5.2.2. Market size and forecast, by Solar Panel Type
- 7.4.5.2.3. Market size and forecast, by Application
- 7.4.5.3. India
- 7.4.5.3.1. Market size and forecast, by Type
- 7.4.5.3.2. Market size and forecast, by Solar Panel Type
- 7.4.5.3.3. Market size and forecast, by Application
- 7.4.5.4. South Korea
- 7.4.5.4.1. Market size and forecast, by Type
- 7.4.5.4.2. Market size and forecast, by Solar Panel Type
- 7.4.5.4.3. Market size and forecast, by Application
- 7.4.5.5. Australia
- 7.4.5.5.1. Market size and forecast, by Type
- 7.4.5.5.2. Market size and forecast, by Solar Panel Type
- 7.4.5.5.3. Market size and forecast, by Application
- 7.4.5.6. Rest of Asia-Pacific
- 7.4.5.6.1. Market size and forecast, by Type
- 7.4.5.6.2. Market size and forecast, by Solar Panel Type
- 7.4.5.6.3. Market size and forecast, by Application
- 7.5. LAMEA
- 7.5.1. Key market trends, growth factors and opportunities
- 7.5.2. Market size and forecast, by Type
- 7.5.3. Market size and forecast, by Solar Panel Type
- 7.5.4. Market size and forecast, by Application
- 7.5.5. Market size and forecast, by country
- 7.5.5.1. Brazil
- 7.5.5.1.1. Market size and forecast, by Type
- 7.5.5.1.2. Market size and forecast, by Solar Panel Type
- 7.5.5.1.3. Market size and forecast, by Application
- 7.5.5.2. South Africa
- 7.5.5.2.1. Market size and forecast, by Type
- 7.5.5.2.2. Market size and forecast, by Solar Panel Type
- 7.5.5.2.3. Market size and forecast, by Application
- 7.5.5.3. Saudi Arabia
- 7.5.5.3.1. Market size and forecast, by Type
- 7.5.5.3.2. Market size and forecast, by Solar Panel Type
- 7.5.5.3.3. Market size and forecast, by Application
- 7.5.5.4. Rest of LAMEA
- 7.5.5.4.1. Market size and forecast, by Type
- 7.5.5.4.2. Market size and forecast, by Solar Panel Type
- 7.5.5.4.3. Market size and forecast, by Application
CHAPTER 8: COMPETITIVE LANDSCAPE
- 8.1. Introduction
- 8.2. Top winning strategies
- 8.3. Product mapping of top 10 player
- 8.4. Competitive dashboard
- 8.5. Competitive heatmap
- 8.6. Top player positioning, 2022
CHAPTER 9: COMPANY PROFILES
- 9.1. Goal Zero
- 9.1.1. Company overview
- 9.1.2. Key executives
- 9.1.3. Company snapshot
- 9.1.4. Operating business segments
- 9.1.5. Product portfolio
- 9.1.6. Business performance
- 9.1.7. Key strategic moves and developments
- 9.2. Allpowers Industrial International
- 9.2.1. Company overview
- 9.2.2. Key executives
- 9.2.3. Company snapshot
- 9.2.4. Operating business segments
- 9.2.5. Product portfolio
- 9.2.6. Business performance
- 9.2.7. Key strategic moves and developments
- 9.3. letsolar
- 9.3.1. Company overview
- 9.3.2. Key executives
- 9.3.3. Company snapshot
- 9.3.4. Operating business segments
- 9.3.5. Product portfolio
- 9.3.6. Business performance
- 9.3.7. Key strategic moves and developments
- 9.4. RAVPower
- 9.4.1. Company overview
- 9.4.2. Key executives
- 9.4.3. Company snapshot
- 9.4.4. Operating business segments
- 9.4.5. Product portfolio
- 9.4.6. Business performance
- 9.4.7. Key strategic moves and developments
- 9.5. renogy-solar
- 9.5.1. Company overview
- 9.5.2. Key executives
- 9.5.3. Company snapshot
- 9.5.4. Operating business segments
- 9.5.5. Product portfolio
- 9.5.6. Business performance
- 9.5.7. Key strategic moves and developments
- 9.6. Secur.
- 9.6.1. Company overview
- 9.6.2. Key executives
- 9.6.3. Company snapshot
- 9.6.4. Operating business segments
- 9.6.5. Product portfolio
- 9.6.6. Business performance
- 9.6.7. Key strategic moves and developments
- 9.7. Solar Frontier Europe GmbH
- 9.7.1. Company overview
- 9.7.2. Key executives
- 9.7.3. Company snapshot
- 9.7.4. Operating business segments
- 9.7.5. Product portfolio
- 9.7.6. Business performance
- 9.7.7. Key strategic moves and developments
- 9.8. Solar Technology International
- 9.8.1. Company overview
- 9.8.2. Key executives
- 9.8.3. Company snapshot
- 9.8.4. Operating business segments
- 9.8.5. Product portfolio
- 9.8.6. Business performance
- 9.8.7. Key strategic moves and developments
- 9.9. the noco company
- 9.9.1. Company overview
- 9.9.2. Key executives
- 9.9.3. Company snapshot
- 9.9.4. Operating business segments
- 9.9.5. Product portfolio
- 9.9.6. Business performance
- 9.9.7. Key strategic moves and developments
- 9.10. yolk
- 9.10.1. Company overview
- 9.10.2. Key executives
- 9.10.3. Company snapshot
- 9.10.4. Operating business segments
- 9.10.5. Product portfolio
- 9.10.6. Business performance
- 9.10.7. Key strategic moves and developments
