|
|
市場調査レポート
商品コード
1414847
水素貯蔵の世界市場:タイプ別、貯蔵別、最終用途産業別 - 機会分析・産業予測、2023~2032年Hydrogen Storage Market By Type, By Storage, By End-use Industry : Global Opportunity Analysis and Industry Forecast, 2023-2032 |
||||||
|
|
|||||||
|
|||||||


| 水素貯蔵の世界市場:タイプ別、貯蔵別、最終用途産業別 - 機会分析・産業予測、2023~2032年 |
|
出版日: 2023年11月30日
発行: Allied Market Research
ページ情報: 英文 270 Pages
納期: 2~3営業日
|

- 全表示
- 概要
- 図表
- 目次
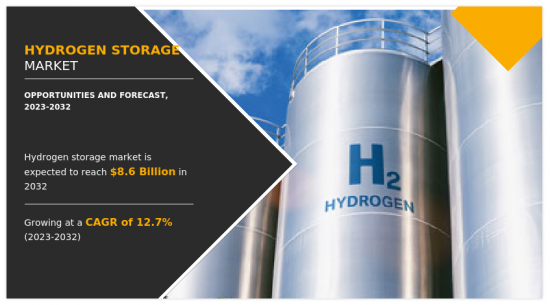
世界の水素貯蔵の市場規模は、2022年に28億米ドルに達し、2023~2032年にかけてCAGR 12.7%で成長し、2032年には86億米ドルに達すると予測されています。
水素貯蔵システムとは、水素を安全かつ効率的に貯蔵するために必要な技術やインフラの開発、製造、流通に関わる産業を指します。水素貯蔵システムは、様々な用途で水素をエネルギーキャリアとして利用できるようにする上で重要な役割を果たしています。水素エネルギー貯蔵には、以下のような幅広い貯蔵技術とソリューションが含まれます。
1.圧縮ガス貯蔵、液体貯蔵、金属・化学水素化物貯蔵、固体貯蔵。
グリーンエネルギーソリューションへの関心の高まりは、より持続可能なエネルギーの未来への移行に不可欠な要素であると多くの人が考えるシリンダー式水素貯蔵への需要の急増につながっています。世界が化石燃料からの脱却を積極的に進める中、未来の燃料と称される水素は、その高いエネルギー含有量とクリーンな燃焼特性により、製品別として水しか生成しないことから脚光を浴びています。その結果、水素の効果的な貯蔵・輸送メカニズムがますます重要になってきており、圧縮水素ボンベが、いくつかの理由から一般的な選択肢として浮上しています。
第一に、水素ボンベは他の多くの貯蔵方法とは比較にならないほど可搬性が高く、輸送や交換が容易なため、さまざまな分野や場所での流通が容易になります。さらに、この貯蔵方式を支える技術は成熟しており、長年にわたってさまざまな用途で使用されてきた実績があるため、新しい技術にはない信頼性と親しみやすさがあります。さらに、車両の燃料補給からバックアップ電源まで、さまざまな用途に適応できるシリンダー貯蔵の汎用性は、企業にとっても政府にとっても魅力的な選択肢となっています。同時に、ボンベの使用量が増加するにつれて、安全な取り扱い、保管、輸送への取り組みが確実になるよう、安全プロトコルの規則化が業界全体で推進されています。
しかし、最も一般的な貯蔵方法は、水素を圧縮し、通常350~700バール(5,000~10,000psi)の高圧下で貯蔵することです。このような圧力に耐えるためには、タンクは非常に頑丈でなければならないため、通常、以下のような高強度複合材料を使って作られます。
1.高価な炭素繊維。これらの高圧タンクの製造は一筋縄ではいかないです。特殊な製造工程、精密工学、品質管理が必要で、これらすべてがコスト上昇の原因となっています。より効率的で費用対効果の高い水素貯蔵ソリューションの発見に向けて、以下のような研究が進められています。
1)金属水素化物または化学貯蔵。研究開発への投資は、将来のブレークスルーのために不可欠ではあるが、現在の貯蔵ソリューションにしばしば反映される初期コストが追加されます。
水素貯蔵タンクの高いコストに対処することは、特に以下のような用途において、水素技術を広く受け入れ、展開するために不可欠です。
1.車内貯蔵スペースとコストが重要な考慮事項である輸送。水素補給インフラの利用可能性が限られていることは、クリーンエネルギーキャリアとしての水素の大量導入、特に運輸セクターにおける大きな課題となっています。
特に、どこにでもあるガソリンスタンドや、電気自動車の充電ポイントの増加に比べれば、水素は排出ガスやエネルギー密度の面で大きなメリットがあるにもかかわらず、燃料補給ステーションの不足は、潜在的なユーザーにとって利便性を低下させる。水素燃料電池車(FCV)の潜在的な購入者は、長時間の移動中や遠隔地での燃料補給が可能かどうか心配になり、購入をためらうかもしれないです。
それとは逆に、水素貯蔵タンクの軽量化は、特に輸送セクターにおいて、実行可能なエネルギー・キャリアとしての水素の進歩にとって重要な分野です。貯蔵ソリューションの重量は、自動車の効率、航続距離、総合性能に直接影響します。従来の高圧水素貯蔵タンクは、その強度対重量比から、主に炭素繊維複合材料を利用しています。これらの複合材料の特性を向上させ、安全性を損なうことなくタンク壁の薄肉化・軽量化を可能にするための研究が進められています。
これらの化学化合物は水素を吸収・放出し、より低い圧力で水素を貯蔵する方法を提供するため、タンクの重量を減らせる可能性があります。科学者たちは、高い貯蔵容量を持つ軽量の金属水素化物の研究を積極的に進めています。これらの化学化合物は水素を吸収・放出することができ、水素をより低い圧力で貯蔵する方法を提供するため、タンクの重量を軽減できる可能性があります。以下のような材料があります。
1)有機金属骨格(MOF)や共有結合有機骨格(COF)が有望視されています。これらの構造は、水素を高圧にすることなく、水素分子を高密度に捕捉することができるため、タンクの重量を軽減できる可能性があります。自動車産業は効率と総合性能を高めるために車両の軽量化に注力しているため、低重量の水素貯蔵タンクの開発は、自動車産業における水素貯蔵タンクに有利な機会をもたらすと思われます。
目次
第1章 イントロダクション
第2章 エグゼクティブサマリー
第3章 市場概要
- 市場の定義と範囲
- 主要調査結果
- 影響要因
- 主要投資機会
- ポーターのファイブフォース分析
- 市場力学
- 促進要因
- 低公害燃料に対する需要の増加
- 様々な産業からの需要の増加
- 抑制要因
- 複合材料ベースタンクのコスト高
- 機会
- 低重量の水素貯蔵タンクの開発
- 促進要因
- バリューチェーン分析
- 特許情勢
第4章 水素貯蔵市場:タイプ別
- 概要
- シリンダー
- マーチャント/バルク
- オンサイト
- オンボード
第5章 水素貯蔵市場:貯蔵別
- 概要
- 材料
- 物理
第6章 水素貯蔵市場:最終用途産業別
- 概要
- 化学
- 石油精製
- 自動車・輸送
- 金属加工
- その他
第7章 水素貯蔵市場:地域別
- 概要
- 北米
- 米国
- カナダ
- メキシコ
- 欧州
- ドイツ
- フランス
- 英国
- スペイン
- イタリア
- その他の欧州
- アジア太平洋
- 中国
- 日本
- インド
- 韓国
- オーストラリア
- その他のアジア太平洋
- ラテンアメリカ、中東・アフリカ
- ブラジル
- サウジアラビア
- 南アフリカ
- その他のラテンアメリカ、中東・アフリカ
第8章 競合情勢
- イントロダクション
- 主要成功戦略
- 主要10社の製品マッピング
- 競合ダッシュボード
- 競合ヒートマップ
- 主要企業のポジショニング、2022年
第9章 企業プロファイル
- Air Liquide
- Linde Plc
- Worthington Industries Inc.
- Luxfer Holdings PLC
- Hexagon Composites ASA
- Chart Industries, Inc.
- inoxcva
- HBank Technologies Inc.
- Pragma Industries
- Steelhead Composites, Inc.
LIST OF TABLES
- TABLE 01. GLOBAL HYDROGEN STORAGE MARKET, BY TYPE, 2022-2032 ($MILLION)
- TABLE 02. HYDROGEN STORAGE MARKET FOR CYLINDER, BY REGION, 2022-2032 ($MILLION)
- TABLE 03. HYDROGEN STORAGE MARKET FOR MERCHANT/BULK, BY REGION, 2022-2032 ($MILLION)
- TABLE 04. HYDROGEN STORAGE MARKET FOR ON-SITE, BY REGION, 2022-2032 ($MILLION)
- TABLE 05. HYDROGEN STORAGE MARKET FOR ON-BOARD, BY REGION, 2022-2032 ($MILLION)
- TABLE 06. GLOBAL HYDROGEN STORAGE MARKET, BY STORAGE, 2022-2032 ($MILLION)
- TABLE 07. HYDROGEN STORAGE MARKET FOR MATERIAL, BY REGION, 2022-2032 ($MILLION)
- TABLE 08. HYDROGEN STORAGE MARKET FOR PHYSICAL, BY REGION, 2022-2032 ($MILLION)
- TABLE 09. GLOBAL HYDROGEN STORAGE MARKET, BY END-USE INDUSTRY, 2022-2032 ($MILLION)
- TABLE 10. HYDROGEN STORAGE MARKET FOR CHEMICAL, BY REGION, 2022-2032 ($MILLION)
- TABLE 11. HYDROGEN STORAGE MARKET FOR OIL REFINERIES, BY REGION, 2022-2032 ($MILLION)
- TABLE 12. HYDROGEN STORAGE MARKET FOR AUTOMOTIVE AND TRANSPORTATION, BY REGION, 2022-2032 ($MILLION)
- TABLE 13. HYDROGEN STORAGE MARKET FOR METALWORKING, BY REGION, 2022-2032 ($MILLION)
- TABLE 14. HYDROGEN STORAGE MARKET FOR OTHERS, BY REGION, 2022-2032 ($MILLION)
- TABLE 15. HYDROGEN STORAGE MARKET, BY REGION, 2022-2032 ($MILLION)
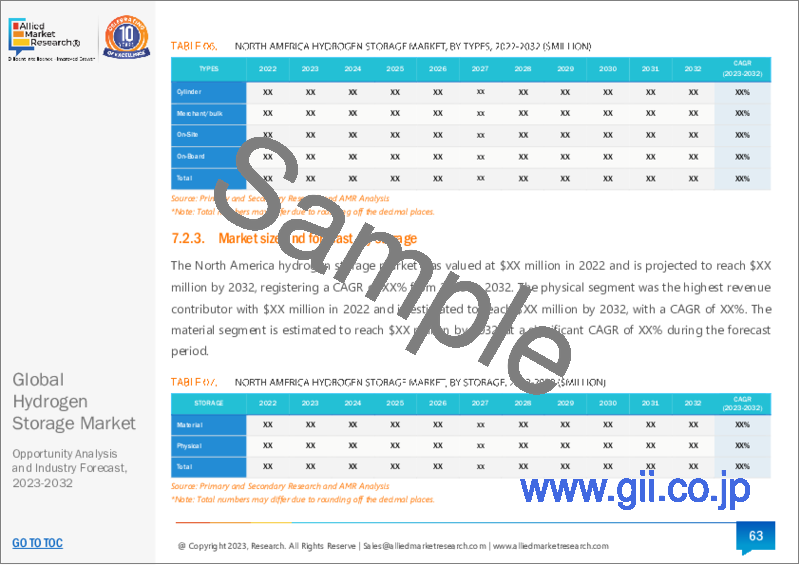
- TABLE 16. NORTH AMERICA HYDROGEN STORAGE MARKET, BY TYPE, 2022-2032 ($MILLION)
- TABLE 17. NORTH AMERICA HYDROGEN STORAGE MARKET, BY STORAGE, 2022-2032 ($MILLION)
- TABLE 18. NORTH AMERICA HYDROGEN STORAGE MARKET, BY END-USE INDUSTRY, 2022-2032 ($MILLION)
- TABLE 19. NORTH AMERICA HYDROGEN STORAGE MARKET, BY COUNTRY, 2022-2032 ($MILLION)
- TABLE 20. U.S. HYDROGEN STORAGE MARKET, BY TYPE, 2022-2032 ($MILLION)
- TABLE 21. U.S. HYDROGEN STORAGE MARKET, BY STORAGE, 2022-2032 ($MILLION)
- TABLE 22. U.S. HYDROGEN STORAGE MARKET, BY END-USE INDUSTRY, 2022-2032 ($MILLION)
- TABLE 23. CANADA HYDROGEN STORAGE MARKET, BY TYPE, 2022-2032 ($MILLION)
- TABLE 24. CANADA HYDROGEN STORAGE MARKET, BY STORAGE, 2022-2032 ($MILLION)
- TABLE 25. CANADA HYDROGEN STORAGE MARKET, BY END-USE INDUSTRY, 2022-2032 ($MILLION)
- TABLE 26. MEXICO HYDROGEN STORAGE MARKET, BY TYPE, 2022-2032 ($MILLION)
- TABLE 27. MEXICO HYDROGEN STORAGE MARKET, BY STORAGE, 2022-2032 ($MILLION)
- TABLE 28. MEXICO HYDROGEN STORAGE MARKET, BY END-USE INDUSTRY, 2022-2032 ($MILLION)
- TABLE 29. EUROPE HYDROGEN STORAGE MARKET, BY TYPE, 2022-2032 ($MILLION)
- TABLE 30. EUROPE HYDROGEN STORAGE MARKET, BY STORAGE, 2022-2032 ($MILLION)
- TABLE 31. EUROPE HYDROGEN STORAGE MARKET, BY END-USE INDUSTRY, 2022-2032 ($MILLION)
- TABLE 32. EUROPE HYDROGEN STORAGE MARKET, BY COUNTRY, 2022-2032 ($MILLION)
- TABLE 33. GERMANY HYDROGEN STORAGE MARKET, BY TYPE, 2022-2032 ($MILLION)
- TABLE 34. GERMANY HYDROGEN STORAGE MARKET, BY STORAGE, 2022-2032 ($MILLION)
- TABLE 35. GERMANY HYDROGEN STORAGE MARKET, BY END-USE INDUSTRY, 2022-2032 ($MILLION)
- TABLE 36. FRANCE HYDROGEN STORAGE MARKET, BY TYPE, 2022-2032 ($MILLION)
- TABLE 37. FRANCE HYDROGEN STORAGE MARKET, BY STORAGE, 2022-2032 ($MILLION)
- TABLE 38. FRANCE HYDROGEN STORAGE MARKET, BY END-USE INDUSTRY, 2022-2032 ($MILLION)
- TABLE 39. UK HYDROGEN STORAGE MARKET, BY TYPE, 2022-2032 ($MILLION)
- TABLE 40. UK HYDROGEN STORAGE MARKET, BY STORAGE, 2022-2032 ($MILLION)
- TABLE 41. UK HYDROGEN STORAGE MARKET, BY END-USE INDUSTRY, 2022-2032 ($MILLION)
- TABLE 42. SPAIN HYDROGEN STORAGE MARKET, BY TYPE, 2022-2032 ($MILLION)
- TABLE 43. SPAIN HYDROGEN STORAGE MARKET, BY STORAGE, 2022-2032 ($MILLION)
- TABLE 44. SPAIN HYDROGEN STORAGE MARKET, BY END-USE INDUSTRY, 2022-2032 ($MILLION)
- TABLE 45. ITALY HYDROGEN STORAGE MARKET, BY TYPE, 2022-2032 ($MILLION)
- TABLE 46. ITALY HYDROGEN STORAGE MARKET, BY STORAGE, 2022-2032 ($MILLION)
- TABLE 47. ITALY HYDROGEN STORAGE MARKET, BY END-USE INDUSTRY, 2022-2032 ($MILLION)
- TABLE 48. REST OF EUROPE HYDROGEN STORAGE MARKET, BY TYPE, 2022-2032 ($MILLION)
- TABLE 49. REST OF EUROPE HYDROGEN STORAGE MARKET, BY STORAGE, 2022-2032 ($MILLION)
- TABLE 50. REST OF EUROPE HYDROGEN STORAGE MARKET, BY END-USE INDUSTRY, 2022-2032 ($MILLION)
- TABLE 51. ASIA-PACIFIC HYDROGEN STORAGE MARKET, BY TYPE, 2022-2032 ($MILLION)
- TABLE 52. ASIA-PACIFIC HYDROGEN STORAGE MARKET, BY STORAGE, 2022-2032 ($MILLION)
- TABLE 53. ASIA-PACIFIC HYDROGEN STORAGE MARKET, BY END-USE INDUSTRY, 2022-2032 ($MILLION)
- TABLE 54. ASIA-PACIFIC HYDROGEN STORAGE MARKET, BY COUNTRY, 2022-2032 ($MILLION)
- TABLE 55. CHINA HYDROGEN STORAGE MARKET, BY TYPE, 2022-2032 ($MILLION)
- TABLE 56. CHINA HYDROGEN STORAGE MARKET, BY STORAGE, 2022-2032 ($MILLION)
- TABLE 57. CHINA HYDROGEN STORAGE MARKET, BY END-USE INDUSTRY, 2022-2032 ($MILLION)
- TABLE 58. JAPAN HYDROGEN STORAGE MARKET, BY TYPE, 2022-2032 ($MILLION)
- TABLE 59. JAPAN HYDROGEN STORAGE MARKET, BY STORAGE, 2022-2032 ($MILLION)
- TABLE 60. JAPAN HYDROGEN STORAGE MARKET, BY END-USE INDUSTRY, 2022-2032 ($MILLION)
- TABLE 61. INDIA HYDROGEN STORAGE MARKET, BY TYPE, 2022-2032 ($MILLION)
- TABLE 62. INDIA HYDROGEN STORAGE MARKET, BY STORAGE, 2022-2032 ($MILLION)
- TABLE 63. INDIA HYDROGEN STORAGE MARKET, BY END-USE INDUSTRY, 2022-2032 ($MILLION)
- TABLE 64. SOUTH KOREA HYDROGEN STORAGE MARKET, BY TYPE, 2022-2032 ($MILLION)
- TABLE 65. SOUTH KOREA HYDROGEN STORAGE MARKET, BY STORAGE, 2022-2032 ($MILLION)
- TABLE 66. SOUTH KOREA HYDROGEN STORAGE MARKET, BY END-USE INDUSTRY, 2022-2032 ($MILLION)
- TABLE 67. AUSTRALIA HYDROGEN STORAGE MARKET, BY TYPE, 2022-2032 ($MILLION)
- TABLE 68. AUSTRALIA HYDROGEN STORAGE MARKET, BY STORAGE, 2022-2032 ($MILLION)
- TABLE 69. AUSTRALIA HYDROGEN STORAGE MARKET, BY END-USE INDUSTRY, 2022-2032 ($MILLION)
- TABLE 70. REST OF ASIA-PACIFIC HYDROGEN STORAGE MARKET, BY TYPE, 2022-2032 ($MILLION)
- TABLE 71. REST OF ASIA-PACIFIC HYDROGEN STORAGE MARKET, BY STORAGE, 2022-2032 ($MILLION)
- TABLE 72. REST OF ASIA-PACIFIC HYDROGEN STORAGE MARKET, BY END-USE INDUSTRY, 2022-2032 ($MILLION)
- TABLE 73. LAMEA HYDROGEN STORAGE MARKET, BY TYPE, 2022-2032 ($MILLION)
- TABLE 74. LAMEA HYDROGEN STORAGE MARKET, BY STORAGE, 2022-2032 ($MILLION)
- TABLE 75. LAMEA HYDROGEN STORAGE MARKET, BY END-USE INDUSTRY, 2022-2032 ($MILLION)
- TABLE 76. LAMEA HYDROGEN STORAGE MARKET, BY COUNTRY, 2022-2032 ($MILLION)
- TABLE 77. BRAZIL HYDROGEN STORAGE MARKET, BY TYPE, 2022-2032 ($MILLION)
- TABLE 78. BRAZIL HYDROGEN STORAGE MARKET, BY STORAGE, 2022-2032 ($MILLION)
- TABLE 79. BRAZIL HYDROGEN STORAGE MARKET, BY END-USE INDUSTRY, 2022-2032 ($MILLION)
- TABLE 80. SAUDI ARABIA HYDROGEN STORAGE MARKET, BY TYPE, 2022-2032 ($MILLION)
- TABLE 81. SAUDI ARABIA HYDROGEN STORAGE MARKET, BY STORAGE, 2022-2032 ($MILLION)
- TABLE 82. SAUDI ARABIA HYDROGEN STORAGE MARKET, BY END-USE INDUSTRY, 2022-2032 ($MILLION)
- TABLE 83. SOUTH AFRICA HYDROGEN STORAGE MARKET, BY TYPE, 2022-2032 ($MILLION)
- TABLE 84. SOUTH AFRICA HYDROGEN STORAGE MARKET, BY STORAGE, 2022-2032 ($MILLION)
- TABLE 85. SOUTH AFRICA HYDROGEN STORAGE MARKET, BY END-USE INDUSTRY, 2022-2032 ($MILLION)
- TABLE 86. REST OF LAMEA HYDROGEN STORAGE MARKET, BY TYPE, 2022-2032 ($MILLION)
- TABLE 87. REST OF LAMEA HYDROGEN STORAGE MARKET, BY STORAGE, 2022-2032 ($MILLION)
- TABLE 88. REST OF LAMEA HYDROGEN STORAGE MARKET, BY END-USE INDUSTRY, 2022-2032 ($MILLION)
- TABLE 89. AIR LIQUIDE: KEY EXECUTIVES
- TABLE 90. AIR LIQUIDE: COMPANY SNAPSHOT
- TABLE 91. AIR LIQUIDE: PRODUCT SEGMENTS
- TABLE 92. AIR LIQUIDE: PRODUCT PORTFOLIO
- TABLE 93. LINDE PLC: KEY EXECUTIVES
- TABLE 94. LINDE PLC: COMPANY SNAPSHOT
- TABLE 95. LINDE PLC: PRODUCT SEGMENTS
- TABLE 96. LINDE PLC: PRODUCT PORTFOLIO
- TABLE 97. WORTHINGTON INDUSTRIES INC.: KEY EXECUTIVES
- TABLE 98. WORTHINGTON INDUSTRIES INC.: COMPANY SNAPSHOT
- TABLE 99. WORTHINGTON INDUSTRIES INC.: PRODUCT SEGMENTS
- TABLE 100. WORTHINGTON INDUSTRIES INC.: PRODUCT PORTFOLIO
- TABLE 101. LUXFER HOLDINGS PLC: KEY EXECUTIVES
- TABLE 102. LUXFER HOLDINGS PLC: COMPANY SNAPSHOT
- TABLE 103. LUXFER HOLDINGS PLC: PRODUCT SEGMENTS
- TABLE 104. LUXFER HOLDINGS PLC: PRODUCT PORTFOLIO
- TABLE 105. HEXAGON COMPOSITES ASA: KEY EXECUTIVES
- TABLE 106. HEXAGON COMPOSITES ASA: COMPANY SNAPSHOT
- TABLE 107. HEXAGON COMPOSITES ASA: PRODUCT SEGMENTS
- TABLE 108. HEXAGON COMPOSITES ASA: PRODUCT PORTFOLIO
- TABLE 109. CHART INDUSTRIES, INC.: KEY EXECUTIVES
- TABLE 110. CHART INDUSTRIES, INC.: COMPANY SNAPSHOT
- TABLE 111. CHART INDUSTRIES, INC.: PRODUCT SEGMENTS
- TABLE 112. CHART INDUSTRIES, INC.: PRODUCT PORTFOLIO
- TABLE 113. INOXCVA: KEY EXECUTIVES
- TABLE 114. INOXCVA: COMPANY SNAPSHOT
- TABLE 115. INOXCVA: PRODUCT SEGMENTS
- TABLE 116. INOXCVA: PRODUCT PORTFOLIO
- TABLE 117. HBANK TECHNOLOGIES INC.: KEY EXECUTIVES
- TABLE 118. HBANK TECHNOLOGIES INC.: COMPANY SNAPSHOT
- TABLE 119. HBANK TECHNOLOGIES INC.: PRODUCT SEGMENTS
- TABLE 120. HBANK TECHNOLOGIES INC.: PRODUCT PORTFOLIO
- TABLE 121. PRAGMA INDUSTRIES: KEY EXECUTIVES
- TABLE 122. PRAGMA INDUSTRIES: COMPANY SNAPSHOT
- TABLE 123. PRAGMA INDUSTRIES: PRODUCT SEGMENTS
- TABLE 124. PRAGMA INDUSTRIES: PRODUCT PORTFOLIO
- TABLE 125. STEELHEAD COMPOSITES, INC.: KEY EXECUTIVES
- TABLE 126. STEELHEAD COMPOSITES, INC.: COMPANY SNAPSHOT
- TABLE 127. STEELHEAD COMPOSITES, INC.: PRODUCT SEGMENTS
- TABLE 128. STEELHEAD COMPOSITES, INC.: PRODUCT PORTFOLIO
LIST OF FIGURES
- FIGURE 01. HYDROGEN STORAGE MARKET, 2022-2032
- FIGURE 02. SEGMENTATION OF HYDROGEN STORAGE MARKET,2022-2032
- FIGURE 03. TOP IMPACTING FACTORS IN HYDROGEN STORAGE MARKET (2022 TO 2032)
- FIGURE 04. TOP INVESTMENT POCKETS IN HYDROGEN STORAGE MARKET (2023-2032)
- FIGURE 05. LOW BARGAINING POWER OF SUPPLIERS
- FIGURE 06. LOW THREAT OF NEW ENTRANTS
- FIGURE 07. LOW THREAT OF SUBSTITUTES
- FIGURE 08. LOW INTENSITY OF RIVALRY
- FIGURE 09. LOW BARGAINING POWER OF BUYERS
- FIGURE 10. GLOBAL HYDROGEN STORAGE MARKET:DRIVERS, RESTRAINTS AND OPPORTUNITIES
- FIGURE 11. PATENT ANALYSIS BY COMPANY
- FIGURE 12. PATENT ANALYSIS BY COUNTRY
- FIGURE 13. HYDROGEN STORAGE MARKET, BY TYPE, 2022 AND 2032(%)
- FIGURE 14. COMPARATIVE SHARE ANALYSIS OF HYDROGEN STORAGE MARKET FOR CYLINDER, BY COUNTRY 2022 AND 2032(%)
- FIGURE 15. COMPARATIVE SHARE ANALYSIS OF HYDROGEN STORAGE MARKET FOR MERCHANT/BULK, BY COUNTRY 2022 AND 2032(%)
- FIGURE 16. COMPARATIVE SHARE ANALYSIS OF HYDROGEN STORAGE MARKET FOR ON-SITE, BY COUNTRY 2022 AND 2032(%)
- FIGURE 17. COMPARATIVE SHARE ANALYSIS OF HYDROGEN STORAGE MARKET FOR ON-BOARD, BY COUNTRY 2022 AND 2032(%)
- FIGURE 18. HYDROGEN STORAGE MARKET, BY STORAGE, 2022 AND 2032(%)
- FIGURE 19. COMPARATIVE SHARE ANALYSIS OF HYDROGEN STORAGE MARKET FOR MATERIAL, BY COUNTRY 2022 AND 2032(%)
- FIGURE 20. COMPARATIVE SHARE ANALYSIS OF HYDROGEN STORAGE MARKET FOR PHYSICAL, BY COUNTRY 2022 AND 2032(%)
- FIGURE 21. HYDROGEN STORAGE MARKET, BY END-USE INDUSTRY, 2022 AND 2032(%)
- FIGURE 22. COMPARATIVE SHARE ANALYSIS OF HYDROGEN STORAGE MARKET FOR CHEMICAL, BY COUNTRY 2022 AND 2032(%)
- FIGURE 23. COMPARATIVE SHARE ANALYSIS OF HYDROGEN STORAGE MARKET FOR OIL REFINERIES, BY COUNTRY 2022 AND 2032(%)
- FIGURE 24. COMPARATIVE SHARE ANALYSIS OF HYDROGEN STORAGE MARKET FOR AUTOMOTIVE AND TRANSPORTATION, BY COUNTRY 2022 AND 2032(%)
- FIGURE 25. COMPARATIVE SHARE ANALYSIS OF HYDROGEN STORAGE MARKET FOR METALWORKING, BY COUNTRY 2022 AND 2032(%)
- FIGURE 26. COMPARATIVE SHARE ANALYSIS OF HYDROGEN STORAGE MARKET FOR OTHERS, BY COUNTRY 2022 AND 2032(%)
- FIGURE 27. HYDROGEN STORAGE MARKET BY REGION, 2022 AND 2032(%)
- FIGURE 28. U.S. HYDROGEN STORAGE MARKET, 2022-2032 ($MILLION)
- FIGURE 29. CANADA HYDROGEN STORAGE MARKET, 2022-2032 ($MILLION)
- FIGURE 30. MEXICO HYDROGEN STORAGE MARKET, 2022-2032 ($MILLION)
- FIGURE 31. GERMANY HYDROGEN STORAGE MARKET, 2022-2032 ($MILLION)
- FIGURE 32. FRANCE HYDROGEN STORAGE MARKET, 2022-2032 ($MILLION)
- FIGURE 33. UK HYDROGEN STORAGE MARKET, 2022-2032 ($MILLION)
- FIGURE 34. SPAIN HYDROGEN STORAGE MARKET, 2022-2032 ($MILLION)
- FIGURE 35. ITALY HYDROGEN STORAGE MARKET, 2022-2032 ($MILLION)
- FIGURE 36. REST OF EUROPE HYDROGEN STORAGE MARKET, 2022-2032 ($MILLION)
- FIGURE 37. CHINA HYDROGEN STORAGE MARKET, 2022-2032 ($MILLION)
- FIGURE 38. JAPAN HYDROGEN STORAGE MARKET, 2022-2032 ($MILLION)
- FIGURE 39. INDIA HYDROGEN STORAGE MARKET, 2022-2032 ($MILLION)
- FIGURE 40. SOUTH KOREA HYDROGEN STORAGE MARKET, 2022-2032 ($MILLION)
- FIGURE 41. AUSTRALIA HYDROGEN STORAGE MARKET, 2022-2032 ($MILLION)
- FIGURE 42. REST OF ASIA-PACIFIC HYDROGEN STORAGE MARKET, 2022-2032 ($MILLION)
- FIGURE 43. BRAZIL HYDROGEN STORAGE MARKET, 2022-2032 ($MILLION)
- FIGURE 44. SAUDI ARABIA HYDROGEN STORAGE MARKET, 2022-2032 ($MILLION)
- FIGURE 45. SOUTH AFRICA HYDROGEN STORAGE MARKET, 2022-2032 ($MILLION)
- FIGURE 46. REST OF LAMEA HYDROGEN STORAGE MARKET, 2022-2032 ($MILLION)
- FIGURE 47. TOP WINNING STRATEGIES, BY YEAR
- FIGURE 48. TOP WINNING STRATEGIES, BY DEVELOPMENT
- FIGURE 49. TOP WINNING STRATEGIES, BY COMPANY
- FIGURE 50. PRODUCT MAPPING OF TOP 10 PLAYERS
- FIGURE 51. COMPETITIVE DASHBOARD
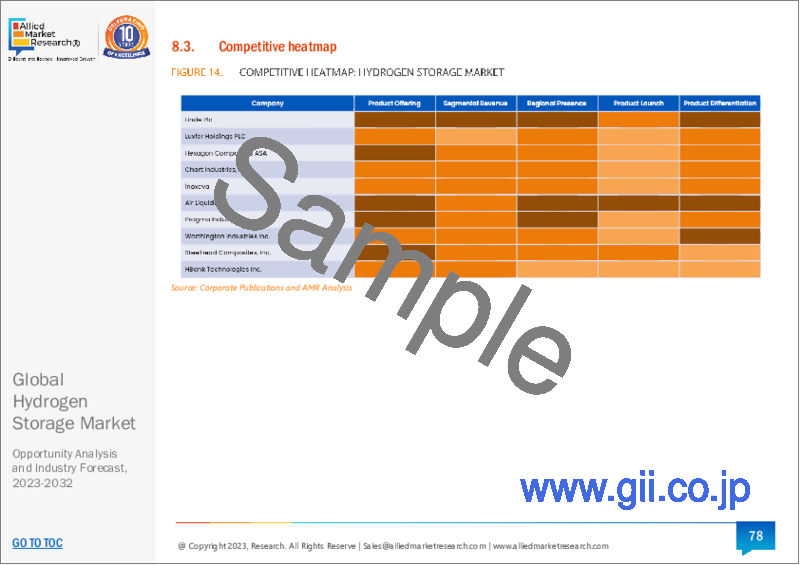
- FIGURE 52. COMPETITIVE HEATMAP: HYDROGEN STORAGE MARKET
- FIGURE 53. TOP PLAYER POSITIONING, 2022
- FIGURE 54. AIR LIQUIDE: NET REVENUE, 2020-2022 ($MILLION)
- FIGURE 55. AIR LIQUIDE: REVENUE SHARE BY SEGMENT, 2022 (%)
- FIGURE 56. AIR LIQUIDE: REVENUE SHARE BY REGION, 2022 (%)
- FIGURE 57. LINDE PLC: NET SALES, 2020-2022 ($MILLION)
- FIGURE 58. LINDE PLC: RESEARCH & DEVELOPMENT EXPENDITURE, 2020-2022 ($MILLION)
- FIGURE 59. LINDE PLC: REVENUE SHARE BY SEGMENT, 2022 (%)
- FIGURE 60. LINDE PLC: REVENUE SHARE BY REGION, 2022 (%)
- FIGURE 61. WORTHINGTON INDUSTRIES INC.: NET REVENUE, 2020-2022 ($MILLION)
- FIGURE 62. WORTHINGTON INDUSTRIES INC.: REVENUE SHARE BY REGION, 2022 (%)
- FIGURE 63. WORTHINGTON INDUSTRIES INC.: REVENUE SHARE BY SEGMENT, 2022 (%)
- FIGURE 64. LUXFER HOLDINGS PLC: NET REVENUE, 2020-2022 ($MILLION)
- FIGURE 65. LUXFER HOLDINGS PLC: REVENUE SHARE BY SEGMENT, 2022 (%)
- FIGURE 66. HEXAGON COMPOSITES ASA: NET REVENUE, 2020-2022 ($MILLION)
- FIGURE 67. HEXAGON COMPOSITES ASA: REVENUE SHARE BY SEGMENT, 2022 (%)
- FIGURE 68. CHART INDUSTRIES: NET SALES, 2020-2022 ($MILLION)
- FIGURE 69. CHART INDUSTRIES: RESEARCH & DEVELOPMENT EXPENDITURE, 2020-2022 ($MILLION)
- FIGURE 70. CHART INDUSTRIES: REVENUE SHARE BY REGION, 2022 (%)
- FIGURE 71. CHART INDUSTRIES: REVENUE SHARE BY REGION, 2022 (%)
- FIGURE 72. INOXCVA: NET REVENUE, 2021-2023 ($MILLION)
According to a new report published by Allied Market Research, titled, "Hydrogen Storage Market," The hydrogen storage market was valued at $2.8 billion in 2022, and is estimated to reach $8.6 billion by 2032, growing at a CAGR of 12.7% from 2023 to 2032.
Hydrogen storage system refers to the industry involved in the development, manufacture, and distribution of technologies and infrastructure required for the safe and efficient storage of hydrogen. Hydrogen storage systems play a critical role in enabling the utilization of hydrogen as an energy carrier for various applications. Hydrogen energy storage encompasses a range of storage technologies and solutions such as
1) compresses gas storage, liquid storage, metal and chemical hydride storage, and solid-state storage.
The growth in interest in green energy solutions has led to a surge in demand for cylinder hydrogen storage, a method viewed by many as a vital component in the transition to a more sustainable energy future. With the world aggressively moving away from fossil fuels, hydrogen, often hailed as the fuel of the future, finds itself in the spotlight due to its high energy content and clean-burning properties, producing only water as a byproduct. Consequently, effective storage and transport mechanisms for hydrogen have become increasingly crucial, with compressed hydrogen cylinders emerging as a prevalent choice for several reasons.
First, they offer a degree of portability unparalleled by many other storage methods, allowing for easy transport and exchange, facilitating its distribution across diverse sectors and locations. Furthermore, the technology underpinning this form of storage is mature and proven, having been employed in various capacities over the years, thus offering reliability and a degree of familiarity that new technologies may lack. Moreover, the versatility of cylinder storage, adaptable to a multitude of applications ranging from vehicular fueling to backup power sources, makes it an attractive choice for businesses and governments alike. Concurrently, there is an industry-wide push for regularizing safety protocols, ensuring that as cylinder usage grows, so does the commitment to safe handling, storage, and transportation.
However, the most common storage method involves compressing hydrogen to store it under high pressure, usually around 350-700 bar (5,000-10,000 psi). The tanks must be incredibly robust to withstand such pressures, so they are typically constructed using high-strength composite materials such as
1) carbon fibers, which are expensive. The production of these high-pressure tanks is not straightforward. They require specialized manufacturing processes, precision engineering, and quality control, all contributing to higher costs. There is ongoing research into finding more efficient and cost-effective hydrogen storage solutions, such as
1) metal hydrides or chemical storage. Investment in R&D, while essential for future breakthroughs, adds an initial cost that is often reflected in current storage solutions.
Addressing the high costs of hydrogen storage tanks is critical for the broader acceptance and deployment of hydrogen technologies, especially in applications such as
1) transportation where onboard storage space and costs are vital considerations. The limited availability of hydrogen refueling infrastructure poses a significant challenge to the mass adoption of hydrogen as a clean energy carrier, especially in the transportation sector.
The scarcity of refueling stations renders it less convenient for potential users, especially when compared to the ubiquitous gasoline stations or growth in number of electric vehicles charging points while hydrogen offers substantial benefits in terms of emissions and energy density. This lack of infrastructure, in turn, impacts consumer confidence, as potential buyers of hydrogen fuel cell vehicles (FCVs) may be deterred by concerns about refueling availability during longer trips or in remote areas.
On the contrary, the development of low weight hydrogen storage tanks is a critical area of focus for the advancement of hydrogen as a viable energy carrier, especially in the transportation sector. The weight of storage solutions directly impacts vehicle efficiency, range, and overall performance. Traditional high-pressure hydrogen storage tanks primarily utilize carbon fiber composites due to their strength-to-weight ratio. Research is ongoing to enhance the properties of these composites, allowing for thinner, lighter tank walls without compromising safety.
These chemical compounds absorb and release hydrogen, providing a way to store hydrogen at much lower pressures, hence potentially reducing tank weight. Scientists are actively researching lightweight metal hydrides with high storage capacities. These chemical compounds can absorb and release hydrogen, providing a way to store hydrogen at much lower pressures, hence potentially reducing tank weight. Materials such as
1) metal-organic frameworks (MOFs) and covalent organic frameworks (COFs) have shown promise. These structures can trap hydrogen molecules at high densities without requiring the hydrogen to be at high pressures, potentially reducing tank weight. Hence, the development of low weight hydrogen storage tanks will provide lucrative opportunity for the hydrogen storage tanks in automobile industry as the automobile industry is focusing on reducing weight of vehicle to increase the efficiency and overall performance.
The hydrogen storage market is segmented into type, storage form, end-use industry, and region. On the basis of type, the market is categorized into cylinder, merchant, on-site, and on-board. On the basis of storage form, the market is bifurcated into material-based hydrogen storage and physical hydrogen storage. On the basis of end-use industry, the market is classified into chemical, oil refineries, automotive & transportation, metalworking, and others. On the basis of region, it is analyzed across North America, Europe, Asia-Pacific, and LAMEA.
Key Benefits For Stakeholders
- This report provides a quantitative analysis of the market segments, current trends, estimations, and dynamics of the hydrogen storage market analysis from 2022 to 2032 to identify the prevailing hydrogen storage market opportunities.
- The market research is offered along with information related to key drivers, restraints, and opportunities.
- Porter's five forces analysis highlights the potency of buyers and suppliers to enable stakeholders make profit-oriented business decisions and strengthen their supplier-buyer network.
- In-depth analysis of the hydrogen storage market segmentation assists to determine the prevailing market opportunities.
- Major countries in each region are mapped according to their revenue contribution to the global market.
- Market player positioning facilitates benchmarking and provides a clear understanding of the present position of the market players.
- The report includes the analysis of the regional as well as global hydrogen storage market trends, key players, market segments, application areas, and market growth strategies.
Additional benefits you will get with this purchase are:
- Quarterly Update and* (only available with a corporate license, on listed price)
- 5 additional Company Profile of client Choice pre- or Post-purchase, as a free update.
- Free Upcoming Version on the Purchase of Five and Enterprise User License.
- 16 analyst hours of support* (post-purchase, if you find additional data requirements upon review of the report, you may receive support amounting to 16 analyst hours to solve questions, and post-sale queries)
- 15% Free Customization* (in case the scope or segment of the report does not match your requirements, 15% is equivalent to 3 working days of free work, applicable once)
- Free data Pack on the Five and Enterprise User License. (Excel version of the report)
- Free Updated report if the report is 6-12 months old or older.
- 24-hour priority response*
- Free Industry updates and white papers.
Possible Customization with this report (with additional cost and timeline, please talk to the sales executive to know more)
- Analysis of raw material in a product (by %)
- Manufacturing Capacity
- Investment Opportunities
- Product Life Cycles
- Senario Analysis & Growth Trend Comparision
- Upcoming/New Entrant by Regions
- Technology Trend Analysis
- Patient/epidemiology data at country, region, global level
- Regulatory Guidelines
- Additional company profiles with specific to client's interest
- Additional country or region analysis- market size and forecast
- Average Selling Price Analysis / Price Point Analysis
- Criss-cross segment analysis- market size and forecast
- Expanded list for Company Profiles
- Historic market data
- Import Export Analysis/Data
- Key player details (including location, contact details, supplier/vendor network etc. in excel format)
Key Market Segments
By Type
- Cylinder
- Merchant/bulk
- On-Site
- On-Board
By Storage
- Material
- Physical
By End-use Industry
- Chemical
- Oil refineries
- Automotive and transportation
- Metalworking
- Others
By Region
- North America
- U.S.
- Canada
- Mexico
- Europe
- Germany
- France
- UK
- Spain
- Italy
- Rest of Europe
- Asia-Pacific
- China
- Japan
- India
- South Korea
- Australia
- Rest of Asia-Pacific
- LAMEA
- Brazil
- Saudi Arabia
- South Africa
- Rest of LAMEA
Key Market Players:
- Hexagon Composites ASA
- Chart Industries, Inc.
- Worthington Industries Inc.
- Steelhead Composites, Inc.
- Linde Plc
- Air Liquide
- Luxfer Holdings PLC
- inoxcva
- Pragma Industries
- HBank Technologies Inc.
TABLE OF CONTENTS
CHAPTER 1: INTRODUCTION
- 1.1. Report description
- 1.2. Key market segments
- 1.3. Key benefits to the stakeholders
- 1.4. Research methodology
- 1.4.1. Primary research
- 1.4.2. Secondary research
- 1.4.3. Analyst tools and models
CHAPTER 2: EXECUTIVE SUMMARY
- 2.1. CXO Perspective
CHAPTER 3: MARKET OVERVIEW
- 3.1. Market definition and scope
- 3.2. Key findings
- 3.2.1. Top impacting factors
- 3.2.2. Top investment pockets
- 3.3. Porter's five forces analysis
- 3.3.1. Low bargaining power of suppliers
- 3.3.2. Low threat of new entrants
- 3.3.3. Low threat of substitutes
- 3.3.4. Low intensity of rivalry
- 3.3.5. Low bargaining power of buyers
- 3.4. Market dynamics
- 3.4.1. Drivers
- 3.4.1.1. Increased demand for low-emission fuel
- 3.4.1.2. * Increased demand from various industries
- 3.4.2. Restraints
- 3.4.2.1. High cost of composite material-based tanks
- 3.4.3. Opportunities
- 3.4.3.1. Development of low weight hydrogen storage tanks
- 3.4.1. Drivers
- 3.5. Value Chain Analysis
- 3.6. Patent Landscape
CHAPTER 4: HYDROGEN STORAGE MARKET, BY TYPE
- 4.1. Overview
- 4.1.1. Market size and forecast
- 4.2. Cylinder
- 4.2.1. Key market trends, growth factors and opportunities
- 4.2.2. Market size and forecast, by region
- 4.2.3. Market share analysis by country
- 4.3. Merchant/bulk
- 4.3.1. Key market trends, growth factors and opportunities
- 4.3.2. Market size and forecast, by region
- 4.3.3. Market share analysis by country
- 4.4. On-Site
- 4.4.1. Key market trends, growth factors and opportunities
- 4.4.2. Market size and forecast, by region
- 4.4.3. Market share analysis by country
- 4.5. On-Board
- 4.5.1. Key market trends, growth factors and opportunities
- 4.5.2. Market size and forecast, by region
- 4.5.3. Market share analysis by country
CHAPTER 5: HYDROGEN STORAGE MARKET, BY STORAGE
- 5.1. Overview
- 5.1.1. Market size and forecast
- 5.2. Material
- 5.2.1. Key market trends, growth factors and opportunities
- 5.2.2. Market size and forecast, by region
- 5.2.3. Market share analysis by country
- 5.3. Physical
- 5.3.1. Key market trends, growth factors and opportunities
- 5.3.2. Market size and forecast, by region
- 5.3.3. Market share analysis by country
CHAPTER 6: HYDROGEN STORAGE MARKET, BY END-USE INDUSTRY
- 6.1. Overview
- 6.1.1. Market size and forecast
- 6.2. Chemical
- 6.2.1. Key market trends, growth factors and opportunities
- 6.2.2. Market size and forecast, by region
- 6.2.3. Market share analysis by country
- 6.3. Oil refineries
- 6.3.1. Key market trends, growth factors and opportunities
- 6.3.2. Market size and forecast, by region
- 6.3.3. Market share analysis by country
- 6.4. Automotive and transportation
- 6.4.1. Key market trends, growth factors and opportunities
- 6.4.2. Market size and forecast, by region
- 6.4.3. Market share analysis by country
- 6.5. Metalworking
- 6.5.1. Key market trends, growth factors and opportunities
- 6.5.2. Market size and forecast, by region
- 6.5.3. Market share analysis by country
- 6.6. Others
- 6.6.1. Key market trends, growth factors and opportunities
- 6.6.2. Market size and forecast, by region
- 6.6.3. Market share analysis by country
CHAPTER 7: HYDROGEN STORAGE MARKET, BY REGION
- 7.1. Overview
- 7.1.1. Market size and forecast By Region
- 7.2. North America
- 7.2.1. Key market trends, growth factors and opportunities
- 7.2.2. Market size and forecast, by Type
- 7.2.3. Market size and forecast, by Storage
- 7.2.4. Market size and forecast, by End-use Industry
- 7.2.5. Market size and forecast, by country
- 7.2.5.1. U.S.
- 7.2.5.1.1. Market size and forecast, by Type
- 7.2.5.1.2. Market size and forecast, by Storage
- 7.2.5.1.3. Market size and forecast, by End-use Industry
- 7.2.5.2. Canada
- 7.2.5.2.1. Market size and forecast, by Type
- 7.2.5.2.2. Market size and forecast, by Storage
- 7.2.5.2.3. Market size and forecast, by End-use Industry
- 7.2.5.3. Mexico
- 7.2.5.3.1. Market size and forecast, by Type
- 7.2.5.3.2. Market size and forecast, by Storage
- 7.2.5.3.3. Market size and forecast, by End-use Industry
- 7.3. Europe
- 7.3.1. Key market trends, growth factors and opportunities
- 7.3.2. Market size and forecast, by Type
- 7.3.3. Market size and forecast, by Storage
- 7.3.4. Market size and forecast, by End-use Industry
- 7.3.5. Market size and forecast, by country
- 7.3.5.1. Germany
- 7.3.5.1.1. Market size and forecast, by Type
- 7.3.5.1.2. Market size and forecast, by Storage
- 7.3.5.1.3. Market size and forecast, by End-use Industry
- 7.3.5.2. France
- 7.3.5.2.1. Market size and forecast, by Type
- 7.3.5.2.2. Market size and forecast, by Storage
- 7.3.5.2.3. Market size and forecast, by End-use Industry
- 7.3.5.3. UK
- 7.3.5.3.1. Market size and forecast, by Type
- 7.3.5.3.2. Market size and forecast, by Storage
- 7.3.5.3.3. Market size and forecast, by End-use Industry
- 7.3.5.4. Spain
- 7.3.5.4.1. Market size and forecast, by Type
- 7.3.5.4.2. Market size and forecast, by Storage
- 7.3.5.4.3. Market size and forecast, by End-use Industry
- 7.3.5.5. Italy
- 7.3.5.5.1. Market size and forecast, by Type
- 7.3.5.5.2. Market size and forecast, by Storage
- 7.3.5.5.3. Market size and forecast, by End-use Industry
- 7.3.5.6. Rest of Europe
- 7.3.5.6.1. Market size and forecast, by Type
- 7.3.5.6.2. Market size and forecast, by Storage
- 7.3.5.6.3. Market size and forecast, by End-use Industry
- 7.4. Asia-Pacific
- 7.4.1. Key market trends, growth factors and opportunities
- 7.4.2. Market size and forecast, by Type
- 7.4.3. Market size and forecast, by Storage
- 7.4.4. Market size and forecast, by End-use Industry
- 7.4.5. Market size and forecast, by country
- 7.4.5.1. China
- 7.4.5.1.1. Market size and forecast, by Type
- 7.4.5.1.2. Market size and forecast, by Storage
- 7.4.5.1.3. Market size and forecast, by End-use Industry
- 7.4.5.2. Japan
- 7.4.5.2.1. Market size and forecast, by Type
- 7.4.5.2.2. Market size and forecast, by Storage
- 7.4.5.2.3. Market size and forecast, by End-use Industry
- 7.4.5.3. India
- 7.4.5.3.1. Market size and forecast, by Type
- 7.4.5.3.2. Market size and forecast, by Storage
- 7.4.5.3.3. Market size and forecast, by End-use Industry
- 7.4.5.4. South Korea
- 7.4.5.4.1. Market size and forecast, by Type
- 7.4.5.4.2. Market size and forecast, by Storage
- 7.4.5.4.3. Market size and forecast, by End-use Industry
- 7.4.5.5. Australia
- 7.4.5.5.1. Market size and forecast, by Type
- 7.4.5.5.2. Market size and forecast, by Storage
- 7.4.5.5.3. Market size and forecast, by End-use Industry
- 7.4.5.6. Rest of Asia-Pacific
- 7.4.5.6.1. Market size and forecast, by Type
- 7.4.5.6.2. Market size and forecast, by Storage
- 7.4.5.6.3. Market size and forecast, by End-use Industry
- 7.5. LAMEA
- 7.5.1. Key market trends, growth factors and opportunities
- 7.5.2. Market size and forecast, by Type
- 7.5.3. Market size and forecast, by Storage
- 7.5.4. Market size and forecast, by End-use Industry
- 7.5.5. Market size and forecast, by country
- 7.5.5.1. Brazil
- 7.5.5.1.1. Market size and forecast, by Type
- 7.5.5.1.2. Market size and forecast, by Storage
- 7.5.5.1.3. Market size and forecast, by End-use Industry
- 7.5.5.2. Saudi Arabia
- 7.5.5.2.1. Market size and forecast, by Type
- 7.5.5.2.2. Market size and forecast, by Storage
- 7.5.5.2.3. Market size and forecast, by End-use Industry
- 7.5.5.3. South Africa
- 7.5.5.3.1. Market size and forecast, by Type
- 7.5.5.3.2. Market size and forecast, by Storage
- 7.5.5.3.3. Market size and forecast, by End-use Industry
- 7.5.5.4. Rest of LAMEA
- 7.5.5.4.1. Market size and forecast, by Type
- 7.5.5.4.2. Market size and forecast, by Storage
- 7.5.5.4.3. Market size and forecast, by End-use Industry
CHAPTER 8: COMPETITIVE LANDSCAPE
- 8.1. Introduction
- 8.2. Top winning strategies
- 8.3. Product mapping of top 10 player
- 8.4. Competitive dashboard
- 8.5. Competitive heatmap
- 8.6. Top player positioning, 2022
CHAPTER 9: COMPANY PROFILES
- 9.1. Air Liquide
- 9.1.1. Company overview
- 9.1.2. Key executives
- 9.1.3. Company snapshot
- 9.1.4. Operating business segments
- 9.1.5. Product portfolio
- 9.1.6. Business performance
- 9.2. Linde Plc
- 9.2.1. Company overview
- 9.2.2. Key executives
- 9.2.3. Company snapshot
- 9.2.4. Operating business segments
- 9.2.5. Product portfolio
- 9.2.6. Business performance
- 9.3. Worthington Industries Inc.
- 9.3.1. Company overview
- 9.3.2. Key executives
- 9.3.3. Company snapshot
- 9.3.4. Operating business segments
- 9.3.5. Product portfolio
- 9.3.6. Business performance
- 9.4. Luxfer Holdings PLC
- 9.4.1. Company overview
- 9.4.2. Key executives
- 9.4.3. Company snapshot
- 9.4.4. Operating business segments
- 9.4.5. Product portfolio
- 9.4.6. Business performance
- 9.5. Hexagon Composites ASA
- 9.5.1. Company overview
- 9.5.2. Key executives
- 9.5.3. Company snapshot
- 9.5.4. Operating business segments
- 9.5.5. Product portfolio
- 9.5.6. Business performance
- 9.6. Chart Industries, Inc.
- 9.6.1. Company overview
- 9.6.2. Key executives
- 9.6.3. Company snapshot
- 9.6.4. Operating business segments
- 9.6.5. Product portfolio
- 9.6.6. Business performance
- 9.7. inoxcva
- 9.7.1. Company overview
- 9.7.2. Key executives
- 9.7.3. Company snapshot
- 9.7.4. Operating business segments
- 9.7.5. Product portfolio
- 9.7.6. Business performance
- 9.8. HBank Technologies Inc.
- 9.8.1. Company overview
- 9.8.2. Key executives
- 9.8.3. Company snapshot
- 9.8.4. Operating business segments
- 9.8.5. Product portfolio
- 9.9. Pragma Industries
- 9.9.1. Company overview
- 9.9.2. Key executives
- 9.9.3. Company snapshot
- 9.9.4. Operating business segments
- 9.9.5. Product portfolio
- 9.10. Steelhead Composites, Inc.
- 9.10.1. Company overview
- 9.10.2. Key executives
- 9.10.3. Company snapshot
- 9.10.4. Operating business segments
- 9.10.5. Product portfolio
