
|
市場調査レポート
商品コード
1365849
資産金融ソフトウェア市場:資産タイプ別、展開形態別、企業規模別、エンドユーザー別:世界市場機会分析および産業予測、2023~2032年Asset Finance Software Market By Asset Type, By Deployment Mode, By Enterprise Size, By End User : Global Opportunity Analysis and Industry Forecast, 2023-2032 |
||||||
|
|||||||

| 資産金融ソフトウェア市場:資産タイプ別、展開形態別、企業規模別、エンドユーザー別:世界市場機会分析および産業予測、2023~2032年 |
|
出版日: 2023年08月01日
発行: Allied Market Research
ページ情報: 英文 375 Pages
納期: 2~3営業日
|

- 全表示
- 概要
- 図表
- 目次
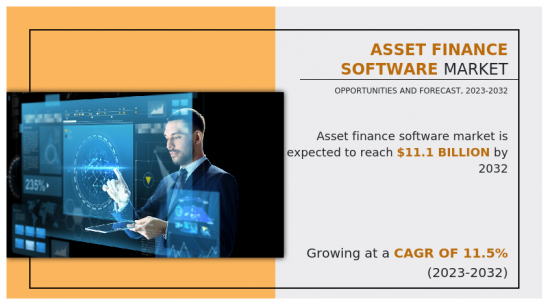
資産金融ソフトウェア市場の2022年の市場規模は38億米ドルで、2023年から2032年までのCAGRは11.5%で成長し、2032年には111億米ドルに達すると推定されます。
資産金融ソフトウェア市場の主な促進要因の1つは、効率的に資産を管理し、リソース配分を最適化し、全体的な財務計画と報告を改善するために、企業の間で合理化された財務業務の需要が高まっていることです。さらに、資産管理プロセスが自動化され、ライフサイクル全体を通して資産を追跡・管理できるようになり、リアルタイムの可視性とデータ洞察が得られるようになっています。このため、資産金融ソフトウェアの導入が促進され、市場の成長を後押ししています。さらに、リスク評価とコンプライアンス対策の改善に対するニーズが、融資や資産管理に関連するリスクを効果的に管理・軽減できる高度なソリューションを求める企業を促し、資産金融ソフトウェア市場の成長を後押ししています。しかし、データプライバシーとセキュリティに関する懸念は、顧客の信頼と信用に影響を与えることで、資産金融ソフトウェア市場の成長を妨げています。さらに、資産金融ソフトウェアは、顧客が資産を購入し、その管理を支援するものであるが、これらのソフトウェアのインストールコストは高く、資産金融ソフトウェア市場の成長を妨げるタスクを完了するために専門家を必要とします。しかし、資産金融ソフトウェアの技術統合は、今後数年間、資産金融ソフトウェア市場に有利な成長機会をもたらすと予想されます。
目次
第1章 イントロダクション
第2章 エグゼクティブサマリー
第3章 市場概要
- 市場の定義と範囲
- 主な調査結果
- 影響要因
- 主な投資機会
- ポーターのファイブフォース分析
- 市場力学
- 促進要因
- 合理化された財務業務に対する需要の増加
- 資産管理プロセスの自動化
- リスク評価とコンプライアンス対策の改善ニーズ
- 抑制要因
- データのプライバシーとセキュリティに関する懸念
- ソフトウェアの導入コストの高さ
- 機会
- 金融プロセスにおける技術の採用
- 促進要因
第4章 資産金融ソフトウェア市場:資産タイプ別
- 概要
- ハード資産
- ソフト資産
第5章 資産金融ソフトウェア市場:展開形態別
- 概要
- オンプレミス
- クラウド
第6章 資産金融ソフトウェア市場:企業規模別
- 概要
- 大企業
- 中小企業
第7章 資産金融ソフトウェア市場:エンドユーザー別
- 概要
- 銀行
- 運輸
- ITおよび関連サービス
- 建設
- 医療
- 農業
- その他
第8章 資産金融ソフトウェア市場:地域別
- 概要
- 北米
- 米国
- カナダ
- 欧州
- 英国
- ドイツ
- フランス
- イタリア
- スペイン
- その他
- アジア太平洋
- 中国
- 日本
- インド
- オーストラリア
- 韓国
- その他
- ラテンアメリカ
- ラテンアメリカ
- 中東
- アフリカ
第9章 競合情勢
- イントロダクション
- 主要成功戦略
- 主要10社の製品マッピング
- 競合ダッシュボード
- 競合ヒートマップ
- 主要企業のポジショニング、2022年
第10章 企業プロファイル
- Odessa
- FIS
- NetSol Technologies
- Alfa Financial Software Limited
- Banqsoft
- CGI Inc.
- Lendscape Limited
- ieDigital
- CHG-MERIDIAN
- Oracle Corporation
LIST OF TABLES
- TABLE 01. GLOBAL ASSET FINANCE SOFTWARE MARKET, BY ASSET TYPE, 2022-2032 ($MILLION)
- TABLE 02. ASSET FINANCE SOFTWARE MARKET FOR HARD ASSETS, BY REGION, 2022-2032 ($MILLION)
- TABLE 03. ASSET FINANCE SOFTWARE MARKET FOR SOFT ASSETS, BY REGION, 2022-2032 ($MILLION)
- TABLE 04. GLOBAL ASSET FINANCE SOFTWARE MARKET, BY DEPLOYMENT MODE, 2022-2032 ($MILLION)
- TABLE 05. ASSET FINANCE SOFTWARE MARKET FOR ON-PREMISE, BY REGION, 2022-2032 ($MILLION)
- TABLE 06. ASSET FINANCE SOFTWARE MARKET FOR CLOUD, BY REGION, 2022-2032 ($MILLION)
- TABLE 07. GLOBAL ASSET FINANCE SOFTWARE MARKET, BY ENTERPRISE SIZE, 2022-2032 ($MILLION)
- TABLE 08. ASSET FINANCE SOFTWARE MARKET FOR LARGE ENTERPRISES, BY REGION, 2022-2032 ($MILLION)
- TABLE 09. ASSET FINANCE SOFTWARE MARKET FOR SMALL AND MEDIUM-SIZED ENTERPRISES, BY REGION, 2022-2032 ($MILLION)
- TABLE 10. GLOBAL ASSET FINANCE SOFTWARE MARKET, BY END USER, 2022-2032 ($MILLION)
- TABLE 11. ASSET FINANCE SOFTWARE MARKET FOR BANKS, BY REGION, 2022-2032 ($MILLION)
- TABLE 12. ASSET FINANCE SOFTWARE MARKET FOR TRANSPORTATION, BY REGION, 2022-2032 ($MILLION)
- TABLE 13. ASSET FINANCE SOFTWARE MARKET FOR IT AND RELATED SERVICES, BY REGION, 2022-2032 ($MILLION)
- TABLE 14. ASSET FINANCE SOFTWARE MARKET FOR CONSTRUCTION, BY REGION, 2022-2032 ($MILLION)
- TABLE 15. ASSET FINANCE SOFTWARE MARKET FOR HEALTHCARE, BY REGION, 2022-2032 ($MILLION)
- TABLE 16. ASSET FINANCE SOFTWARE MARKET FOR AGRICULTURE, BY REGION, 2022-2032 ($MILLION)
- TABLE 17. ASSET FINANCE SOFTWARE MARKET FOR OTHERS, BY REGION, 2022-2032 ($MILLION)
- TABLE 18. ASSET FINANCE SOFTWARE MARKET, BY REGION, 2022-2032 ($MILLION)
- TABLE 19. NORTH AMERICA ASSET FINANCE SOFTWARE MARKET, BY ASSET TYPE, 2022-2032 ($MILLION)
- TABLE 20. NORTH AMERICA ASSET FINANCE SOFTWARE MARKET, BY DEPLOYMENT MODE, 2022-2032 ($MILLION)
- TABLE 21. NORTH AMERICA ASSET FINANCE SOFTWARE MARKET, BY ENTERPRISE SIZE, 2022-2032 ($MILLION)
- TABLE 22. NORTH AMERICA ASSET FINANCE SOFTWARE MARKET, BY END USER, 2022-2032 ($MILLION)
- TABLE 23. NORTH AMERICA ASSET FINANCE SOFTWARE MARKET, BY COUNTRY, 2022-2032 ($MILLION)
- TABLE 24. U.S. ASSET FINANCE SOFTWARE MARKET, BY ASSET TYPE, 2022-2032 ($MILLION)
- TABLE 25. U.S. ASSET FINANCE SOFTWARE MARKET, BY DEPLOYMENT MODE, 2022-2032 ($MILLION)
- TABLE 26. U.S. ASSET FINANCE SOFTWARE MARKET, BY ENTERPRISE SIZE, 2022-2032 ($MILLION)
- TABLE 27. U.S. ASSET FINANCE SOFTWARE MARKET, BY END USER, 2022-2032 ($MILLION)
- TABLE 28. CANADA ASSET FINANCE SOFTWARE MARKET, BY ASSET TYPE, 2022-2032 ($MILLION)
- TABLE 29. CANADA ASSET FINANCE SOFTWARE MARKET, BY DEPLOYMENT MODE, 2022-2032 ($MILLION)
- TABLE 30. CANADA ASSET FINANCE SOFTWARE MARKET, BY ENTERPRISE SIZE, 2022-2032 ($MILLION)
- TABLE 31. CANADA ASSET FINANCE SOFTWARE MARKET, BY END USER, 2022-2032 ($MILLION)
- TABLE 32. EUROPE ASSET FINANCE SOFTWARE MARKET, BY ASSET TYPE, 2022-2032 ($MILLION)
- TABLE 33. EUROPE ASSET FINANCE SOFTWARE MARKET, BY DEPLOYMENT MODE, 2022-2032 ($MILLION)
- TABLE 34. EUROPE ASSET FINANCE SOFTWARE MARKET, BY ENTERPRISE SIZE, 2022-2032 ($MILLION)
- TABLE 35. EUROPE ASSET FINANCE SOFTWARE MARKET, BY END USER, 2022-2032 ($MILLION)
- TABLE 36. EUROPE ASSET FINANCE SOFTWARE MARKET, BY COUNTRY, 2022-2032 ($MILLION)
- TABLE 37. UK ASSET FINANCE SOFTWARE MARKET, BY ASSET TYPE, 2022-2032 ($MILLION)
- TABLE 38. UK ASSET FINANCE SOFTWARE MARKET, BY DEPLOYMENT MODE, 2022-2032 ($MILLION)
- TABLE 39. UK ASSET FINANCE SOFTWARE MARKET, BY ENTERPRISE SIZE, 2022-2032 ($MILLION)
- TABLE 40. UK ASSET FINANCE SOFTWARE MARKET, BY END USER, 2022-2032 ($MILLION)
- TABLE 41. GERMANY ASSET FINANCE SOFTWARE MARKET, BY ASSET TYPE, 2022-2032 ($MILLION)
- TABLE 42. GERMANY ASSET FINANCE SOFTWARE MARKET, BY DEPLOYMENT MODE, 2022-2032 ($MILLION)
- TABLE 43. GERMANY ASSET FINANCE SOFTWARE MARKET, BY ENTERPRISE SIZE, 2022-2032 ($MILLION)
- TABLE 44. GERMANY ASSET FINANCE SOFTWARE MARKET, BY END USER, 2022-2032 ($MILLION)
- TABLE 45. FRANCE ASSET FINANCE SOFTWARE MARKET, BY ASSET TYPE, 2022-2032 ($MILLION)
- TABLE 46. FRANCE ASSET FINANCE SOFTWARE MARKET, BY DEPLOYMENT MODE, 2022-2032 ($MILLION)
- TABLE 47. FRANCE ASSET FINANCE SOFTWARE MARKET, BY ENTERPRISE SIZE, 2022-2032 ($MILLION)
- TABLE 48. FRANCE ASSET FINANCE SOFTWARE MARKET, BY END USER, 2022-2032 ($MILLION)
- TABLE 49. ITALY ASSET FINANCE SOFTWARE MARKET, BY ASSET TYPE, 2022-2032 ($MILLION)
- TABLE 50. ITALY ASSET FINANCE SOFTWARE MARKET, BY DEPLOYMENT MODE, 2022-2032 ($MILLION)
- TABLE 51. ITALY ASSET FINANCE SOFTWARE MARKET, BY ENTERPRISE SIZE, 2022-2032 ($MILLION)
- TABLE 52. ITALY ASSET FINANCE SOFTWARE MARKET, BY END USER, 2022-2032 ($MILLION)
- TABLE 53. SPAIN ASSET FINANCE SOFTWARE MARKET, BY ASSET TYPE, 2022-2032 ($MILLION)
- TABLE 54. SPAIN ASSET FINANCE SOFTWARE MARKET, BY DEPLOYMENT MODE, 2022-2032 ($MILLION)
- TABLE 55. SPAIN ASSET FINANCE SOFTWARE MARKET, BY ENTERPRISE SIZE, 2022-2032 ($MILLION)
- TABLE 56. SPAIN ASSET FINANCE SOFTWARE MARKET, BY END USER, 2022-2032 ($MILLION)
- TABLE 57. REST OF EUROPE ASSET FINANCE SOFTWARE MARKET, BY ASSET TYPE, 2022-2032 ($MILLION)
- TABLE 58. REST OF EUROPE ASSET FINANCE SOFTWARE MARKET, BY DEPLOYMENT MODE, 2022-2032 ($MILLION)
- TABLE 59. REST OF EUROPE ASSET FINANCE SOFTWARE MARKET, BY ENTERPRISE SIZE, 2022-2032 ($MILLION)
- TABLE 60. REST OF EUROPE ASSET FINANCE SOFTWARE MARKET, BY END USER, 2022-2032 ($MILLION)
- TABLE 61. ASIA-PACIFIC ASSET FINANCE SOFTWARE MARKET, BY ASSET TYPE, 2022-2032 ($MILLION)
- TABLE 62. ASIA-PACIFIC ASSET FINANCE SOFTWARE MARKET, BY DEPLOYMENT MODE, 2022-2032 ($MILLION)
- TABLE 63. ASIA-PACIFIC ASSET FINANCE SOFTWARE MARKET, BY ENTERPRISE SIZE, 2022-2032 ($MILLION)
- TABLE 64. ASIA-PACIFIC ASSET FINANCE SOFTWARE MARKET, BY END USER, 2022-2032 ($MILLION)
- TABLE 65. ASIA-PACIFIC ASSET FINANCE SOFTWARE MARKET, BY COUNTRY, 2022-2032 ($MILLION)
- TABLE 66. CHINA ASSET FINANCE SOFTWARE MARKET, BY ASSET TYPE, 2022-2032 ($MILLION)
- TABLE 67. CHINA ASSET FINANCE SOFTWARE MARKET, BY DEPLOYMENT MODE, 2022-2032 ($MILLION)
- TABLE 68. CHINA ASSET FINANCE SOFTWARE MARKET, BY ENTERPRISE SIZE, 2022-2032 ($MILLION)
- TABLE 69. CHINA ASSET FINANCE SOFTWARE MARKET, BY END USER, 2022-2032 ($MILLION)
- TABLE 70. JAPAN ASSET FINANCE SOFTWARE MARKET, BY ASSET TYPE, 2022-2032 ($MILLION)
- TABLE 71. JAPAN ASSET FINANCE SOFTWARE MARKET, BY DEPLOYMENT MODE, 2022-2032 ($MILLION)
- TABLE 72. JAPAN ASSET FINANCE SOFTWARE MARKET, BY ENTERPRISE SIZE, 2022-2032 ($MILLION)
- TABLE 73. JAPAN ASSET FINANCE SOFTWARE MARKET, BY END USER, 2022-2032 ($MILLION)
- TABLE 74. INDIA ASSET FINANCE SOFTWARE MARKET, BY ASSET TYPE, 2022-2032 ($MILLION)
- TABLE 75. INDIA ASSET FINANCE SOFTWARE MARKET, BY DEPLOYMENT MODE, 2022-2032 ($MILLION)
- TABLE 76. INDIA ASSET FINANCE SOFTWARE MARKET, BY ENTERPRISE SIZE, 2022-2032 ($MILLION)
- TABLE 77. INDIA ASSET FINANCE SOFTWARE MARKET, BY END USER, 2022-2032 ($MILLION)
- TABLE 78. AUSTRALIA ASSET FINANCE SOFTWARE MARKET, BY ASSET TYPE, 2022-2032 ($MILLION)
- TABLE 79. AUSTRALIA ASSET FINANCE SOFTWARE MARKET, BY DEPLOYMENT MODE, 2022-2032 ($MILLION)
- TABLE 80. AUSTRALIA ASSET FINANCE SOFTWARE MARKET, BY ENTERPRISE SIZE, 2022-2032 ($MILLION)
- TABLE 81. AUSTRALIA ASSET FINANCE SOFTWARE MARKET, BY END USER, 2022-2032 ($MILLION)
- TABLE 82. SOUTH KOREA ASSET FINANCE SOFTWARE MARKET, BY ASSET TYPE, 2022-2032 ($MILLION)
- TABLE 83. SOUTH KOREA ASSET FINANCE SOFTWARE MARKET, BY DEPLOYMENT MODE, 2022-2032 ($MILLION)
- TABLE 84. SOUTH KOREA ASSET FINANCE SOFTWARE MARKET, BY ENTERPRISE SIZE, 2022-2032 ($MILLION)
- TABLE 85. SOUTH KOREA ASSET FINANCE SOFTWARE MARKET, BY END USER, 2022-2032 ($MILLION)
- TABLE 86. REST OF ASIA-PACIFIC ASSET FINANCE SOFTWARE MARKET, BY ASSET TYPE, 2022-2032 ($MILLION)
- TABLE 87. REST OF ASIA-PACIFIC ASSET FINANCE SOFTWARE MARKET, BY DEPLOYMENT MODE, 2022-2032 ($MILLION)
- TABLE 88. REST OF ASIA-PACIFIC ASSET FINANCE SOFTWARE MARKET, BY ENTERPRISE SIZE, 2022-2032 ($MILLION)
- TABLE 89. REST OF ASIA-PACIFIC ASSET FINANCE SOFTWARE MARKET, BY END USER, 2022-2032 ($MILLION)
- TABLE 90. LAMEA ASSET FINANCE SOFTWARE MARKET, BY ASSET TYPE, 2022-2032 ($MILLION)
- TABLE 91. LAMEA ASSET FINANCE SOFTWARE MARKET, BY DEPLOYMENT MODE, 2022-2032 ($MILLION)
- TABLE 92. LAMEA ASSET FINANCE SOFTWARE MARKET, BY ENTERPRISE SIZE, 2022-2032 ($MILLION)
- TABLE 93. LAMEA ASSET FINANCE SOFTWARE MARKET, BY END USER, 2022-2032 ($MILLION)
- TABLE 94. LAMEA ASSET FINANCE SOFTWARE MARKET, BY COUNTRY, 2022-2032 ($MILLION)
- TABLE 95. LATIN AMERICA ASSET FINANCE SOFTWARE MARKET, BY ASSET TYPE, 2022-2032 ($MILLION)
- TABLE 96. LATIN AMERICA ASSET FINANCE SOFTWARE MARKET, BY DEPLOYMENT MODE, 2022-2032 ($MILLION)
- TABLE 97. LATIN AMERICA ASSET FINANCE SOFTWARE MARKET, BY ENTERPRISE SIZE, 2022-2032 ($MILLION)
- TABLE 98. LATIN AMERICA ASSET FINANCE SOFTWARE MARKET, BY END USER, 2022-2032 ($MILLION)
- TABLE 99. MIDDLE EAST ASSET FINANCE SOFTWARE MARKET, BY ASSET TYPE, 2022-2032 ($MILLION)
- TABLE 100. MIDDLE EAST ASSET FINANCE SOFTWARE MARKET, BY DEPLOYMENT MODE, 2022-2032 ($MILLION)
- TABLE 101. MIDDLE EAST ASSET FINANCE SOFTWARE MARKET, BY ENTERPRISE SIZE, 2022-2032 ($MILLION)
- TABLE 102. MIDDLE EAST ASSET FINANCE SOFTWARE MARKET, BY END USER, 2022-2032 ($MILLION)
- TABLE 103. AFRICA ASSET FINANCE SOFTWARE MARKET, BY ASSET TYPE, 2022-2032 ($MILLION)
- TABLE 104. AFRICA ASSET FINANCE SOFTWARE MARKET, BY DEPLOYMENT MODE, 2022-2032 ($MILLION)
- TABLE 105. AFRICA ASSET FINANCE SOFTWARE MARKET, BY ENTERPRISE SIZE, 2022-2032 ($MILLION)
- TABLE 106. AFRICA ASSET FINANCE SOFTWARE MARKET, BY END USER, 2022-2032 ($MILLION)
- TABLE 107. ODESSA: KEY EXECUTIVES
- TABLE 108. ODESSA: COMPANY SNAPSHOT
- TABLE 109. ODESSA: SERVICE SEGMENTS
- TABLE 110. ODESSA: PRODUCT PORTFOLIO
- TABLE 111. ODESSA: KEY STRATERGIES
- TABLE 112. FIS: KEY EXECUTIVES
- TABLE 113. FIS: COMPANY SNAPSHOT
- TABLE 114. FIS: SERVICE SEGMENTS
- TABLE 115. FIS: PRODUCT PORTFOLIO
- TABLE 116. FIS: KEY STRATERGIES
- TABLE 117. NETSOL TECHNOLOGIES: KEY EXECUTIVES
- TABLE 118. NETSOL TECHNOLOGIES: COMPANY SNAPSHOT
- TABLE 119. NETSOL TECHNOLOGIES: SERVICE SEGMENTS
- TABLE 120. NETSOL TECHNOLOGIES: PRODUCT PORTFOLIO
- TABLE 121. NETSOL TECHNOLOGIES: KEY STRATERGIES
- TABLE 122. ALFA FINANCIAL SOFTWARE LIMITED: KEY EXECUTIVES
- TABLE 123. ALFA FINANCIAL SOFTWARE LIMITED: COMPANY SNAPSHOT
- TABLE 124. ALFA FINANCIAL SOFTWARE LIMITED: SERVICE SEGMENTS
- TABLE 125. ALFA FINANCIAL SOFTWARE LIMITED: PRODUCT PORTFOLIO
- TABLE 126. ALFA FINANCIAL SOFTWARE LIMITED: KEY STRATERGIES
- TABLE 127. BANQSOFT: KEY EXECUTIVES
- TABLE 128. BANQSOFT: COMPANY SNAPSHOT
- TABLE 129. BANQSOFT: SERVICE SEGMENTS
- TABLE 130. BANQSOFT: PRODUCT PORTFOLIO
- TABLE 131. BANQSOFT: KEY STRATERGIES
- TABLE 132. CGI INC.: KEY EXECUTIVES
- TABLE 133. CGI INC.: COMPANY SNAPSHOT
- TABLE 134. CGI INC.: PRODUCT SEGMENTS
- TABLE 135. CGI INC.: PRODUCT PORTFOLIO
- TABLE 136. CGI INC.: KEY STRATERGIES
- TABLE 137. LENDSCAPE LIMITED: KEY EXECUTIVES
- TABLE 138. LENDSCAPE LIMITED: COMPANY SNAPSHOT
- TABLE 139. LENDSCAPE LIMITED: SERVICE SEGMENTS
- TABLE 140. LENDSCAPE LIMITED: PRODUCT PORTFOLIO
- TABLE 141. LENDSCAPE LIMITED: KEY STRATERGIES
- TABLE 142. IEDIGITAL: KEY EXECUTIVES
- TABLE 143. IEDIGITAL: COMPANY SNAPSHOT
- TABLE 144. IEDIGITAL: SERVICE SEGMENTS
- TABLE 145. IEDIGITAL: PRODUCT PORTFOLIO
- TABLE 146. IEDIGITAL: KEY STRATERGIES
- TABLE 147. CHG-MERIDIAN: KEY EXECUTIVES
- TABLE 148. CHG-MERIDIAN: COMPANY SNAPSHOT
- TABLE 149. CHG-MERIDIAN: SERVICE SEGMENTS
- TABLE 150. CHG-MERIDIAN: PRODUCT PORTFOLIO
- TABLE 151. CHG-MERIDIAN: KEY STRATERGIES
- TABLE 152. ORACLE CORPORATION: KEY EXECUTIVES
- TABLE 153. ORACLE CORPORATION: COMPANY SNAPSHOT
- TABLE 154. ORACLE CORPORATION: SERVICE SEGMENTS
- TABLE 155. ORACLE CORPORATION: PRODUCT PORTFOLIO
- TABLE 156. ORACLE CORPORATION: KEY STRATERGIES
LIST OF FIGURES
- FIGURE 01. ASSET FINANCE SOFTWARE MARKET, 2022-2032
- FIGURE 02. SEGMENTATION OF ASSET FINANCE SOFTWARE MARKET,2022-2032
- FIGURE 03. TOP INVESTMENT POCKETS IN ASSET FINANCE SOFTWARE MARKET (2023-2032)
- FIGURE 04. LOW BARGAINING POWER OF SUPPLIERS
- FIGURE 05. LOW THREAT OF NEW ENTRANTS
- FIGURE 06. LOW THREAT OF SUBSTITUTES
- FIGURE 07. LOW INTENSITY OF RIVALRY
- FIGURE 08. LOW BARGAINING POWER OF BUYERS
- FIGURE 09. GLOBAL ASSET FINANCE SOFTWARE MARKET:DRIVERS, RESTRAINTS AND OPPORTUNITIES
- FIGURE 10. ASSET FINANCE SOFTWARE MARKET, BY ASSET TYPE, 2022 AND 2032(%)
- FIGURE 11. COMPARATIVE SHARE ANALYSIS OF ASSET FINANCE SOFTWARE MARKET FOR HARD ASSETS, BY COUNTRY 2022 AND 2032(%)
- FIGURE 12. COMPARATIVE SHARE ANALYSIS OF ASSET FINANCE SOFTWARE MARKET FOR SOFT ASSETS, BY COUNTRY 2022 AND 2032(%)
- FIGURE 13. ASSET FINANCE SOFTWARE MARKET, BY DEPLOYMENT MODE, 2022 AND 2032(%)
- FIGURE 14. COMPARATIVE SHARE ANALYSIS OF ASSET FINANCE SOFTWARE MARKET FOR ON-PREMISE, BY COUNTRY 2022 AND 2032(%)
- FIGURE 15. COMPARATIVE SHARE ANALYSIS OF ASSET FINANCE SOFTWARE MARKET FOR CLOUD, BY COUNTRY 2022 AND 2032(%)
- FIGURE 16. ASSET FINANCE SOFTWARE MARKET, BY ENTERPRISE SIZE, 2022 AND 2032(%)
- FIGURE 17. COMPARATIVE SHARE ANALYSIS OF ASSET FINANCE SOFTWARE MARKET FOR LARGE ENTERPRISES, BY COUNTRY 2022 AND 2032(%)
- FIGURE 18. COMPARATIVE SHARE ANALYSIS OF ASSET FINANCE SOFTWARE MARKET FOR SMALL AND MEDIUM-SIZED ENTERPRISES, BY COUNTRY 2022 AND 2032(%)
- FIGURE 19. ASSET FINANCE SOFTWARE MARKET, BY END USER, 2022 AND 2032(%)
- FIGURE 20. COMPARATIVE SHARE ANALYSIS OF ASSET FINANCE SOFTWARE MARKET FOR BANKS, BY COUNTRY 2022 AND 2032(%)
- FIGURE 21. COMPARATIVE SHARE ANALYSIS OF ASSET FINANCE SOFTWARE MARKET FOR TRANSPORTATION, BY COUNTRY 2022 AND 2032(%)
- FIGURE 22. COMPARATIVE SHARE ANALYSIS OF ASSET FINANCE SOFTWARE MARKET FOR IT AND RELATED SERVICES, BY COUNTRY 2022 AND 2032(%)
- FIGURE 23. COMPARATIVE SHARE ANALYSIS OF ASSET FINANCE SOFTWARE MARKET FOR CONSTRUCTION, BY COUNTRY 2022 AND 2032(%)
- FIGURE 24. COMPARATIVE SHARE ANALYSIS OF ASSET FINANCE SOFTWARE MARKET FOR HEALTHCARE, BY COUNTRY 2022 AND 2032(%)
- FIGURE 25. COMPARATIVE SHARE ANALYSIS OF ASSET FINANCE SOFTWARE MARKET FOR AGRICULTURE, BY COUNTRY 2022 AND 2032(%)
- FIGURE 26. COMPARATIVE SHARE ANALYSIS OF ASSET FINANCE SOFTWARE MARKET FOR OTHERS, BY COUNTRY 2022 AND 2032(%)
- FIGURE 27. ASSET FINANCE SOFTWARE MARKET BY REGION, 2022 AND 2032(%)
- FIGURE 28. U.S. ASSET FINANCE SOFTWARE MARKET, 2022-2032 ($MILLION)
- FIGURE 29. CANADA ASSET FINANCE SOFTWARE MARKET, 2022-2032 ($MILLION)
- FIGURE 30. UK ASSET FINANCE SOFTWARE MARKET, 2022-2032 ($MILLION)
- FIGURE 31. GERMANY ASSET FINANCE SOFTWARE MARKET, 2022-2032 ($MILLION)
- FIGURE 32. FRANCE ASSET FINANCE SOFTWARE MARKET, 2022-2032 ($MILLION)
- FIGURE 33. ITALY ASSET FINANCE SOFTWARE MARKET, 2022-2032 ($MILLION)
- FIGURE 34. SPAIN ASSET FINANCE SOFTWARE MARKET, 2022-2032 ($MILLION)
- FIGURE 35. REST OF EUROPE ASSET FINANCE SOFTWARE MARKET, 2022-2032 ($MILLION)
- FIGURE 36. CHINA ASSET FINANCE SOFTWARE MARKET, 2022-2032 ($MILLION)
- FIGURE 37. JAPAN ASSET FINANCE SOFTWARE MARKET, 2022-2032 ($MILLION)
- FIGURE 38. INDIA ASSET FINANCE SOFTWARE MARKET, 2022-2032 ($MILLION)
- FIGURE 39. AUSTRALIA ASSET FINANCE SOFTWARE MARKET, 2022-2032 ($MILLION)
- FIGURE 40. SOUTH KOREA ASSET FINANCE SOFTWARE MARKET, 2022-2032 ($MILLION)
- FIGURE 41. REST OF ASIA-PACIFIC ASSET FINANCE SOFTWARE MARKET, 2022-2032 ($MILLION)
- FIGURE 42. LATIN AMERICA ASSET FINANCE SOFTWARE MARKET, 2022-2032 ($MILLION)
- FIGURE 43. MIDDLE EAST ASSET FINANCE SOFTWARE MARKET, 2022-2032 ($MILLION)
- FIGURE 44. AFRICA ASSET FINANCE SOFTWARE MARKET, 2022-2032 ($MILLION)
- FIGURE 45. TOP WINNING STRATEGIES, BY YEAR (2020-2023)
- FIGURE 46. TOP WINNING STRATEGIES, BY DEVELOPMENT (2020-2023)
- FIGURE 47. TOP WINNING STRATEGIES, BY COMPANY (2020-2023)
- FIGURE 48. PRODUCT MAPPING OF TOP 10 PLAYERS
- FIGURE 49. COMPETITIVE DASHBOARD
- FIGURE 50. COMPETITIVE HEATMAP: ASSET FINANCE SOFTWARE MARKET
- FIGURE 51. TOP PLAYER POSITIONING, 2022
- FIGURE 52. FIS: NET REVENUE, 2020-2022 ($MILLION)
- FIGURE 53. FIS: REVENUE SHARE BY SEGMENT, 2022 (%)
- FIGURE 54. FIS: REVENUE SHARE BY REGION, 2022 (%)
- FIGURE 55. NETSOL TECHNOLOGIES: NET REVENUE, 2020-2022 ($MILLION)
- FIGURE 56. NETSOL TECHNOLOGIES: REVENUE SHARE BY REGION, 2022 (%)
- FIGURE 57. ALFA FINANCIAL SOFTWARE LIMITED: NET REVENUE, 2020-2022 ($MILLION)
- FIGURE 58. ALFA FINANCIAL SOFTWARE LIMITED: REVENUE SHARE BY SEGMENT, 2022 (%)
- FIGURE 59. ALFA FINANCIAL SOFTWARE LIMITED: REVENUE SHARE BY REGION, 2022 (%)
- FIGURE 60. CGI INC.: NET REVENUE, 2020-2022 ($MILLION)
- FIGURE 61. ORACLE CORPORATION: NET REVENUE, 2020-2022 ($MILLION)
- FIGURE 62. ORACLE CORPORATION: RESEARCH & DEVELOPMENT EXPENDITURE, 2020-2022 ($MILLION)
- FIGURE 63. ORACLE CORPORATION: REVENUE SHARE BY SEGMENT, 2022 (%)
- FIGURE 64. ORACLE CORPORATION: REVENUE SHARE BY REGION, 2022 (%)
According to a new report published by Allied Market Research, titled, "Asset Finance Software Market," The asset finance software market was valued at $3.8 billion in 2022, and is estimated to reach $11.1 billion by 2032, growing at a CAGR of 11.5% from 2023 to 2032.
One of the key drivers of the asset finance software market is rise in demand for streamlined financial operations among businesses to efficiently manage their assets, optimize resource allocation, and improve overall financial planning and reporting. Furthermore, asset management processes are being automated to help track and manage assets throughout their lifecycle, which provides real-time visibility and data insights. Thus, this factor drives adoption of asset finance software and propels the market growth. In addition, the need for improved risk assessment and compliance measures propels the growth of the asset finance software market by prompting businesses to seek advanced solutions that can effectively manage and mitigate risks associated with lending and asset management. However, data privacy and security concerns hamper the growth of the asset finance software market by affecting customer trust and confidence. Moreover, asset finance software allows customers to purchase assets and aids in managing them and the installation costs of these software are high and require professionals to complete the tasks that hamper the asset finance software market growth. However, the integration of technologies in the asset finance software is expected to provide lucrative growth opportunities to the asset finance software market in the upcoming years.
The asset finance software market is segmented into asset type, deployment mode, enterprise size, end user, and region. By asset type, the market is differentiated into hard assets and soft assets. Depending on deployment mode, it is fragmented into on-premise and cloud. By enterprise size, the market is divided into large enterprises and small and medium-sized enterprises. By end user, the market is divided into banks, transportation, IT and related services, construction, healthcare, agriculture, and others. Region-wise, the market is segmented into North America, Europe, Asia-Pacific, and LAMEA.
The key players operating in the asset finance software market include Odessa, FIS, NETSOL Technologies, Alfa Financial Software Limited, Banqsoft, CGI Inc., Lendscape Limited, ieDigital, Oracle, and CHG-MERIDIAN. These players have adopted various strategies to increase their market penetration and strengthen their position in the asset finance software industry.
Key Benefits for Stakeholders
- The study provides in-depth analysis of the asset finance software market along with current trends and future estimations to illustrate the imminent investment pockets.
- Information about key drivers, restrains, & opportunities and their impact analysis on the Asset finance software market size are provided in the report.
- The Porter's five forces analysis illustrates the potency of buyers and suppliers operating in the industry.
- The quantitative analysis of the asset finance software market from 2022 to 2032 is provided to determine the market potential.
Additional benefits you will get with this purchase are:
- Quarterly Update and* (only available with a corporate license, on listed price)
- 5 additional Company Profile of client Choice pre- or Post-purchase, as a free update.
- Free Upcoming Version on the Purchase of Five and Enterprise User License.
- 16 analyst hours of support* (post-purchase, if you find additional data requirements upon review of the report, you may receive support amounting to 16 analyst hours to solve questions, and post-sale queries)
- 15% Free Customization* (in case the scope or segment of the report does not match your requirements, 20% is equivalent to 3 working days of free work, applicable once)
- Free data Pack on the Five and Enterprise User License. (Excel version of the report)
- Free Updated report if the report is 6-12 months old or older.
- 24-hour priority response*
- Free Industry updates and white papers.
Possible Customization with this report (with additional cost and timeline talk to the sales executive to know more)
- Investment Opportunities
- Market share analysis of players by products/segments
- Regulatory Guidelines
- Additional company profiles with specific to client's interest
- Additional country or region analysis- market size and forecast
- Expanded list for Company Profiles
- Market share analysis of players at global/region/country level
Key Market Segments
By Asset Type
- Hard Assets
- Soft Assets
By Deployment Mode
- On-premise
- Cloud
By Enterprise Size
- Large Enterprises
- Small and Medium-sized Enterprises
By End User
- Banks
- Transportation
- IT and Related Services
- Construction
- Healthcare
- Agriculture
- Others
By Region
- North America
- U.S.
- Canada
- Europe
- UK
- Germany
- France
- Italy
- Spain
- Rest of Europe
- Asia-Pacific
- China
- Japan
- India
- Australia
- South Korea
- Rest of Asia-Pacific
- LAMEA
- Latin America
- Middle East
- Africa
Key Market Players:
- Oracle Corporation
- CGI Inc.
- NetSol Technologies
- Lendscape Limited
- Odessa
- Banqsoft
- FIS
- CHG-MERIDIAN
- ieDigital
- Alfa Financial Software Limited
TABLE OF CONTENTS
CHAPTER 1: INTRODUCTION
- 1.1. Report description
- 1.2. Key market segments
- 1.3. Key benefits to the stakeholders
- 1.4. Research Methodology
- 1.4.1. Primary research
- 1.4.2. Secondary research
- 1.4.3. Analyst tools and models
CHAPTER 2: EXECUTIVE SUMMARY
- 2.1. CXO Perspective
CHAPTER 3: MARKET OVERVIEW
- 3.1. Market definition and scope
- 3.2. Key findings
- 3.2.1. Top impacting factors
- 3.2.2. Top investment pockets
- 3.3. Porter's five forces analysis
- 3.3.1. Low bargaining power of suppliers
- 3.3.2. Low threat of new entrants
- 3.3.3. Low threat of substitutes
- 3.3.4. Low intensity of rivalry
- 3.3.5. Low bargaining power of buyers
- 3.4. Market dynamics
- 3.4.1. Drivers
- 3.4.1.1. Increase in demand for streamlined financial operations
- 3.4.1.2. Automation of asset management processes
- 3.4.1.3. Need for improved risk assessment and compliance measures
- 3.4.2. Restraints
- 3.4.2.1. Data privacy and security concerns
- 3.4.2.2. High installation cost of the software
- 3.4.3. Opportunities
- 3.4.3.1. Adoption of technology in financial processes
- 3.4.1. Drivers
CHAPTER 4: ASSET FINANCE SOFTWARE MARKET, BY ASSET TYPE
- 4.1. Overview
- 4.1.1. Market size and forecast
- 4.2. Hard Assets
- 4.2.1. Key market trends, growth factors and opportunities
- 4.2.2. Market size and forecast, by region
- 4.2.3. Market share analysis by country
- 4.3. Soft Assets
- 4.3.1. Key market trends, growth factors and opportunities
- 4.3.2. Market size and forecast, by region
- 4.3.3. Market share analysis by country
CHAPTER 5: ASSET FINANCE SOFTWARE MARKET, BY DEPLOYMENT MODE
- 5.1. Overview
- 5.1.1. Market size and forecast
- 5.2. On-premise
- 5.2.1. Key market trends, growth factors and opportunities
- 5.2.2. Market size and forecast, by region
- 5.2.3. Market share analysis by country
- 5.3. Cloud
- 5.3.1. Key market trends, growth factors and opportunities
- 5.3.2. Market size and forecast, by region
- 5.3.3. Market share analysis by country
CHAPTER 6: ASSET FINANCE SOFTWARE MARKET, BY ENTERPRISE SIZE
- 6.1. Overview
- 6.1.1. Market size and forecast
- 6.2. Large Enterprises
- 6.2.1. Key market trends, growth factors and opportunities
- 6.2.2. Market size and forecast, by region
- 6.2.3. Market share analysis by country
- 6.3. Small and Medium-sized Enterprises
- 6.3.1. Key market trends, growth factors and opportunities
- 6.3.2. Market size and forecast, by region
- 6.3.3. Market share analysis by country
CHAPTER 7: ASSET FINANCE SOFTWARE MARKET, BY END USER
- 7.1. Overview
- 7.1.1. Market size and forecast
- 7.2. Banks
- 7.2.1. Key market trends, growth factors and opportunities
- 7.2.2. Market size and forecast, by region
- 7.2.3. Market share analysis by country
- 7.3. Transportation
- 7.3.1. Key market trends, growth factors and opportunities
- 7.3.2. Market size and forecast, by region
- 7.3.3. Market share analysis by country
- 7.4. IT and Related Services
- 7.4.1. Key market trends, growth factors and opportunities
- 7.4.2. Market size and forecast, by region
- 7.4.3. Market share analysis by country
- 7.5. Construction
- 7.5.1. Key market trends, growth factors and opportunities
- 7.5.2. Market size and forecast, by region
- 7.5.3. Market share analysis by country
- 7.6. Healthcare
- 7.6.1. Key market trends, growth factors and opportunities
- 7.6.2. Market size and forecast, by region
- 7.6.3. Market share analysis by country
- 7.7. Agriculture
- 7.7.1. Key market trends, growth factors and opportunities
- 7.7.2. Market size and forecast, by region
- 7.7.3. Market share analysis by country
- 7.8. Others
- 7.8.1. Key market trends, growth factors and opportunities
- 7.8.2. Market size and forecast, by region
- 7.8.3. Market share analysis by country
CHAPTER 8: ASSET FINANCE SOFTWARE MARKET, BY REGION
- 8.1. Overview
- 8.1.1. Market size and forecast By Region
- 8.2. North America
- 8.2.1. Key market trends, growth factors and opportunities
- 8.2.2. Market size and forecast, by Asset Type
- 8.2.3. Market size and forecast, by Deployment Mode
- 8.2.4. Market size and forecast, by Enterprise Size
- 8.2.5. Market size and forecast, by End User
- 8.2.6. Market size and forecast, by country
- 8.2.6.1. U.S.
- 8.2.6.1.1. Market size and forecast, by Asset Type
- 8.2.6.1.2. Market size and forecast, by Deployment Mode
- 8.2.6.1.3. Market size and forecast, by Enterprise Size
- 8.2.6.1.4. Market size and forecast, by End User
- 8.2.6.2. Canada
- 8.2.6.2.1. Market size and forecast, by Asset Type
- 8.2.6.2.2. Market size and forecast, by Deployment Mode
- 8.2.6.2.3. Market size and forecast, by Enterprise Size
- 8.2.6.2.4. Market size and forecast, by End User
- 8.3. Europe
- 8.3.1. Key market trends, growth factors and opportunities
- 8.3.2. Market size and forecast, by Asset Type
- 8.3.3. Market size and forecast, by Deployment Mode
- 8.3.4. Market size and forecast, by Enterprise Size
- 8.3.5. Market size and forecast, by End User
- 8.3.6. Market size and forecast, by country
- 8.3.6.1. UK
- 8.3.6.1.1. Market size and forecast, by Asset Type
- 8.3.6.1.2. Market size and forecast, by Deployment Mode
- 8.3.6.1.3. Market size and forecast, by Enterprise Size
- 8.3.6.1.4. Market size and forecast, by End User
- 8.3.6.2. Germany
- 8.3.6.2.1. Market size and forecast, by Asset Type
- 8.3.6.2.2. Market size and forecast, by Deployment Mode
- 8.3.6.2.3. Market size and forecast, by Enterprise Size
- 8.3.6.2.4. Market size and forecast, by End User
- 8.3.6.3. France
- 8.3.6.3.1. Market size and forecast, by Asset Type
- 8.3.6.3.2. Market size and forecast, by Deployment Mode
- 8.3.6.3.3. Market size and forecast, by Enterprise Size
- 8.3.6.3.4. Market size and forecast, by End User
- 8.3.6.4. Italy
- 8.3.6.4.1. Market size and forecast, by Asset Type
- 8.3.6.4.2. Market size and forecast, by Deployment Mode
- 8.3.6.4.3. Market size and forecast, by Enterprise Size
- 8.3.6.4.4. Market size and forecast, by End User
- 8.3.6.5. Spain
- 8.3.6.5.1. Market size and forecast, by Asset Type
- 8.3.6.5.2. Market size and forecast, by Deployment Mode
- 8.3.6.5.3. Market size and forecast, by Enterprise Size
- 8.3.6.5.4. Market size and forecast, by End User
- 8.3.6.6. Rest of Europe
- 8.3.6.6.1. Market size and forecast, by Asset Type
- 8.3.6.6.2. Market size and forecast, by Deployment Mode
- 8.3.6.6.3. Market size and forecast, by Enterprise Size
- 8.3.6.6.4. Market size and forecast, by End User
- 8.4. Asia-Pacific
- 8.4.1. Key market trends, growth factors and opportunities
- 8.4.2. Market size and forecast, by Asset Type
- 8.4.3. Market size and forecast, by Deployment Mode
- 8.4.4. Market size and forecast, by Enterprise Size
- 8.4.5. Market size and forecast, by End User
- 8.4.6. Market size and forecast, by country
- 8.4.6.1. China
- 8.4.6.1.1. Market size and forecast, by Asset Type
- 8.4.6.1.2. Market size and forecast, by Deployment Mode
- 8.4.6.1.3. Market size and forecast, by Enterprise Size
- 8.4.6.1.4. Market size and forecast, by End User
- 8.4.6.2. Japan
- 8.4.6.2.1. Market size and forecast, by Asset Type
- 8.4.6.2.2. Market size and forecast, by Deployment Mode
- 8.4.6.2.3. Market size and forecast, by Enterprise Size
- 8.4.6.2.4. Market size and forecast, by End User
- 8.4.6.3. India
- 8.4.6.3.1. Market size and forecast, by Asset Type
- 8.4.6.3.2. Market size and forecast, by Deployment Mode
- 8.4.6.3.3. Market size and forecast, by Enterprise Size
- 8.4.6.3.4. Market size and forecast, by End User
- 8.4.6.4. Australia
- 8.4.6.4.1. Market size and forecast, by Asset Type
- 8.4.6.4.2. Market size and forecast, by Deployment Mode
- 8.4.6.4.3. Market size and forecast, by Enterprise Size
- 8.4.6.4.4. Market size and forecast, by End User
- 8.4.6.5. South Korea
- 8.4.6.5.1. Market size and forecast, by Asset Type
- 8.4.6.5.2. Market size and forecast, by Deployment Mode
- 8.4.6.5.3. Market size and forecast, by Enterprise Size
- 8.4.6.5.4. Market size and forecast, by End User
- 8.4.6.6. Rest of Asia-Pacific
- 8.4.6.6.1. Market size and forecast, by Asset Type
- 8.4.6.6.2. Market size and forecast, by Deployment Mode
- 8.4.6.6.3. Market size and forecast, by Enterprise Size
- 8.4.6.6.4. Market size and forecast, by End User
- 8.5. LAMEA
- 8.5.1. Key market trends, growth factors and opportunities
- 8.5.2. Market size and forecast, by Asset Type
- 8.5.3. Market size and forecast, by Deployment Mode
- 8.5.4. Market size and forecast, by Enterprise Size
- 8.5.5. Market size and forecast, by End User
- 8.5.6. Market size and forecast, by country
- 8.5.6.1. Latin America
- 8.5.6.1.1. Market size and forecast, by Asset Type
- 8.5.6.1.2. Market size and forecast, by Deployment Mode
- 8.5.6.1.3. Market size and forecast, by Enterprise Size
- 8.5.6.1.4. Market size and forecast, by End User
- 8.5.6.2. Middle East
- 8.5.6.2.1. Market size and forecast, by Asset Type
- 8.5.6.2.2. Market size and forecast, by Deployment Mode
- 8.5.6.2.3. Market size and forecast, by Enterprise Size
- 8.5.6.2.4. Market size and forecast, by End User
- 8.5.6.3. Africa
- 8.5.6.3.1. Market size and forecast, by Asset Type
- 8.5.6.3.2. Market size and forecast, by Deployment Mode
- 8.5.6.3.3. Market size and forecast, by Enterprise Size
- 8.5.6.3.4. Market size and forecast, by End User
CHAPTER 9: COMPETITIVE LANDSCAPE
- 9.1. Introduction
- 9.2. Top winning strategies
- 9.3. Product Mapping of Top 10 Player
- 9.4. Competitive Dashboard
- 9.5. Competitive Heatmap
- 9.6. Top player positioning, 2022
CHAPTER 10: COMPANY PROFILES
- 10.1. Odessa
- 10.1.1. Company overview
- 10.1.2. Key Executives
- 10.1.3. Company snapshot
- 10.1.4. Operating business segments
- 10.1.5. Product portfolio
- 10.1.6. Key strategic moves and developments
- 10.2. FIS
- 10.2.1. Company overview
- 10.2.2. Key Executives
- 10.2.3. Company snapshot
- 10.2.4. Operating business segments
- 10.2.5. Product portfolio
- 10.2.6. Business performance
- 10.2.7. Key strategic moves and developments
- 10.3. NetSol Technologies
- 10.3.1. Company overview
- 10.3.2. Key Executives
- 10.3.3. Company snapshot
- 10.3.4. Operating business segments
- 10.3.5. Product portfolio
- 10.3.6. Business performance
- 10.3.7. Key strategic moves and developments
- 10.4. Alfa Financial Software Limited
- 10.4.1. Company overview
- 10.4.2. Key Executives
- 10.4.3. Company snapshot
- 10.4.4. Operating business segments
- 10.4.5. Product portfolio
- 10.4.6. Business performance
- 10.4.7. Key strategic moves and developments
- 10.5. Banqsoft
- 10.5.1. Company overview
- 10.5.2. Key Executives
- 10.5.3. Company snapshot
- 10.5.4. Operating business segments
- 10.5.5. Product portfolio
- 10.5.6. Key strategic moves and developments
- 10.6. CGI Inc.
- 10.6.1. Company overview
- 10.6.2. Key Executives
- 10.6.3. Company snapshot
- 10.6.4. Operating business segments
- 10.6.5. Product portfolio
- 10.6.6. Business performance
- 10.6.7. Key strategic moves and developments
- 10.7. Lendscape Limited
- 10.7.1. Company overview
- 10.7.2. Key Executives
- 10.7.3. Company snapshot
- 10.7.4. Operating business segments
- 10.7.5. Product portfolio
- 10.7.6. Key strategic moves and developments
- 10.8. ieDigital
- 10.8.1. Company overview
- 10.8.2. Key Executives
- 10.8.3. Company snapshot
- 10.8.4. Operating business segments
- 10.8.5. Product portfolio
- 10.8.6. Key strategic moves and developments
- 10.9. CHG-MERIDIAN
- 10.9.1. Company overview
- 10.9.2. Key Executives
- 10.9.3. Company snapshot
- 10.9.4. Operating business segments
- 10.9.5. Product portfolio
- 10.9.6. Key strategic moves and developments
- 10.10. Oracle Corporation
- 10.10.1. Company overview
- 10.10.2. Key Executives
- 10.10.3. Company snapshot
- 10.10.4. Operating business segments
- 10.10.5. Product portfolio
- 10.10.6. Business performance
- 10.10.7. Key strategic moves and developments
