
|
市場調査レポート
商品コード
1365641
パイプ断熱材市場:材料別、用途別:世界の機会分析と産業予測、2023~2032年Pipe Insulation Market By Material, By Application : Global Opportunity Analysis and Industry Forecast, 2023-2032 |
||||||
|
|||||||

| パイプ断熱材市場:材料別、用途別:世界の機会分析と産業予測、2023~2032年 |
|
出版日: 2023年07月01日
発行: Allied Market Research
ページ情報: 英文 253 Pages
納期: 2~3営業日
|

- 全表示
- 概要
- 図表
- 目次
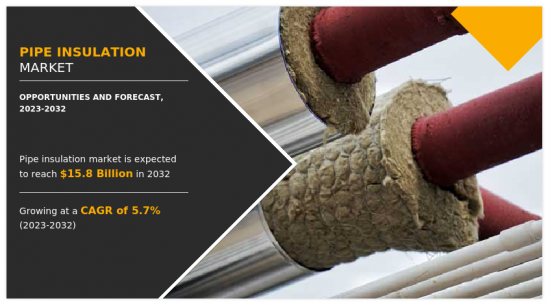
パイプ断熱材市場は2022年に91億米ドルと評価され、2023年から2032年にかけてCAGR 5.7%で成長し、2032年には158億米ドルに達すると推定されます。
パイプ断熱材は、熱伝導を低減し、パイプ内で輸送される流体の所望の温度を維持し、エネルギーの損失または利得を防止するためにパイプの周囲に適用される保護材料です。エネルギー効率の向上、温室効果ガスの排出削減、結露の防止を目的として、様々な産業、建物、インフラで一般的に使用されています。
パイプ断熱材の主な目的は、高温の流体を輸送する際の熱損失を最小限に抑え、低温の流体を輸送する際の熱上昇を防ぐことです。パイプを断熱することで、エネルギーを節約し、運転コストを削減し、システム全体の性能を向上させることができます。熱伝導を最小限に抑えることで、パイプ断熱材は、腐食やカビの発生につながるパイプ外面の結露も防ぐことができます。
世界のパイプ断熱材市場は現在、主に様々な産業におけるエネルギー効率、持続可能性、断熱に対する需要の増加により、大幅な成長を遂げています。温室効果ガスの排出とエネルギー消費の削減を目的とした厳しい規制と政策により、産業界は効果的な断熱ソリューションの採用を余儀なくされています。さらに、エネルギーの浪費を最小限に抑え、コスト削減を達成する必要性が、市場拡大の原動力となっています。
特に建設部門は、住宅や商業用建物の需要の高まりや世界のインフラ開発プロジェクトに後押しされ、市場の推進に重要な役割を果たしています。しかし、高度な断熱材のコストが高いことや、断熱材の長期的なメリットに関する認識が低いことが、市場成長の妨げになる可能性があります。さらに、代替断熱材の入手可能性や、既存インフラの断熱改修に伴う複雑さからも課題が生じる。
目次
第1章 イントロダクション
第2章 エグゼクティブサマリー
第3章 市場概要
- 市場の定義と範囲
- 主な調査結果
- 影響要因
- 主な投資機会
- ポーターのファイブフォース分析
- 市場力学
- 促進要因
- 様々な最終用途産業におけるパイプ断熱材の有利な使用
- 産業インフラ開発の増加
- 抑制要因
- 原材料価格の変動
- 機会
- 持続可能で環境に優しい断熱材の入手可能性
- 促進要因
- COVID-19市場への影響分析
- 特許情勢
- 主要規制分析
第4章 パイプ断熱材市場:材料別
- 概要
- ガラス繊維
- ロックウール
- ケイ酸塩
- ポリウレタン
- ゴム発泡体
- その他
第5章 パイプ断熱材市場:用途別
- 概要
- 建築・建設
- 石油・ガス
- 運輸
- 一般産業用
- その他
第6章 パイプ断熱材市場:地域別
- 概要
- 北米
- 米国
- カナダ
- メキシコ
- 欧州
- ドイツ
- 英国
- フランス
- イタリア
- スペイン
- その他
- アジア太平洋
- 中国
- 日本
- インド
- 韓国
- オーストラリア
- その他
- ラテンアメリカ・中東・アフリカ
- ブラジル
- 南アフリカ
- サウジアラビア
- その他
第7章 競合情勢
- イントロダクション
- 主要成功戦略
- 主要10社の製品マッピング
- 競合ダッシュボード
- 競合ヒートマップ
- 主要企業のポジショニング、2022年
第8章 企業プロファイル
- Dow
- Saint-Gobain
- BASF SE
- Johns Manville
- Owens Corning
- Kingspan Group
- Huntsman International LLC
- Armacell
- Knauf Insulation
- Lydall, Inc.
LIST OF TABLES
- TABLE 01. GLOBAL PIPE INSULATION MARKET, BY MATERIAL, 2022-2032 ($MILLION)
- TABLE 02. PIPE INSULATION MARKET FOR FIBERGLASS, BY REGION, 2022-2032 ($MILLION)
- TABLE 03. PIPE INSULATION MARKET FOR ROCKWOOL, BY REGION, 2022-2032 ($MILLION)
- TABLE 04. PIPE INSULATION MARKET FOR SILICATES, BY REGION, 2022-2032 ($MILLION)
- TABLE 05. PIPE INSULATION MARKET FOR POLYURETHANE, BY REGION, 2022-2032 ($MILLION)
- TABLE 06. PIPE INSULATION MARKET FOR RUBBER FOAMS, BY REGION, 2022-2032 ($MILLION)
- TABLE 07. PIPE INSULATION MARKET FOR OTHERS, BY REGION, 2022-2032 ($MILLION)
- TABLE 08. GLOBAL PIPE INSULATION MARKET, BY APPLICATION, 2022-2032 ($MILLION)
- TABLE 09. PIPE INSULATION MARKET FOR BUILDINGS AND CONSTRUCTION, BY REGION, 2022-2032 ($MILLION)
- TABLE 10. PIPE INSULATION MARKET FOR OIL AND GAS, BY REGION, 2022-2032 ($MILLION)
- TABLE 11. PIPE INSULATION MARKET FOR TRANSPORTATION, BY REGION, 2022-2032 ($MILLION)
- TABLE 12. PIPE INSULATION MARKET FOR GENERAL INDUSTRIAL, BY REGION, 2022-2032 ($MILLION)
- TABLE 13. PIPE INSULATION MARKET FOR OTHERS, BY REGION, 2022-2032 ($MILLION)
- TABLE 14. PIPE INSULATION MARKET, BY REGION, 2022-2032 ($MILLION)
- TABLE 15. NORTH AMERICA PIPE INSULATION MARKET, BY MATERIAL, 2022-2032 ($MILLION)
- TABLE 16. NORTH AMERICA PIPE INSULATION MARKET, BY APPLICATION, 2022-2032 ($MILLION)
- TABLE 17. NORTH AMERICA PIPE INSULATION MARKET, BY COUNTRY, 2022-2032 ($MILLION)
- TABLE 18. U.S. PIPE INSULATION MARKET, BY MATERIAL, 2022-2032 ($MILLION)
- TABLE 19. U.S. PIPE INSULATION MARKET, BY APPLICATION, 2022-2032 ($MILLION)
- TABLE 20. CANADA PIPE INSULATION MARKET, BY MATERIAL, 2022-2032 ($MILLION)
- TABLE 21. CANADA PIPE INSULATION MARKET, BY APPLICATION, 2022-2032 ($MILLION)
- TABLE 22. MEXICO PIPE INSULATION MARKET, BY MATERIAL, 2022-2032 ($MILLION)
- TABLE 23. MEXICO PIPE INSULATION MARKET, BY APPLICATION, 2022-2032 ($MILLION)
- TABLE 24. EUROPE PIPE INSULATION MARKET, BY MATERIAL, 2022-2032 ($MILLION)
- TABLE 25. EUROPE PIPE INSULATION MARKET, BY APPLICATION, 2022-2032 ($MILLION)
- TABLE 26. EUROPE PIPE INSULATION MARKET, BY COUNTRY, 2022-2032 ($MILLION)
- TABLE 27. GERMANY PIPE INSULATION MARKET, BY MATERIAL, 2022-2032 ($MILLION)
- TABLE 28. GERMANY PIPE INSULATION MARKET, BY APPLICATION, 2022-2032 ($MILLION)
- TABLE 29. UK PIPE INSULATION MARKET, BY MATERIAL, 2022-2032 ($MILLION)
- TABLE 30. UK PIPE INSULATION MARKET, BY APPLICATION, 2022-2032 ($MILLION)
- TABLE 31. FRANCE PIPE INSULATION MARKET, BY MATERIAL, 2022-2032 ($MILLION)
- TABLE 32. FRANCE PIPE INSULATION MARKET, BY APPLICATION, 2022-2032 ($MILLION)
- TABLE 33. ITALY PIPE INSULATION MARKET, BY MATERIAL, 2022-2032 ($MILLION)
- TABLE 34. ITALY PIPE INSULATION MARKET, BY APPLICATION, 2022-2032 ($MILLION)
- TABLE 35. SPAIN PIPE INSULATION MARKET, BY MATERIAL, 2022-2032 ($MILLION)
- TABLE 36. SPAIN PIPE INSULATION MARKET, BY APPLICATION, 2022-2032 ($MILLION)
- TABLE 37. REST OF EUROPE PIPE INSULATION MARKET, BY MATERIAL, 2022-2032 ($MILLION)
- TABLE 38. REST OF EUROPE PIPE INSULATION MARKET, BY APPLICATION, 2022-2032 ($MILLION)
- TABLE 39. ASIA-PACIFIC PIPE INSULATION MARKET, BY MATERIAL, 2022-2032 ($MILLION)
- TABLE 40. ASIA-PACIFIC PIPE INSULATION MARKET, BY APPLICATION, 2022-2032 ($MILLION)
- TABLE 41. ASIA-PACIFIC PIPE INSULATION MARKET, BY COUNTRY, 2022-2032 ($MILLION)
- TABLE 42. CHINA PIPE INSULATION MARKET, BY MATERIAL, 2022-2032 ($MILLION)
- TABLE 43. CHINA PIPE INSULATION MARKET, BY APPLICATION, 2022-2032 ($MILLION)
- TABLE 44. JAPAN PIPE INSULATION MARKET, BY MATERIAL, 2022-2032 ($MILLION)
- TABLE 45. JAPAN PIPE INSULATION MARKET, BY APPLICATION, 2022-2032 ($MILLION)
- TABLE 46. INDIA PIPE INSULATION MARKET, BY MATERIAL, 2022-2032 ($MILLION)
- TABLE 47. INDIA PIPE INSULATION MARKET, BY APPLICATION, 2022-2032 ($MILLION)
- TABLE 48. SOUTH KOREA PIPE INSULATION MARKET, BY MATERIAL, 2022-2032 ($MILLION)
- TABLE 49. SOUTH KOREA PIPE INSULATION MARKET, BY APPLICATION, 2022-2032 ($MILLION)
- TABLE 50. AUSTRALIA PIPE INSULATION MARKET, BY MATERIAL, 2022-2032 ($MILLION)
- TABLE 51. AUSTRALIA PIPE INSULATION MARKET, BY APPLICATION, 2022-2032 ($MILLION)
- TABLE 52. REST OF ASIA-PACIFIC PIPE INSULATION MARKET, BY MATERIAL, 2022-2032 ($MILLION)
- TABLE 53. REST OF ASIA-PACIFIC PIPE INSULATION MARKET, BY APPLICATION, 2022-2032 ($MILLION)
- TABLE 54. LAMEA PIPE INSULATION MARKET, BY MATERIAL, 2022-2032 ($MILLION)
- TABLE 55. LAMEA PIPE INSULATION MARKET, BY APPLICATION, 2022-2032 ($MILLION)
- TABLE 56. LAMEA PIPE INSULATION MARKET, BY COUNTRY, 2022-2032 ($MILLION)
- TABLE 57. BRAZIL PIPE INSULATION MARKET, BY MATERIAL, 2022-2032 ($MILLION)
- TABLE 58. BRAZIL PIPE INSULATION MARKET, BY APPLICATION, 2022-2032 ($MILLION)
- TABLE 59. SOUTH AFRICA, PIPE INSULATION MARKET, BY MATERIAL, 2022-2032 ($MILLION)
- TABLE 60. SOUTH AFRICA, PIPE INSULATION MARKET, BY APPLICATION, 2022-2032 ($MILLION)
- TABLE 61. SAUDI ARABIA PIPE INSULATION MARKET, BY MATERIAL, 2022-2032 ($MILLION)
- TABLE 62. SAUDI ARABIA PIPE INSULATION MARKET, BY APPLICATION, 2022-2032 ($MILLION)
- TABLE 63. REST OF LAMEA PIPE INSULATION MARKET, BY MATERIAL, 2022-2032 ($MILLION)
- TABLE 64. REST OF LAMEA PIPE INSULATION MARKET, BY APPLICATION, 2022-2032 ($MILLION)
- TABLE 65. DOW: KEY EXECUTIVES
- TABLE 66. DOW: COMPANY SNAPSHOT
- TABLE 67. DOW: PRODUCT SEGMENTS
- TABLE 68. DOW: PRODUCT PORTFOLIO
- TABLE 69. SAINT-GOBAIN: KEY EXECUTIVES
- TABLE 70. SAINT-GOBAIN: COMPANY SNAPSHOT
- TABLE 71. SAINT-GOBAIN: PRODUCT SEGMENTS
- TABLE 72. SAINT-GOBAIN: PRODUCT PORTFOLIO
- TABLE 73. SAINT-GOBAIN: KEY STRATERGIES
- TABLE 74. BASF SE: KEY EXECUTIVES
- TABLE 75. BASF SE: COMPANY SNAPSHOT
- TABLE 76. BASF SE: PRODUCT SEGMENTS
- TABLE 77. BASF SE: PRODUCT PORTFOLIO
- TABLE 78. BASF SE: KEY STRATERGIES
- TABLE 79. JOHNS MANVILLE: KEY EXECUTIVES
- TABLE 80. JOHNS MANVILLE: COMPANY SNAPSHOT
- TABLE 81. JOHNS MANVILLE: PRODUCT SEGMENTS
- TABLE 82. JOHNS MANVILLE: PRODUCT PORTFOLIO
- TABLE 83. OWENS CORNING: KEY EXECUTIVES
- TABLE 84. OWENS CORNING: COMPANY SNAPSHOT
- TABLE 85. OWENS CORNING: PRODUCT SEGMENTS
- TABLE 86. OWENS CORNING: PRODUCT PORTFOLIO
- TABLE 87. KINGSPAN GROUP: KEY EXECUTIVES
- TABLE 88. KINGSPAN GROUP: COMPANY SNAPSHOT
- TABLE 89. KINGSPAN GROUP: PRODUCT SEGMENTS
- TABLE 90. KINGSPAN GROUP: PRODUCT PORTFOLIO
- TABLE 91. HUNTSMAN INTERNATIONAL LLC: KEY EXECUTIVES
- TABLE 92. HUNTSMAN INTERNATIONAL LLC: COMPANY SNAPSHOT
- TABLE 93. HUNTSMAN INTERNATIONAL LLC: PRODUCT SEGMENTS
- TABLE 94. HUNTSMAN INTERNATIONAL LLC: PRODUCT PORTFOLIO
- TABLE 95. ARMACELL: KEY EXECUTIVES
- TABLE 96. ARMACELL: COMPANY SNAPSHOT
- TABLE 97. ARMACELL: PRODUCT SEGMENTS
- TABLE 98. ARMACELL: PRODUCT PORTFOLIO
- TABLE 99. ARMACELL: KEY STRATERGIES
- TABLE 100. KNAUF INSULATION: KEY EXECUTIVES
- TABLE 101. KNAUF INSULATION: COMPANY SNAPSHOT
- TABLE 102. KNAUF INSULATION: PRODUCT SEGMENTS
- TABLE 103. KNAUF INSULATION: PRODUCT PORTFOLIO
- TABLE 104. KNAUF INSULATION: KEY STRATERGIES
- TABLE 105. LYDALL, INC.: KEY EXECUTIVES
- TABLE 106. LYDALL, INC.: COMPANY SNAPSHOT
- TABLE 107. LYDALL, INC.: PRODUCT SEGMENTS
- TABLE 108. LYDALL, INC.: PRODUCT PORTFOLIO
LIST OF FIGURES
- FIGURE 01. PIPE INSULATION MARKET, 2022-2032
- FIGURE 02. SEGMENTATION OF PIPE INSULATION MARKET,2022-2032
- FIGURE 03. TOP INVESTMENT POCKETS IN PIPE INSULATION MARKET (2023-2032)
- FIGURE 04. LOW BARGAINING POWER OF SUPPLIERS
- FIGURE 05. LOW THREAT OF NEW ENTRANTS
- FIGURE 06. LOW THREAT OF SUBSTITUTES
- FIGURE 07. LOW INTENSITY OF RIVALRY
- FIGURE 08. LOW BARGAINING POWER OF BUYERS
- FIGURE 09. GLOBAL PIPE INSULATION MARKET:DRIVERS, RESTRAINTS AND OPPORTUNITIES
- FIGURE 10. PATENT ANALYSIS BY COMPANY
- FIGURE 11. PATENT ANALYSIS BY COUNTRY
- FIGURE 12. IMPACT OF KEY REGULATION: PIPE INSULATION MARKET
- FIGURE 13. PIPE INSULATION MARKET, BY MATERIAL, 2022(%)
- FIGURE 14. COMPARATIVE SHARE ANALYSIS OF PIPE INSULATION MARKET FOR FIBERGLASS, BY COUNTRY 2022 AND 2032(%)
- FIGURE 15. COMPARATIVE SHARE ANALYSIS OF PIPE INSULATION MARKET FOR ROCKWOOL, BY COUNTRY 2022 AND 2032(%)
- FIGURE 16. COMPARATIVE SHARE ANALYSIS OF PIPE INSULATION MARKET FOR SILICATES, BY COUNTRY 2022 AND 2032(%)
- FIGURE 17. COMPARATIVE SHARE ANALYSIS OF PIPE INSULATION MARKET FOR POLYURETHANE, BY COUNTRY 2022 AND 2032(%)
- FIGURE 18. COMPARATIVE SHARE ANALYSIS OF PIPE INSULATION MARKET FOR RUBBER FOAMS, BY COUNTRY 2022 AND 2032(%)
- FIGURE 19. COMPARATIVE SHARE ANALYSIS OF PIPE INSULATION MARKET FOR OTHERS, BY COUNTRY 2022 AND 2032(%)
- FIGURE 20. PIPE INSULATION MARKET, BY APPLICATION, 2022(%)
- FIGURE 21. COMPARATIVE SHARE ANALYSIS OF PIPE INSULATION MARKET FOR BUILDINGS AND CONSTRUCTION, BY COUNTRY 2022 AND 2032(%)
- FIGURE 22. COMPARATIVE SHARE ANALYSIS OF PIPE INSULATION MARKET FOR OIL AND GAS, BY COUNTRY 2022 AND 2032(%)
- FIGURE 23. COMPARATIVE SHARE ANALYSIS OF PIPE INSULATION MARKET FOR TRANSPORTATION, BY COUNTRY 2022 AND 2032(%)
- FIGURE 24. COMPARATIVE SHARE ANALYSIS OF PIPE INSULATION MARKET FOR GENERAL INDUSTRIAL, BY COUNTRY 2022 AND 2032(%)
- FIGURE 25. COMPARATIVE SHARE ANALYSIS OF PIPE INSULATION MARKET FOR OTHERS, BY COUNTRY 2022 AND 2032(%)
- FIGURE 26. PIPE INSULATION MARKET BY REGION, 2022(%)
- FIGURE 27. U.S. PIPE INSULATION MARKET, 2022-2032 ($MILLION)
- FIGURE 28. CANADA PIPE INSULATION MARKET, 2022-2032 ($MILLION)
- FIGURE 29. MEXICO PIPE INSULATION MARKET, 2022-2032 ($MILLION)
- FIGURE 30. GERMANY PIPE INSULATION MARKET, 2022-2032 ($MILLION)
- FIGURE 31. UK PIPE INSULATION MARKET, 2022-2032 ($MILLION)
- FIGURE 32. FRANCE PIPE INSULATION MARKET, 2022-2032 ($MILLION)
- FIGURE 33. ITALY PIPE INSULATION MARKET, 2022-2032 ($MILLION)
- FIGURE 34. SPAIN PIPE INSULATION MARKET, 2022-2032 ($MILLION)
- FIGURE 35. REST OF EUROPE PIPE INSULATION MARKET, 2022-2032 ($MILLION)
- FIGURE 36. CHINA PIPE INSULATION MARKET, 2022-2032 ($MILLION)
- FIGURE 37. JAPAN PIPE INSULATION MARKET, 2022-2032 ($MILLION)
- FIGURE 38. INDIA PIPE INSULATION MARKET, 2022-2032 ($MILLION)
- FIGURE 39. SOUTH KOREA PIPE INSULATION MARKET, 2022-2032 ($MILLION)
- FIGURE 40. AUSTRALIA PIPE INSULATION MARKET, 2022-2032 ($MILLION)
- FIGURE 41. REST OF ASIA-PACIFIC PIPE INSULATION MARKET, 2022-2032 ($MILLION)
- FIGURE 42. BRAZIL PIPE INSULATION MARKET, 2022-2032 ($MILLION)
- FIGURE 43. SOUTH AFRICA, PIPE INSULATION MARKET, 2022-2032 ($MILLION)
- FIGURE 44. SAUDI ARABIA PIPE INSULATION MARKET, 2022-2032 ($MILLION)
- FIGURE 45. REST OF LAMEA PIPE INSULATION MARKET, 2022-2032 ($MILLION)
- FIGURE 46. TOP WINNING STRATEGIES, BY YEAR
- FIGURE 47. TOP WINNING STRATEGIES, BY DEVELOPMENT
- FIGURE 48. TOP WINNING STRATEGIES, BY COMPANY
- FIGURE 49. PRODUCT MAPPING OF TOP 10 PLAYERS
- FIGURE 50. COMPETITIVE DASHBOARD
- FIGURE 51. COMPETITIVE HEATMAP: PIPE INSULATION MARKET
- FIGURE 52. TOP PLAYER POSITIONING, 2022
- FIGURE 53. DOW: NET SALES, 2020-2022 ($MILLION)
- FIGURE 54. DOW: RESEARCH & DEVELOPMENT EXPENDITURE, 2020-2022 ($MILLION)
- FIGURE 55. DOW: REVENUE SHARE BY SEGMENT, 2022 (%)
- FIGURE 56. DOW: REVENUE SHARE BY REGION, 2022 (%)
- FIGURE 57. SAINT-GOBAIN: NET REVENUE, 2020-2022 ($MILLION)
- FIGURE 58. SAINT-GOBAIN: REVENUE SHARE BY REGION, 2022 (%)
- FIGURE 59. BASF SE: NET SALES, 2020-2022 ($MILLION)
- FIGURE 60. BASF SE: REVENUE SHARE BY SEGMENT, 2021 (%)
- FIGURE 61. BASF SE: REVENUE SHARE BY REGION, 2021 (%)
- FIGURE 62. OWENS CORNING: NET SALES, 2020-2022 ($MILLION)
- FIGURE 63. OWENS CORNING: REVENUE SHARE BY SEGMENT, 2022 (%)
- FIGURE 64. OWENS CORNING: REVENUE SHARE BY REGION, 2022 (%)
- FIGURE 65. KINGSPAN GROUP: NET REVENUE, 2020-2022 ($MILLION)
- FIGURE 66. KINGSPAN GROUP: RESEARCH & DEVELOPMENT EXPENDITURE, 2020-2022 ($MILLION)
- FIGURE 67. KINGSPAN GROUP: REVENUE SHARE BY SEGMENT, 2022 (%)
- FIGURE 68. KINGSPAN GROUP: REVENUE SHARE BY REGION, 2022 (%)
- FIGURE 69. HUNTSMAN INTERNATIONAL LLC: NET REVENUE, 2020-2022 ($MILLION)
- FIGURE 70. HUNTSMAN INTERNATIONAL LLC: RESEARCH & DEVELOPMENT EXPENDITURE, 2020-2022 ($MILLION)
- FIGURE 71. HUNTSMAN INTERNATIONAL LLC: REVENUE SHARE BY SEGMENT, 2022 (%)
- FIGURE 72. HUNTSMAN INTERNATIONAL LLC: REVENUE SHARE BY REGION, 2022 (%)
- FIGURE 73. ARMACELL: NET SALES, 2018-2020 ($MILLION)
- FIGURE 74. ARMACELL: REVENUE SHARE BY SEGMENT, 2020 (%)
- FIGURE 75. ARMACELL: REVENUE SHARE BY REGION, 2020 (%)
According to a new report published by Allied Market Research, titled, "Pipe Insulation Market," The pipe insulation market was valued at $9.1 billion in 2022, and is estimated to reach $15.8 billion by 2032, growing at a CAGR of 5.7% from 2023 to 2032.
Pipe insulation is a protective material applied around pipes to reduce heat transfer, maintain the desired temperature of fluids being transported within the pipes, and prevent energy loss or gain. It is commonly used in various industries, buildings, and infrastructure to improve energy efficiency, reduce greenhouse gas emissions, and prevent condensation.
The primary purpose of pipe insulation is to minimize heat loss during the transportation of hot fluids and prevent heat gain when conveying cold fluids. Insulating pipes helps conserve energy, reduce operational costs, and improve overall system performance. By minimizing heat transfer, pipe insulation can also prevent condensation on the outer surface of the pipe, which can lead to corrosion and mold growth.
The global pipe insulation market is currently experiencing substantial growth, primarily due to the increasing demand for energy efficiency, sustainability, and thermal insulation in various industries. Stringent regulations and policies aimed at reducing greenhouse gas emissions and energy consumption are compelling industries to adopt effective insulation solutions. Moreover, the need to minimize energy wastage and achieve cost savings is driving the expansion of the market.
The construction sector, in particular, plays a vital role in propelling the market forward, driven by the rising demand for residential and commercial buildings, as well as infrastructure development projects worldwide. However, the market growth may face hindrances due to the high cost of advanced insulation materials and the lack of awareness about the long-term benefits of insulation. Additionally, challenges arise from the availability of alternative insulation materials and the complexities associated with retrofitting insulation in existing infrastructure.
The pipe insulation market is divided on the basis of material, application, and region. On the basis of material, the market is classified into fiberglass, rockwool, silicates, polyurethane, rubber foams, and others. On the basis of application, the market is divided into building and construction, oil and gas, transportation, general industrial, and others. On the basis of region, the market is analyzed across North America, Europe, Asia-Pacific, and LAMEA.
The key players operating in the pipe insulation market are Armacell, BASF SE, Dow, Huntsman International LLC, Johns Manville, Kingspan Group, Knauf Insulation, Lydall, Inc., Owens Corning, and Saint-Gobain. These players have adopted various key strategies including expansion, agreement, and acquisition to increase their market share. These players have adopted various key strategies including agreement, collaboration, expansion, and partnership, to increase their market shares.
Key Benefits For Stakeholders
- This report provides a quantitative analysis of the market segments, current trends, estimations, and dynamics of the pipe insulation market analysis from 2022 to 2032 to identify the prevailing pipe insulation market opportunities.
- The market research is offered along with information related to key drivers, restraints, and opportunities.
- Porter's five forces analysis highlights the potency of buyers and suppliers to enable stakeholders make profit-oriented business decisions and strengthen their supplier-buyer network.
- In-depth analysis of the pipe insulation market segmentation assists to determine the prevailing market opportunities.
- Major countries in each region are mapped according to their revenue contribution to the global market.
- Market player positioning facilitates benchmarking and provides a clear understanding of the present position of the market players.
- The report includes the analysis of the regional as well as global pipe insulation market trends, key players, market segments, application areas, and market growth strategies.
Additional benefits you will get with this purchase are:
- Quarterly Update and* (only available with a corporate license, on listed price)
- 5 additional Company Profile of client Choice pre- or Post-purchase, as a free update.
- Free Upcoming Version on the Purchase of Five and Enterprise User License.
- 16 analyst hours of support* (post-purchase, if you find additional data requirements upon review of the report, you may receive support amounting to 16 analyst hours to solve questions, and post-sale queries)
- 15% Free Customization* (in case the scope or segment of the report does not match your requirements, 20% is equivalent to 3 working days of free work, applicable once)
- Free data Pack on the Five and Enterprise User License. (Excel version of the report)
- Free Updated report if the report is 6-12 months old or older.
- 24-hour priority response*
- Free Industry updates and white papers.
Possible Customization with this report (with additional cost and timeline talk to the sales executive to know more)
- Analysis of raw material in a product (by %)
- Product Life Cycles
- Upcoming/New Entrant by Regions
- Market share analysis of players by products/segments
- Regulatory Guidelines
- Additional company profiles with specific to client's interest
- Additional country or region analysis- market size and forecast
- Criss-cross segment analysis- market size and forecast
- Key player details (including location, contact details, supplier/vendor network etc. in excel format)
- Volume Market Size and Forecast
Key Market Segments
By Material
- Fiberglass
- Rockwool
- Silicates
- Polyurethane
- Rubber Foams
- Others
By Application
- Buildings and Construction
- Oil and Gas
- Transportation
- General Industrial
- Others
By Region
- North America
- U.S.
- Canada
- Mexico
- Europe
- Germany
- UK
- France
- Italy
- Spain
- Rest of Europe
- Asia-Pacific
- China
- Japan
- India
- South Korea
- Australia
- Rest of Asia-Pacific
- LAMEA
- Brazil
- South Africa,
- Saudi Arabia
- Rest of LAMEA
Key Market Players:
- Johns Manville
- Lydall, Inc.
- Knauf Insulation
- Huntsman International LLC
- Armacell
- BASF SE
- Dow
- Owens Corning
- Kingspan Group
- Saint-Gobain
TABLE OF CONTENTS
CHAPTER 1: INTRODUCTION
- 1.1. Report description
- 1.2. Key market segments
- 1.3. Key benefits to the stakeholders
- 1.4. Research Methodology
- 1.4.1. Primary research
- 1.4.2. Secondary research
- 1.4.3. Analyst tools and models
CHAPTER 2: EXECUTIVE SUMMARY
- 2.1. CXO Perspective
CHAPTER 3: MARKET OVERVIEW
- 3.1. Market definition and scope
- 3.2. Key findings
- 3.2.1. Top impacting factors
- 3.2.2. Top investment pockets
- 3.3. Porter's five forces analysis
- 3.3.1. Low bargaining power of suppliers
- 3.3.2. Low threat of new entrants
- 3.3.3. Low threat of substitutes
- 3.3.4. Low intensity of rivalry
- 3.3.5. Low bargaining power of buyers
- 3.4. Market dynamics
- 3.4.1. Drivers
- 3.4.1.1. Lucrative use of pipe insulation in various end-use industries
- 3.4.1.2. Rise in industrial infrastructure development
- 3.4.1. Drivers
- 3.4.2. Restraints
- 3.4.2.1. Fluctuations in the raw materials prices
- 3.4.3. Opportunities
- 3.4.3.1. Availability of sustainable and eco-friendly insulating materials
- 3.5. COVID-19 Impact Analysis on the market
- 3.6. Patent Landscape
- 3.7. Key Regulation Analysis
CHAPTER 4: PIPE INSULATION MARKET, BY MATERIAL
- 4.1. Overview
- 4.1.1. Market size and forecast
- 4.2. Fiberglass
- 4.2.1. Key market trends, growth factors and opportunities
- 4.2.2. Market size and forecast, by region
- 4.2.3. Market share analysis by country
- 4.3. Rockwool
- 4.3.1. Key market trends, growth factors and opportunities
- 4.3.2. Market size and forecast, by region
- 4.3.3. Market share analysis by country
- 4.4. Silicates
- 4.4.1. Key market trends, growth factors and opportunities
- 4.4.2. Market size and forecast, by region
- 4.4.3. Market share analysis by country
- 4.5. Polyurethane
- 4.5.1. Key market trends, growth factors and opportunities
- 4.5.2. Market size and forecast, by region
- 4.5.3. Market share analysis by country
- 4.6. Rubber Foams
- 4.6.1. Key market trends, growth factors and opportunities
- 4.6.2. Market size and forecast, by region
- 4.6.3. Market share analysis by country
- 4.7. Others
- 4.7.1. Key market trends, growth factors and opportunities
- 4.7.2. Market size and forecast, by region
- 4.7.3. Market share analysis by country
CHAPTER 5: PIPE INSULATION MARKET, BY APPLICATION
- 5.1. Overview
- 5.1.1. Market size and forecast
- 5.2. Buildings and Construction
- 5.2.1. Key market trends, growth factors and opportunities
- 5.2.2. Market size and forecast, by region
- 5.2.3. Market share analysis by country
- 5.3. Oil and Gas
- 5.3.1. Key market trends, growth factors and opportunities
- 5.3.2. Market size and forecast, by region
- 5.3.3. Market share analysis by country
- 5.4. Transportation
- 5.4.1. Key market trends, growth factors and opportunities
- 5.4.2. Market size and forecast, by region
- 5.4.3. Market share analysis by country
- 5.5. General Industrial
- 5.5.1. Key market trends, growth factors and opportunities
- 5.5.2. Market size and forecast, by region
- 5.5.3. Market share analysis by country
- 5.6. Others
- 5.6.1. Key market trends, growth factors and opportunities
- 5.6.2. Market size and forecast, by region
- 5.6.3. Market share analysis by country
CHAPTER 6: PIPE INSULATION MARKET, BY REGION
- 6.1. Overview
- 6.1.1. Market size and forecast By Region
- 6.2. North America
- 6.2.1. Key trends and opportunities
- 6.2.2. Market size and forecast, by Material
- 6.2.3. Market size and forecast, by Application
- 6.2.4. Market size and forecast, by country
- 6.2.4.1. U.S.
- 6.2.4.1.1. Key market trends, growth factors and opportunities
- 6.2.4.1.2. Market size and forecast, by Material
- 6.2.4.1.3. Market size and forecast, by Application
- 6.2.4.2. Canada
- 6.2.4.2.1. Key market trends, growth factors and opportunities
- 6.2.4.2.2. Market size and forecast, by Material
- 6.2.4.2.3. Market size and forecast, by Application
- 6.2.4.3. Mexico
- 6.2.4.3.1. Key market trends, growth factors and opportunities
- 6.2.4.3.2. Market size and forecast, by Material
- 6.2.4.3.3. Market size and forecast, by Application
- 6.3. Europe
- 6.3.1. Key trends and opportunities
- 6.3.2. Market size and forecast, by Material
- 6.3.3. Market size and forecast, by Application
- 6.3.4. Market size and forecast, by country
- 6.3.4.1. Germany
- 6.3.4.1.1. Key market trends, growth factors and opportunities
- 6.3.4.1.2. Market size and forecast, by Material
- 6.3.4.1.3. Market size and forecast, by Application
- 6.3.4.2. UK
- 6.3.4.2.1. Key market trends, growth factors and opportunities
- 6.3.4.2.2. Market size and forecast, by Material
- 6.3.4.2.3. Market size and forecast, by Application
- 6.3.4.3. France
- 6.3.4.3.1. Key market trends, growth factors and opportunities
- 6.3.4.3.2. Market size and forecast, by Material
- 6.3.4.3.3. Market size and forecast, by Application
- 6.3.4.4. Italy
- 6.3.4.4.1. Key market trends, growth factors and opportunities
- 6.3.4.4.2. Market size and forecast, by Material
- 6.3.4.4.3. Market size and forecast, by Application
- 6.3.4.5. Spain
- 6.3.4.5.1. Key market trends, growth factors and opportunities
- 6.3.4.5.2. Market size and forecast, by Material
- 6.3.4.5.3. Market size and forecast, by Application
- 6.3.4.6. Rest of Europe
- 6.3.4.6.1. Key market trends, growth factors and opportunities
- 6.3.4.6.2. Market size and forecast, by Material
- 6.3.4.6.3. Market size and forecast, by Application
- 6.4. Asia-Pacific
- 6.4.1. Key trends and opportunities
- 6.4.2. Market size and forecast, by Material
- 6.4.3. Market size and forecast, by Application
- 6.4.4. Market size and forecast, by country
- 6.4.4.1. China
- 6.4.4.1.1. Key market trends, growth factors and opportunities
- 6.4.4.1.2. Market size and forecast, by Material
- 6.4.4.1.3. Market size and forecast, by Application
- 6.4.4.2. Japan
- 6.4.4.2.1. Key market trends, growth factors and opportunities
- 6.4.4.2.2. Market size and forecast, by Material
- 6.4.4.2.3. Market size and forecast, by Application
- 6.4.4.3. India
- 6.4.4.3.1. Key market trends, growth factors and opportunities
- 6.4.4.3.2. Market size and forecast, by Material
- 6.4.4.3.3. Market size and forecast, by Application
- 6.4.4.4. South Korea
- 6.4.4.4.1. Key market trends, growth factors and opportunities
- 6.4.4.4.2. Market size and forecast, by Material
- 6.4.4.4.3. Market size and forecast, by Application
- 6.4.4.5. Australia
- 6.4.4.5.1. Key market trends, growth factors and opportunities
- 6.4.4.5.2. Market size and forecast, by Material
- 6.4.4.5.3. Market size and forecast, by Application
- 6.4.4.6. Rest of Asia-Pacific
- 6.4.4.6.1. Key market trends, growth factors and opportunities
- 6.4.4.6.2. Market size and forecast, by Material
- 6.4.4.6.3. Market size and forecast, by Application
- 6.5. LAMEA
- 6.5.1. Key trends and opportunities
- 6.5.2. Market size and forecast, by Material
- 6.5.3. Market size and forecast, by Application
- 6.5.4. Market size and forecast, by country
- 6.5.4.1. Brazil
- 6.5.4.1.1. Key market trends, growth factors and opportunities
- 6.5.4.1.2. Market size and forecast, by Material
- 6.5.4.1.3. Market size and forecast, by Application
- 6.5.4.2. South Africa,
- 6.5.4.2.1. Key market trends, growth factors and opportunities
- 6.5.4.2.2. Market size and forecast, by Material
- 6.5.4.2.3. Market size and forecast, by Application
- 6.5.4.3. Saudi Arabia
- 6.5.4.3.1. Key market trends, growth factors and opportunities
- 6.5.4.3.2. Market size and forecast, by Material
- 6.5.4.3.3. Market size and forecast, by Application
- 6.5.4.4. Rest of LAMEA
- 6.5.4.4.1. Key market trends, growth factors and opportunities
- 6.5.4.4.2. Market size and forecast, by Material
- 6.5.4.4.3. Market size and forecast, by Application
CHAPTER 7: COMPETITIVE LANDSCAPE
- 7.1. Introduction
- 7.2. Top winning strategies
- 7.3. Product Mapping of Top 10 Player
- 7.4. Competitive Dashboard
- 7.5. Competitive Heatmap
- 7.6. Top player positioning, 2022
CHAPTER 8: COMPANY PROFILES
- 8.1. Dow
- 8.1.1. Company overview
- 8.1.2. Key Executives
- 8.1.3. Company snapshot
- 8.1.4. Operating business segments
- 8.1.5. Product portfolio
- 8.1.6. Business performance
- 8.2. Saint-Gobain
- 8.2.1. Company overview
- 8.2.2. Key Executives
- 8.2.3. Company snapshot
- 8.2.4. Operating business segments
- 8.2.5. Product portfolio
- 8.2.6. Business performance
- 8.2.7. Key strategic moves and developments
- 8.3. BASF SE
- 8.3.1. Company overview
- 8.3.2. Key Executives
- 8.3.3. Company snapshot
- 8.3.4. Operating business segments
- 8.3.5. Product portfolio
- 8.3.6. Business performance
- 8.3.7. Key strategic moves and developments
- 8.4. Johns Manville
- 8.4.1. Company overview
- 8.4.2. Key Executives
- 8.4.3. Company snapshot
- 8.4.4. Operating business segments
- 8.4.5. Product portfolio
- 8.5. Owens Corning
- 8.5.1. Company overview
- 8.5.2. Key Executives
- 8.5.3. Company snapshot
- 8.5.4. Operating business segments
- 8.5.5. Product portfolio
- 8.5.6. Business performance
- 8.6. Kingspan Group
- 8.6.1. Company overview
- 8.6.2. Key Executives
- 8.6.3. Company snapshot
- 8.6.4. Operating business segments
- 8.6.5. Product portfolio
- 8.6.6. Business performance
- 8.7. Huntsman International LLC
- 8.7.1. Company overview
- 8.7.2. Key Executives
- 8.7.3. Company snapshot
- 8.7.4. Operating business segments
- 8.7.5. Product portfolio
- 8.7.6. Business performance
- 8.8. Armacell
- 8.8.1. Company overview
- 8.8.2. Key Executives
- 8.8.3. Company snapshot
- 8.8.4. Operating business segments
- 8.8.5. Product portfolio
- 8.8.6. Business performance
- 8.8.7. Key strategic moves and developments
- 8.9. Knauf Insulation
- 8.9.1. Company overview
- 8.9.2. Key Executives
- 8.9.3. Company snapshot
- 8.9.4. Operating business segments
- 8.9.5. Product portfolio
- 8.9.6. Key strategic moves and developments
- 8.10. Lydall, Inc.
- 8.10.1. Company overview
- 8.10.2. Key Executives
- 8.10.3. Company snapshot
- 8.10.4. Operating business segments
- 8.10.5. Product portfolio
