
|
市場調査レポート
商品コード
1365604
乳児栄養市場:製品タイプ別、形態別、流通チャネル別:世界の機会分析と産業予測、2023~2032年Infant Nutrition Market By Product Type, By Form, By Distribution Channel : Global Opportunity Analysis and Industry Forecast, 2023-2032 |
||||||
|
|||||||

| 乳児栄養市場:製品タイプ別、形態別、流通チャネル別:世界の機会分析と産業予測、2023~2032年 |
|
出版日: 2023年07月01日
発行: Allied Market Research
ページ情報: 英文 262 Pages
納期: 2~3営業日
|

- 全表示
- 概要
- 図表
- 目次
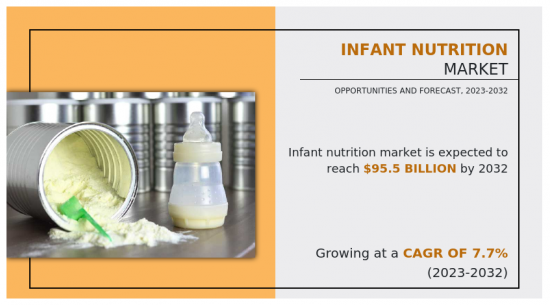
Allied Market Researchの最新レポート「乳児栄養市場」によると、乳児栄養市場は2022年に455億米ドルと評価され、2023年から2032年にかけてCAGR 7.7%で成長し、2032年には955億米ドルに達すると推定されています。
世界中で栄養失調のケースが増加しているため、乳児の成長には乳児栄養が不可欠です。さらに、1歳未満の子供では臓器系が十分に発達していないです。正常に発育するためには、消化が簡単で、必要な量のカロリー、ビタミン、ミネラル、その他の栄養素を豊富に含む栄養が必要であり、これは乳児栄養製品を通じて提供することができます。
さらに、赤ちゃんの栄養バランスの良さに対する認識が高まるにつれ、乾燥ベビーフードの需要は時代とともに大きく伸びています。乾燥ベビーフードの賞味期限が長いことも、市場をある程度刺激しています。ベビーフードビジネスは、社会経済情勢の発展や可処分所得の大幅な増加による生活水準の向上に伴って拡大してきました。さらに、専門分野で働く女性の増加、出産休暇の短縮、家庭での食事準備の時間的制約などの結果、ベビーフード製品の採用が増加しています。
新生児に与える食事に関する推奨事項は、時代とともに進化しています。また、赤ちゃんの発育のために栄養価の高い食事が重要であるという消費者の意識も高まっています。その結果、多くの企業が乳児用食品に健康的で有用な原材料を加え、栄養価を高めています。政府は同時に、赤ちゃんのケア意識を促進するためのイニシアチブを開始しました。さらに、ベビーフードに関連する商品のインターネット広告が増加した結果、市場が拡大しています。
世界の1人当たり所得は近年、新興国を中心に大幅に増加しています。都市化の進展、中間層の消費増加、女性の労働力参加率の上昇により、多くの新興国市場および先進国市場で、利便性を重視したライフスタイルの採用が奨励されています。このため、乳児用調製粉乳や調理済み離乳食といった乳児栄養製品に対する消費者の需要が高まっています。さらに、今後10年間で、新興国の1人当たり所得は富裕国に比べて劇的に増加します。
目次
第1章 イントロダクション
第2章 エグゼクティブサマリー
第3章 市場概要
- 市場の定義と範囲
- 主な調査結果
- 影響要因
- 主な投資機会
- ポーターのファイブフォース分析
- 市場力学
- 促進要因
- 適切な栄養摂取に対する意識の高まり
- 消費者の多忙なライフスタイル
- 購買行動に影響を与える革新的パッケージ
- 抑制要因
- 政府の取り組みによる母乳育児の増加
- 機会
- より栄養価の高いオーガニック幼児食
- 栄養需要に対応するための乳児用食品におけるプレバイオティクスとプロバイオティクス
- 促進要因
- COVID-19市場への影響分析
第4章 乳児栄養市場:製品タイプ別
- 概要
- フォローオンミルク
- 特殊ミルク
- 乳児用ミルク
- 調製ベビーフード
- 乾燥ベビーフード
第5章 乳児栄養市場:形態別
- 概要
- 固形ベビーフード
- 液体ベビーフード
第6章 乳児栄養市場:流通チャネル別
- 概要
- eコマース
- オフラインチャネル
- オフラインチャネル乳児栄養市場:サブタイプ別
第7章 乳児栄養市場:地域別
- 概要
- 北米
- 北米のオフラインチャネル乳児栄養市場:サブタイプ別
- 米国
- カナダ
- メキシコ
- 欧州
- 欧州のオフラインチャネル乳児栄養市場:サブタイプ別
- ドイツ
- 英国
- フランス
- イタリア
- スペイン
- スイス
- その他
- アジア太平洋
- アジア太平洋のオフラインチャネル乳児栄養市場:サブタイプ別
- 中国
- インド
- 日本
- 韓国
- オーストラリア
- その他
- ラテンアメリカ・中東・アフリカ
- ラテンアメリカ・中東・アフリカのオフラインチャネル乳児栄養市場:サブタイプ別
- ブラジル
- 南アフリカ
- アラブ首長国連邦
- その他
第8章 競合情勢
- イントロダクション
- 主要成功戦略
- 主要10社の製品マッピング
- 競合ダッシュボード
- 競合ヒートマップ
- 主要企業のポジショニング、2022年
第9章 企業プロファイル
- Nestle S.A.
- Perrigo Company plc
- Abbott Laboratories
- DANA DAIRY GROUP LTD.
- Arla Foods amba
- Danone S.A.
- The Kraft Heinz Company
- Sun-Maid Growers of California, Inc.
- Gujarat Cooperative Milk Marketing Federation Ltd.
- Reckitt Benckiser Group PLC
LIST OF TABLES
- TABLE 01. GLOBAL INFANT NUTRITION MARKET, BY PRODUCT TYPE, 2022-2032 ($MILLION)
- TABLE 02. INFANT NUTRITION MARKET FOR FOLLOW-ON MILK, BY REGION, 2022-2032 ($MILLION)
- TABLE 03. INFANT NUTRITION MARKET FOR SPECIALTY BABY MILK, BY REGION, 2022-2032 ($MILLION)
- TABLE 04. INFANT NUTRITION MARKET FOR INFANT MILK, BY REGION, 2022-2032 ($MILLION)
- TABLE 05. INFANT NUTRITION MARKET FOR PREPARED BABY FOOD, BY REGION, 2022-2032 ($MILLION)
- TABLE 06. INFANT NUTRITION MARKET FOR DRIED BABY FOOD, BY REGION, 2022-2032 ($MILLION)
- TABLE 07. GLOBAL INFANT NUTRITION MARKET, BY FORM, 2022-2032 ($MILLION)
- TABLE 08. INFANT NUTRITION MARKET FOR SOLID BABY FOOD, BY REGION, 2022-2032 ($MILLION)
- TABLE 09. INFANT NUTRITION MARKET FOR LIQUID BABY FOOD, BY REGION, 2022-2032 ($MILLION)
- TABLE 10. GLOBAL INFANT NUTRITION MARKET, BY DISTRIBUTION CHANNEL, 2022-2032 ($MILLION)
- TABLE 11. INFANT NUTRITION MARKET FOR E-COMMERCE, BY REGION, 2022-2032 ($MILLION)
- TABLE 12. INFANT NUTRITION MARKET FOR OFFLINE CHANNEL, BY REGION, 2022-2032 ($MILLION)
- TABLE 13. GLOBAL OFFLINE CHANNEL INFANT NUTRITION MARKET, BY SUB TYPE, 2022-2032 ($MILLION)
- TABLE 14. INFANT NUTRITION MARKET FOR PHARMACY, BY REGION, 2022-2032 ($MILLION)
- TABLE 15. INFANT NUTRITION MARKET FOR CONVENIENCE STORES, BY REGION, 2022-2032 ($MILLION)
- TABLE 16. INFANT NUTRITION MARKET FOR HYPERMARKETS/SUPERMARKETS, BY REGION, 2022-2032 ($MILLION)
- TABLE 17. INFANT NUTRITION MARKET FOR OTHERS, BY REGION, 2022-2032 ($MILLION)
- TABLE 18. INFANT NUTRITION MARKET, BY REGION, 2022-2032 ($MILLION)
- TABLE 19. NORTH AMERICA INFANT NUTRITION MARKET, BY PRODUCT TYPE, 2022-2032 ($MILLION)
- TABLE 20. NORTH AMERICA INFANT NUTRITION MARKET, BY FORM, 2022-2032 ($MILLION)
- TABLE 21. NORTH AMERICA INFANT NUTRITION MARKET, BY DISTRIBUTION CHANNEL, 2022-2032 ($MILLION)
- TABLE 22. NORTH AMERICA OFFLINE CHANNEL INFANT NUTRITION MARKET, BY SUB TYPE, 2022-2032 ($MILLION)
- TABLE 23. NORTH AMERICA INFANT NUTRITION MARKET, BY COUNTRY, 2022-2032 ($MILLION)
- TABLE 24. U.S. INFANT NUTRITION MARKET, BY PRODUCT TYPE, 2022-2032 ($MILLION)
- TABLE 25. U.S. INFANT NUTRITION MARKET, BY FORM, 2022-2032 ($MILLION)
- TABLE 26. U.S. INFANT NUTRITION MARKET, BY DISTRIBUTION CHANNEL, 2022-2032 ($MILLION)
- TABLE 27. CANADA INFANT NUTRITION MARKET, BY PRODUCT TYPE, 2022-2032 ($MILLION)
- TABLE 28. CANADA INFANT NUTRITION MARKET, BY FORM, 2022-2032 ($MILLION)
- TABLE 29. CANADA INFANT NUTRITION MARKET, BY DISTRIBUTION CHANNEL, 2022-2032 ($MILLION)
- TABLE 30. MEXICO INFANT NUTRITION MARKET, BY PRODUCT TYPE, 2022-2032 ($MILLION)
- TABLE 31. MEXICO INFANT NUTRITION MARKET, BY FORM, 2022-2032 ($MILLION)
- TABLE 32. MEXICO INFANT NUTRITION MARKET, BY DISTRIBUTION CHANNEL, 2022-2032 ($MILLION)
- TABLE 33. EUROPE INFANT NUTRITION MARKET, BY PRODUCT TYPE, 2022-2032 ($MILLION)
- TABLE 34. EUROPE INFANT NUTRITION MARKET, BY FORM, 2022-2032 ($MILLION)
- TABLE 35. EUROPE INFANT NUTRITION MARKET, BY DISTRIBUTION CHANNEL, 2022-2032 ($MILLION)
- TABLE 36. EUROPE OFFLINE CHANNEL INFANT NUTRITION MARKET, BY SUB TYPE, 2022-2032 ($MILLION)
- TABLE 37. EUROPE INFANT NUTRITION MARKET, BY COUNTRY, 2022-2032 ($MILLION)
- TABLE 38. GERMANY INFANT NUTRITION MARKET, BY PRODUCT TYPE, 2022-2032 ($MILLION)
- TABLE 39. GERMANY INFANT NUTRITION MARKET, BY FORM, 2022-2032 ($MILLION)
- TABLE 40. GERMANY INFANT NUTRITION MARKET, BY DISTRIBUTION CHANNEL, 2022-2032 ($MILLION)
- TABLE 41. UK INFANT NUTRITION MARKET, BY PRODUCT TYPE, 2022-2032 ($MILLION)
- TABLE 42. UK INFANT NUTRITION MARKET, BY FORM, 2022-2032 ($MILLION)
- TABLE 43. UK INFANT NUTRITION MARKET, BY DISTRIBUTION CHANNEL, 2022-2032 ($MILLION)
- TABLE 44. FRANCE INFANT NUTRITION MARKET, BY PRODUCT TYPE, 2022-2032 ($MILLION)
- TABLE 45. FRANCE INFANT NUTRITION MARKET, BY FORM, 2022-2032 ($MILLION)
- TABLE 46. FRANCE INFANT NUTRITION MARKET, BY DISTRIBUTION CHANNEL, 2022-2032 ($MILLION)
- TABLE 47. ITALY INFANT NUTRITION MARKET, BY PRODUCT TYPE, 2022-2032 ($MILLION)
- TABLE 48. ITALY INFANT NUTRITION MARKET, BY FORM, 2022-2032 ($MILLION)
- TABLE 49. ITALY INFANT NUTRITION MARKET, BY DISTRIBUTION CHANNEL, 2022-2032 ($MILLION)
- TABLE 50. SPAIN INFANT NUTRITION MARKET, BY PRODUCT TYPE, 2022-2032 ($MILLION)
- TABLE 51. SPAIN INFANT NUTRITION MARKET, BY FORM, 2022-2032 ($MILLION)
- TABLE 52. SPAIN INFANT NUTRITION MARKET, BY DISTRIBUTION CHANNEL, 2022-2032 ($MILLION)
- TABLE 53. SWITZERLAND INFANT NUTRITION MARKET, BY PRODUCT TYPE, 2022-2032 ($MILLION)
- TABLE 54. SWITZERLAND INFANT NUTRITION MARKET, BY FORM, 2022-2032 ($MILLION)
- TABLE 55. SWITZERLAND INFANT NUTRITION MARKET, BY DISTRIBUTION CHANNEL, 2022-2032 ($MILLION)
- TABLE 56. REST OF EUROPE INFANT NUTRITION MARKET, BY PRODUCT TYPE, 2022-2032 ($MILLION)
- TABLE 57. REST OF EUROPE INFANT NUTRITION MARKET, BY FORM, 2022-2032 ($MILLION)
- TABLE 58. REST OF EUROPE INFANT NUTRITION MARKET, BY DISTRIBUTION CHANNEL, 2022-2032 ($MILLION)
- TABLE 59. ASIA-PACIFIC INFANT NUTRITION MARKET, BY PRODUCT TYPE, 2022-2032 ($MILLION)
- TABLE 60. ASIA-PACIFIC INFANT NUTRITION MARKET, BY FORM, 2022-2032 ($MILLION)
- TABLE 61. ASIA-PACIFIC INFANT NUTRITION MARKET, BY DISTRIBUTION CHANNEL, 2022-2032 ($MILLION)
- TABLE 62. ASIA-PACIFIC OFFLINE CHANNEL INFANT NUTRITION MARKET, BY SUB TYPE, 2022-2032 ($MILLION)
- TABLE 63. ASIA-PACIFIC INFANT NUTRITION MARKET, BY COUNTRY, 2022-2032 ($MILLION)
- TABLE 64. CHINA INFANT NUTRITION MARKET, BY PRODUCT TYPE, 2022-2032 ($MILLION)
- TABLE 65. CHINA INFANT NUTRITION MARKET, BY FORM, 2022-2032 ($MILLION)
- TABLE 66. CHINA INFANT NUTRITION MARKET, BY DISTRIBUTION CHANNEL, 2022-2032 ($MILLION)
- TABLE 67. INDIA INFANT NUTRITION MARKET, BY PRODUCT TYPE, 2022-2032 ($MILLION)
- TABLE 68. INDIA INFANT NUTRITION MARKET, BY FORM, 2022-2032 ($MILLION)
- TABLE 69. INDIA INFANT NUTRITION MARKET, BY DISTRIBUTION CHANNEL, 2022-2032 ($MILLION)
- TABLE 70. JAPAN INFANT NUTRITION MARKET, BY PRODUCT TYPE, 2022-2032 ($MILLION)
- TABLE 71. JAPAN INFANT NUTRITION MARKET, BY FORM, 2022-2032 ($MILLION)
- TABLE 72. JAPAN INFANT NUTRITION MARKET, BY DISTRIBUTION CHANNEL, 2022-2032 ($MILLION)
- TABLE 73. SOUTH KOREA INFANT NUTRITION MARKET, BY PRODUCT TYPE, 2022-2032 ($MILLION)
- TABLE 74. SOUTH KOREA INFANT NUTRITION MARKET, BY FORM, 2022-2032 ($MILLION)
- TABLE 75. SOUTH KOREA INFANT NUTRITION MARKET, BY DISTRIBUTION CHANNEL, 2022-2032 ($MILLION)
- TABLE 76. AUSTRALIA INFANT NUTRITION MARKET, BY PRODUCT TYPE, 2022-2032 ($MILLION)
- TABLE 77. AUSTRALIA INFANT NUTRITION MARKET, BY FORM, 2022-2032 ($MILLION)
- TABLE 78. AUSTRALIA INFANT NUTRITION MARKET, BY DISTRIBUTION CHANNEL, 2022-2032 ($MILLION)
- TABLE 79. REST OF ASIA-PACIFIC INFANT NUTRITION MARKET, BY PRODUCT TYPE, 2022-2032 ($MILLION)
- TABLE 80. REST OF ASIA-PACIFIC INFANT NUTRITION MARKET, BY FORM, 2022-2032 ($MILLION)
- TABLE 81. REST OF ASIA-PACIFIC INFANT NUTRITION MARKET, BY DISTRIBUTION CHANNEL, 2022-2032 ($MILLION)
- TABLE 82. LAMEA INFANT NUTRITION MARKET, BY PRODUCT TYPE, 2022-2032 ($MILLION)
- TABLE 83. LAMEA INFANT NUTRITION MARKET, BY FORM, 2022-2032 ($MILLION)
- TABLE 84. LAMEA INFANT NUTRITION MARKET, BY DISTRIBUTION CHANNEL, 2022-2032 ($MILLION)
- TABLE 85. LAMEA OFFLINE CHANNEL INFANT NUTRITION MARKET, BY SUB TYPE, 2022-2032 ($MILLION)
- TABLE 86. LAMEA INFANT NUTRITION MARKET, BY COUNTRY, 2022-2032 ($MILLION)
- TABLE 87. BRAZIL INFANT NUTRITION MARKET, BY PRODUCT TYPE, 2022-2032 ($MILLION)
- TABLE 88. BRAZIL INFANT NUTRITION MARKET, BY FORM, 2022-2032 ($MILLION)
- TABLE 89. BRAZIL INFANT NUTRITION MARKET, BY DISTRIBUTION CHANNEL, 2022-2032 ($MILLION)
- TABLE 90. SOUTH AFRICA INFANT NUTRITION MARKET, BY PRODUCT TYPE, 2022-2032 ($MILLION)
- TABLE 91. SOUTH AFRICA INFANT NUTRITION MARKET, BY FORM, 2022-2032 ($MILLION)
- TABLE 92. SOUTH AFRICA INFANT NUTRITION MARKET, BY DISTRIBUTION CHANNEL, 2022-2032 ($MILLION)
- TABLE 93. UAE INFANT NUTRITION MARKET, BY PRODUCT TYPE, 2022-2032 ($MILLION)
- TABLE 94. UAE INFANT NUTRITION MARKET, BY FORM, 2022-2032 ($MILLION)
- TABLE 95. UAE INFANT NUTRITION MARKET, BY DISTRIBUTION CHANNEL, 2022-2032 ($MILLION)
- TABLE 96. REST OF LAMEA INFANT NUTRITION MARKET, BY PRODUCT TYPE, 2022-2032 ($MILLION)
- TABLE 97. REST OF LAMEA INFANT NUTRITION MARKET, BY FORM, 2022-2032 ($MILLION)
- TABLE 98. REST OF LAMEA INFANT NUTRITION MARKET, BY DISTRIBUTION CHANNEL, 2022-2032 ($MILLION)
- TABLE 99. NESTLE S.A.: KEY EXECUTIVES
- TABLE 100. NESTLE S.A.: COMPANY SNAPSHOT
- TABLE 101. NESTLE S.A.: PRODUCT SEGMENTS
- TABLE 102. NESTLE S.A.: PRODUCT PORTFOLIO
- TABLE 103. PERRIGO COMPANY PLC: KEY EXECUTIVES
- TABLE 104. PERRIGO COMPANY PLC: COMPANY SNAPSHOT
- TABLE 105. PERRIGO COMPANY PLC: PRODUCT SEGMENTS
- TABLE 106. PERRIGO COMPANY PLC: PRODUCT PORTFOLIO
- TABLE 107. PERRIGO COMPANY PLC: KEY STRATERGIES
- TABLE 108. ABBOTT LABORATORIES: KEY EXECUTIVES
- TABLE 109. ABBOTT LABORATORIES: COMPANY SNAPSHOT
- TABLE 110. ABBOTT LABORATORIES: PRODUCT SEGMENTS
- TABLE 111. ABBOTT LABORATORIES: PRODUCT PORTFOLIO
- TABLE 112. ABBOTT LABORATORIES: KEY STRATERGIES
- TABLE 113. DANA DAIRY GROUP LTD.: KEY EXECUTIVES
- TABLE 114. DANA DAIRY GROUP LTD.: COMPANY SNAPSHOT
- TABLE 115. DANA DAIRY GROUP LTD.: PRODUCT SEGMENTS
- TABLE 116. DANA DAIRY GROUP LTD.: PRODUCT PORTFOLIO
- TABLE 117. ARLA FOODS AMBA: KEY EXECUTIVES
- TABLE 118. ARLA FOODS AMBA: COMPANY SNAPSHOT
- TABLE 119. ARLA FOODS AMBA: PRODUCT SEGMENTS
- TABLE 120. ARLA FOODS AMBA: PRODUCT PORTFOLIO
- TABLE 121. ARLA FOODS AMBA: KEY STRATERGIES
- TABLE 122. DANONE S.A.: KEY EXECUTIVES
- TABLE 123. DANONE S.A.: COMPANY SNAPSHOT
- TABLE 124. DANONE S.A.: PRODUCT SEGMENTS
- TABLE 125. DANONE S.A.: PRODUCT PORTFOLIO
- TABLE 126. DANONE S.A.: KEY STRATERGIES
- TABLE 127. THE KRAFT HEINZ COMPANY: KEY EXECUTIVES
- TABLE 128. THE KRAFT HEINZ COMPANY: COMPANY SNAPSHOT
- TABLE 129. THE KRAFT HEINZ COMPANY: PRODUCT SEGMENTS
- TABLE 130. THE KRAFT HEINZ COMPANY: PRODUCT PORTFOLIO
- TABLE 131. SUN-MAID GROWERS OF CALIFORNIA, INC.: KEY EXECUTIVES
- TABLE 132. SUN-MAID GROWERS OF CALIFORNIA, INC.: COMPANY SNAPSHOT
- TABLE 133. SUN-MAID GROWERS OF CALIFORNIA, INC.: PRODUCT SEGMENTS
- TABLE 134. SUN-MAID GROWERS OF CALIFORNIA, INC.: PRODUCT PORTFOLIO
- TABLE 135. SUN-MAID GROWERS OF CALIFORNIA, INC.: KEY STRATERGIES
- TABLE 136. GUJARAT COOPERATIVE MILK MARKETING FEDERATION LTD.: KEY EXECUTIVES
- TABLE 137. GUJARAT COOPERATIVE MILK MARKETING FEDERATION LTD.: COMPANY SNAPSHOT
- TABLE 138. GUJARAT COOPERATIVE MILK MARKETING FEDERATION LTD.: PRODUCT SEGMENTS
- TABLE 139. GUJARAT COOPERATIVE MILK MARKETING FEDERATION LTD.: PRODUCT PORTFOLIO
- TABLE 140. RECKITT BENCKISER GROUP PLC: KEY EXECUTIVES
- TABLE 141. RECKITT BENCKISER GROUP PLC: COMPANY SNAPSHOT
- TABLE 142. RECKITT BENCKISER GROUP PLC: PRODUCT SEGMENTS
- TABLE 143. RECKITT BENCKISER GROUP PLC: PRODUCT PORTFOLIO
LIST OF FIGURES
- FIGURE 01. INFANT NUTRITION MARKET, 2022-2032
- FIGURE 02. SEGMENTATION OF INFANT NUTRITION MARKET, 2022-2032
- FIGURE 03. TOP INVESTMENT POCKETS IN INFANT NUTRITION MARKET (2023-2032)
- FIGURE 04. HIGH BARGAINING POWER OF SUPPLIERS
- FIGURE 05. LOW THREAT OF NEW ENTRANTS
- FIGURE 06. MODERATE THREAT OF SUBSTITUTES
- FIGURE 07. MODERATE INTENSITY OF RIVALRY
- FIGURE 08. MODERATE BARGAINING POWER OF BUYERS
- FIGURE 09. DRIVERS, RESTRAINTS AND OPPORTUNITIES: GLOBALINFANT NUTRITION MARKET
- FIGURE 09. INFANT NUTRITION MARKET, BY PRODUCT TYPE, 2022(%)
- FIGURE 10. COMPARATIVE SHARE ANALYSIS OF INFANT NUTRITION MARKET FOR FOLLOW-ON MILK, BY COUNTRY 2022 AND 2032(%)
- FIGURE 11. COMPARATIVE SHARE ANALYSIS OF INFANT NUTRITION MARKET FOR SPECIALTY BABY MILK, BY COUNTRY 2022 AND 2032(%)
- FIGURE 12. COMPARATIVE SHARE ANALYSIS OF INFANT NUTRITION MARKET FOR INFANT MILK, BY COUNTRY 2022 AND 2032(%)
- FIGURE 13. COMPARATIVE SHARE ANALYSIS OF INFANT NUTRITION MARKET FOR PREPARED BABY FOOD, BY COUNTRY 2022 AND 2032(%)
- FIGURE 14. COMPARATIVE SHARE ANALYSIS OF INFANT NUTRITION MARKET FOR DRIED BABY FOOD, BY COUNTRY 2022 AND 2032(%)
- FIGURE 15. INFANT NUTRITION MARKET, BY FORM, 2022(%)
- FIGURE 16. COMPARATIVE SHARE ANALYSIS OF INFANT NUTRITION MARKET FOR SOLID BABY FOOD, BY COUNTRY 2022 AND 2032(%)
- FIGURE 17. COMPARATIVE SHARE ANALYSIS OF INFANT NUTRITION MARKET FOR LIQUID BABY FOOD, BY COUNTRY 2022 AND 2032(%)
- FIGURE 18. INFANT NUTRITION MARKET, BY DISTRIBUTION CHANNEL, 2022(%)
- FIGURE 19. COMPARATIVE SHARE ANALYSIS OF INFANT NUTRITION MARKET FOR E-COMMERCE, BY COUNTRY 2022 AND 2032(%)
- FIGURE 20. COMPARATIVE SHARE ANALYSIS OF INFANT NUTRITION MARKET FOR OFFLINE CHANNEL, BY COUNTRY 2022 AND 2032(%)
- FIGURE 21. INFANT NUTRITION MARKET BY REGION, 2022
- FIGURE 22. U.S. INFANT NUTRITION MARKET, 2022-2032 ($MILLION)
- FIGURE 23. CANADA INFANT NUTRITION MARKET, 2022-2032 ($MILLION)
- FIGURE 24. MEXICO INFANT NUTRITION MARKET, 2022-2032 ($MILLION)
- FIGURE 25. GERMANY INFANT NUTRITION MARKET, 2022-2032 ($MILLION)
- FIGURE 26. UK INFANT NUTRITION MARKET, 2022-2032 ($MILLION)
- FIGURE 27. FRANCE INFANT NUTRITION MARKET, 2022-2032 ($MILLION)
- FIGURE 28. ITALY INFANT NUTRITION MARKET, 2022-2032 ($MILLION)
- FIGURE 29. SPAIN INFANT NUTRITION MARKET, 2022-2032 ($MILLION)
- FIGURE 30. SWITZERLAND INFANT NUTRITION MARKET, 2022-2032 ($MILLION)
- FIGURE 31. REST OF EUROPE INFANT NUTRITION MARKET, 2022-2032 ($MILLION)
- FIGURE 32. CHINA INFANT NUTRITION MARKET, 2022-2032 ($MILLION)
- FIGURE 33. INDIA INFANT NUTRITION MARKET, 2022-2032 ($MILLION)
- FIGURE 34. JAPAN INFANT NUTRITION MARKET, 2022-2032 ($MILLION)
- FIGURE 35. SOUTH KOREA INFANT NUTRITION MARKET, 2022-2032 ($MILLION)
- FIGURE 36. AUSTRALIA INFANT NUTRITION MARKET, 2022-2032 ($MILLION)
- FIGURE 37. REST OF ASIA-PACIFIC INFANT NUTRITION MARKET, 2022-2032 ($MILLION)
- FIGURE 38. BRAZIL INFANT NUTRITION MARKET, 2022-2032 ($MILLION)
- FIGURE 39. SOUTH AFRICA INFANT NUTRITION MARKET, 2022-2032 ($MILLION)
- FIGURE 40. UAE INFANT NUTRITION MARKET, 2022-2032 ($MILLION)
- FIGURE 41. REST OF LAMEA INFANT NUTRITION MARKET, 2022-2032 ($MILLION)
- FIGURE 42. TOP WINNING STRATEGIES, BY YEAR
- FIGURE 43. TOP WINNING STRATEGIES, BY DEVELOPMENT
- FIGURE 44. TOP WINNING STRATEGIES, BY COMPANY
- FIGURE 45. PRODUCT MAPPING OF TOP 10 PLAYERS
- FIGURE 46. COMPETITIVE DASHBOARD
- FIGURE 47. COMPETITIVE HEATMAP: INFANT NUTRITION MARKET
- FIGURE 48. TOP PLAYER POSITIONING, 2022
- FIGURE 49. NESTLE S.A.: RESEARCH & DEVELOPMENT EXPENDITURE, 2020-2022 ($MILLION)
- FIGURE 50. NESTLE S.A.: NET SALES, 2020-2022 ($MILLION)
- FIGURE 51. NESTLE S.A.: REVENUE SHARE BY SEGMENT, 2022 (%)
- FIGURE 52. NESTLE S.A.: REVENUE SHARE BY REGION, 2022 (%)
- FIGURE 53. PERRIGO COMPANY PLC: NET SALES, 2020-2022 ($MILLION)
- FIGURE 54. PERRIGO COMPANY PLC: RESEARCH & DEVELOPMENT EXPENDITURE, 2020-2022 ($MILLION)
- FIGURE 55. PERRIGO COMPANY PLC: REVENUE SHARE BY SEGMENT, 2022 (%)
- FIGURE 56. PERRIGO COMPANY PLC: REVENUE SHARE BY REGION, 2022 (%)
- FIGURE 57. ABBOTT LABORATORIES: NET SALES, 2020-2022 ($MILLION)
- FIGURE 58. ABBOTT LABORATORIES: RESEARCH & DEVELOPMENT EXPENDITURE, 2020-2022 ($MILLION)
- FIGURE 59. ABBOTT LABORATORIES: REVENUE SHARE BY REGION, 2022 (%)
- FIGURE 60. ABBOTT LABORATORIES: REVENUE SHARE BY SEGMENT, 2022 (%)
- FIGURE 61. ARLA FOODS AMBA: NET REVENUE, 2020-2022 ($MILLION)
- FIGURE 62. ARLA FOODS AMBA: RESEARCH & DEVELOPMENT EXPENDITURE, 2020-2022 ($MILLION)
- FIGURE 63. ARLA FOODS AMBA: REVENUE SHARE BY SEGMENT, 2022 (%)
- FIGURE 64. ARLA FOODS AMBA: REVENUE SHARE BY REGION, 2022 (%)
- FIGURE 65. DANONE S.A.: NET SALES, 2020-2022 ($MILLION)
- FIGURE 66. DANONE S.A.: REVENUE SHARE BY SEGMENT, 2021 (%)
- FIGURE 67. THE KRAFT HEINZ COMPANY: NET SALES, 2020-2022 ($MILLION)
- FIGURE 68. THE KRAFT HEINZ COMPANY: RESEARCH & DEVELOPMENT EXPENDITURE, 2020-2022 ($MILLION)
- FIGURE 69. THE KRAFT HEINZ COMPANY: REVENUE SHARE BY SEGMENT, 2022 (%)
- FIGURE 70. THE KRAFT HEINZ COMPANY: REVENUE SHARE BY REGION, 2022 (%)
- FIGURE 71. GUJARAT COOPERATIVE MILK MARKETING FEDERATION LTD.: NET SALES, 2019-2021 ($MILLION)
- FIGURE 72. RECKITT BENCKISER GROUP PLC: NET REVENUE, 2020-2022 ($MILLION)
- FIGURE 73. RECKITT BENCKISER GROUP PLC: REVENUE SHARE BY SEGMENT, 2022 (%)
- FIGURE 74. RECKITT BENCKISER GROUP PLC: REVENUE SHARE BY REGION, 2022 (%)
According to a new report published by Allied Market Research, titled, "Infant Nutrition Market," The infant nutrition market was valued at $45.5 billion in 2022, and is estimated to reach $95.5 billion by 2032, growing at a CAGR of 7.7% from 2023 to 2032.
Infant nutrition is essential for the growth of infants due to rise in cases of malnutrition across the globe. Moreover, organ systems are not fully developed in children under the age of one. To develop normally, they require nutrition that is simple to digest and rich in the necessary amounts of calories, vitamins, minerals, and other nutrients, which can be provided through infant nutrition products.
Furthermore, as awareness of the advantages of a baby's balanced nutrition has grown, the demand for dried baby food has grown significantly over time. The market is stimulated to some extent by the dried baby food items' longer shelf lives. The baby food business has expanded as a result of evolving socioeconomic conditions and an improvement in living standards brought on by a significant increase in disposable income. Moreover, the adoption of baby food products has increased as a result of rise in the number of women working in professional fields, shorter maternity leaves, and time restrictions on meal preparation at home.
Dietary recommendations for feeding newborns have evolved throughout time. In addition, consumers are becoming more conscious of the importance of a nutritious diet for a baby's development. As a result, numerous businesses have added healthy & useful ingredients to their infant food products to increase the nutritional content. The government has simultaneously started initiatives to promote baby care awareness. Moreover, the market is growing as a result of increase in internet advertising for goods linked to baby food.
Global per capita income has increased significantly in recent years, particularly in emerging economies. The adoption of convenience-oriented lifestyles has been encouraged in many developing and developed markets due to increase in urbanization, rise in middle class consumption, and increase in rates of female labor force participation. This has increased consumer demand for infant nutrition products such as baby formula and prepared baby food. In addition, during the next ten years, per capita income in emerging countries will increase dramatically relative to wealthier nations.
The infant nutrition market is segmented on the basis of product type, form, distribution channel, and region. Depending on product type, it is categorized into follow-on milk, specialty baby milk, infant milk, prepared baby food, and dried baby food. According to form, it is bifurcated into solid baby food and liquid baby food. As per distribution channel, it is divided into e-commerce and offline channels. Moreover, the market is further classified into third-level segmentation through the distribution channel. Depending on offline channel, it is fragmented into hypermarkets/supermarkets, convenience stores, pharmacy, and others. Region wise, the market is analyzed across North America (the U.S., Canada, and Mexico), Europe (Germany, France, UK, Italy, Spain, Switzerland, and rest of Europe), Asia-Pacific (China, India, Japan, South Korea, Australia, and rest of Asia-Pacific), and LAMEA (Brazil, South Africa, UAE, and rest of LAMEA).
The key players operating in the infant nutrition industry include Abbott, Arla Foods Amba, Campbell Soups, Dana Dairy Group Ltd., Danone, Nestle S.A., Reckitt Benckise (Mead Johnson & Company LLC), Perrigo Company Plc, Heinz Baby, and Gujarat Co-operative Milk Marketing Federation Ltd. (GCMMF).
Key Benefits For Stakeholders
- This report provides a quantitative analysis of the market segments, current trends, estimations, and dynamics of the infant nutrition market analysis from 2022 to 2032 to identify the prevailing infant nutrition market opportunities.
- The market research is offered along with information related to key drivers, restraints, and opportunities.
- Porter's five forces analysis highlights the potency of buyers and suppliers to enable stakeholders make profit-oriented business decisions and strengthen their supplier-buyer network.
- In-depth analysis of the infant nutrition market segmentation assists to determine the prevailing market opportunities.
- Major countries in each region are mapped according to their revenue contribution to the global market.
- Market player positioning facilitates benchmarking and provides a clear understanding of the present position of the market players.
- The report includes the analysis of the regional as well as global infant nutrition market trends, key players, market segments, application areas, and market growth strategies.
Additional benefits you will get with this purchase are:
- Quarterly Update and* (only available with a corporate license, on listed price)
- 5 additional Company Profile of client Choice pre- or Post-purchase, as a free update.
- Free Upcoming Version on the Purchase of Five and Enterprise User License.
- 16 analyst hours of support* (post-purchase, if you find additional data requirements upon review of the report, you may receive support amounting to 16 analyst hours to solve questions, and post-sale queries)
- 15% Free Customization* (in case the scope or segment of the report does not match your requirements, 20% is equivalent to 3 working days of free work, applicable once)
- Free data Pack on the Five and Enterprise User License. (Excel version of the report)
- Free Updated report if the report is 6-12 months old or older.
- 24-hour priority response*
- Free Industry updates and white papers.
Possible Customization with this report (with additional cost and timeline talk to the sales executive to know more)
- Analysis of raw material in a product (by %)
- Manufacturing Capacity
- Consumer Buying Behavior Analysis
- Product Life Cycles
- Average Consumer Expenditure
- New Product Development/ Product Matrix of Key Players
- Pain Point Analysis
Key Market Segments
By Distribution Channel
- E-Commerce
- Offline channel
- Sub Type
- Pharmacy
- Convenience Stores
- Hypermarkets/Supermarkets
- Others
By Product Type
- Follow-on Milk
- Specialty baby milk
- Infant Milk
- Prepared baby food
- Dried baby food
By Form
- Solid baby food
- Liquid baby food
By Region
- North America
- U.S.
- Canada
- Mexico
- Europe
- Germany
- UK
- France
- Italy
- Spain
- Switzerland
- Rest of Europe
- Asia-Pacific
- China
- India
- Japan
- South Korea
- Australia
- Rest of Asia-Pacific
- LAMEA
- Brazil
- South Africa
- UAE
- Rest of LAMEA
Key Market Players:
- Abbott Laboratories
- Arla Foods amba
- DANA DAIRY GROUP LTD.
- Danone S.A.
- Gujarat Cooperative Milk Marketing Federation Ltd.
- Nestle S.A.
- Perrigo Company plc
- Reckitt Benckiser Group PLC
- Sun-Maid Growers of California, Inc.
- The Kraft Heinz Company
TABLE OF CONTENTS
CHAPTER 1: INTRODUCTION
- 1.1. Report description
- 1.2. Key market segments
- 1.3. Key benefits to the stakeholders
- 1.4. Research Methodology
- 1.4.1. Primary research
- 1.4.2. Secondary research
- 1.4.3. Analyst tools and models
CHAPTER 2: EXECUTIVE SUMMARY
- 2.1. CXO Perspective
CHAPTER 3: MARKET OVERVIEW
- 3.1. Market definition and scope
- 3.2. Key findings
- 3.2.1. Top impacting factors
- 3.2.2. Top investment pockets
- 3.3. Porter's five forces analysis
- 3.3.1. High bargaining power of suppliers
- 3.3.2. Low threat of new entrants
- 3.3.3. Moderate threat of substitutes
- 3.3.4. Moderate intensity of rivalry
- 3.3.5. Moderate bargaining power of buyers
- 3.4. Market dynamics
- 3.4.1. Drivers
- 3.4.1.1. Increase in awareness on adequate nutrition
- 3.4.1.2. Increase in awareness on adequate nutrition
- 3.4.1.3. Consumer busy lifestyle
- 3.4.1.4. Innovative packaging to influence buying behavior
- 3.4.1. Drivers
- 3.4.2. Restraints
- 3.4.2.1. Increase in breastfeeding due to government initiatives
- 3.4.3. Opportunities
- 3.4.3.1. Organic infant food for more nutritional value
- 3.4.3.2. Prebiotic and probiotics in infant food to cater to the nutritional demand
- 3.5. COVID-19 Impact Analysis on the market
CHAPTER 4: INFANT NUTRITION MARKET, BY PRODUCT TYPE
- 4.1. Overview
- 4.1.1. Market size and forecast
- 4.2. Follow-on Milk
- 4.2.1. Key market trends, growth factors and opportunities
- 4.2.2. Market size and forecast, by region
- 4.2.3. Market share analysis by country
- 4.3. Specialty baby milk
- 4.3.1. Key market trends, growth factors and opportunities
- 4.3.2. Market size and forecast, by region
- 4.3.3. Market share analysis by country
- 4.4. Infant Milk
- 4.4.1. Key market trends, growth factors and opportunities
- 4.4.2. Market size and forecast, by region
- 4.4.3. Market share analysis by country
- 4.5. Prepared baby food
- 4.5.1. Key market trends, growth factors and opportunities
- 4.5.2. Market size and forecast, by region
- 4.5.3. Market share analysis by country
- 4.6. Dried baby food
- 4.6.1. Key market trends, growth factors and opportunities
- 4.6.2. Market size and forecast, by region
- 4.6.3. Market share analysis by country
CHAPTER 5: INFANT NUTRITION MARKET, BY FORM
- 5.1. Overview
- 5.1.1. Market size and forecast
- 5.2. Solid baby food
- 5.2.1. Key market trends, growth factors and opportunities
- 5.2.2. Market size and forecast, by region
- 5.2.3. Market share analysis by country
- 5.3. Liquid baby food
- 5.3.1. Key market trends, growth factors and opportunities
- 5.3.2. Market size and forecast, by region
- 5.3.3. Market share analysis by country
CHAPTER 6: INFANT NUTRITION MARKET, BY DISTRIBUTION CHANNEL
- 6.1. Overview
- 6.1.1. Market size and forecast
- 6.2. E-Commerce
- 6.2.1. Key market trends, growth factors and opportunities
- 6.2.2. Market size and forecast, by region
- 6.2.3. Market share analysis by country
- 6.3. Offline channel
- 6.3.1. Key market trends, growth factors and opportunities
- 6.3.2. Market size and forecast, by region
- 6.3.3. Market share analysis by country
- 6.3.4. Offline channel Infant Nutrition Market by Sub Type
- 6.3.4.1. Pharmacy Market size and forecast, by region
- 6.3.4.2. Convenience Stores Market size and forecast, by region
- 6.3.4.3. Hypermarkets/Supermarkets Market size and forecast, by region
- 6.3.4.4. Others Market size and forecast, by region
CHAPTER 7: INFANT NUTRITION MARKET, BY REGION
- 7.1. Overview
- 7.1.1. Market size and forecast By Region
- 7.2. North America
- 7.2.1. Key trends and opportunities
- 7.2.2. Market size and forecast, by Product Type
- 7.2.3. Market size and forecast, by Form
- 7.2.4. Market size and forecast, by Distribution Channel
- 7.2.4.1. North America Offline channel Infant Nutrition Market by Sub Type
- 7.2.5. Market size and forecast, by country
- 7.2.5.1. U.S.
- 7.2.5.1.1. Key market trends, growth factors and opportunities
- 7.2.5.1.2. Market size and forecast, by Product Type
- 7.2.5.1.3. Market size and forecast, by Form
- 7.2.5.1.4. Market size and forecast, by Distribution Channel
- 7.2.5.2. Canada
- 7.2.5.2.1. Key market trends, growth factors and opportunities
- 7.2.5.2.2. Market size and forecast, by Product Type
- 7.2.5.2.3. Market size and forecast, by Form
- 7.2.5.2.4. Market size and forecast, by Distribution Channel
- 7.2.5.3. Mexico
- 7.2.5.3.1. Key market trends, growth factors and opportunities
- 7.2.5.3.2. Market size and forecast, by Product Type
- 7.2.5.3.3. Market size and forecast, by Form
- 7.2.5.3.4. Market size and forecast, by Distribution Channel
- 7.3. Europe
- 7.3.1. Key trends and opportunities
- 7.3.2. Market size and forecast, by Product Type
- 7.3.3. Market size and forecast, by Form
- 7.3.4. Market size and forecast, by Distribution Channel
- 7.3.4.1. Europe Offline channel Infant Nutrition Market by Sub Type
- 7.3.5. Market size and forecast, by country
- 7.3.5.1. Germany
- 7.3.5.1.1. Key market trends, growth factors and opportunities
- 7.3.5.1.2. Market size and forecast, by Product Type
- 7.3.5.1.3. Market size and forecast, by Form
- 7.3.5.1.4. Market size and forecast, by Distribution Channel
- 7.3.5.2. UK
- 7.3.5.2.1. Key market trends, growth factors and opportunities
- 7.3.5.2.2. Market size and forecast, by Product Type
- 7.3.5.2.3. Market size and forecast, by Form
- 7.3.5.2.4. Market size and forecast, by Distribution Channel
- 7.3.5.3. France
- 7.3.5.3.1. Key market trends, growth factors and opportunities
- 7.3.5.3.2. Market size and forecast, by Product Type
- 7.3.5.3.3. Market size and forecast, by Form
- 7.3.5.3.4. Market size and forecast, by Distribution Channel
- 7.3.5.4. Italy
- 7.3.5.4.1. Key market trends, growth factors and opportunities
- 7.3.5.4.2. Market size and forecast, by Product Type
- 7.3.5.4.3. Market size and forecast, by Form
- 7.3.5.4.4. Market size and forecast, by Distribution Channel
- 7.3.5.5. Spain
- 7.3.5.5.1. Key market trends, growth factors and opportunities
- 7.3.5.5.2. Market size and forecast, by Product Type
- 7.3.5.5.3. Market size and forecast, by Form
- 7.3.5.5.4. Market size and forecast, by Distribution Channel
- 7.3.5.6. Switzerland
- 7.3.5.6.1. Key market trends, growth factors and opportunities
- 7.3.5.6.2. Market size and forecast, by Product Type
- 7.3.5.6.3. Market size and forecast, by Form
- 7.3.5.6.4. Market size and forecast, by Distribution Channel
- 7.3.5.7. Rest of Europe
- 7.3.5.7.1. Key market trends, growth factors and opportunities
- 7.3.5.7.2. Market size and forecast, by Product Type
- 7.3.5.7.3. Market size and forecast, by Form
- 7.3.5.7.4. Market size and forecast, by Distribution Channel
- 7.4. Asia-Pacific
- 7.4.1. Key trends and opportunities
- 7.4.2. Market size and forecast, by Product Type
- 7.4.3. Market size and forecast, by Form
- 7.4.4. Market size and forecast, by Distribution Channel
- 7.4.4.1. Asia-Pacific Offline channel Infant Nutrition Market by Sub Type
- 7.4.5. Market size and forecast, by country
- 7.4.5.1. China
- 7.4.5.1.1. Key market trends, growth factors and opportunities
- 7.4.5.1.2. Market size and forecast, by Product Type
- 7.4.5.1.3. Market size and forecast, by Form
- 7.4.5.1.4. Market size and forecast, by Distribution Channel
- 7.4.5.2. India
- 7.4.5.2.1. Key market trends, growth factors and opportunities
- 7.4.5.2.2. Market size and forecast, by Product Type
- 7.4.5.2.3. Market size and forecast, by Form
- 7.4.5.2.4. Market size and forecast, by Distribution Channel
- 7.4.5.3. Japan
- 7.4.5.3.1. Key market trends, growth factors and opportunities
- 7.4.5.3.2. Market size and forecast, by Product Type
- 7.4.5.3.3. Market size and forecast, by Form
- 7.4.5.3.4. Market size and forecast, by Distribution Channel
- 7.4.5.4. South Korea
- 7.4.5.4.1. Key market trends, growth factors and opportunities
- 7.4.5.4.2. Market size and forecast, by Product Type
- 7.4.5.4.3. Market size and forecast, by Form
- 7.4.5.4.4. Market size and forecast, by Distribution Channel
- 7.4.5.5. Australia
- 7.4.5.5.1. Key market trends, growth factors and opportunities
- 7.4.5.5.2. Market size and forecast, by Product Type
- 7.4.5.5.3. Market size and forecast, by Form
- 7.4.5.5.4. Market size and forecast, by Distribution Channel
- 7.4.5.6. Rest of Asia-Pacific
- 7.4.5.6.1. Key market trends, growth factors and opportunities
- 7.4.5.6.2. Market size and forecast, by Product Type
- 7.4.5.6.3. Market size and forecast, by Form
- 7.4.5.6.4. Market size and forecast, by Distribution Channel
- 7.5. LAMEA
- 7.5.1. Key trends and opportunities
- 7.5.2. Market size and forecast, by Product Type
- 7.5.3. Market size and forecast, by Form
- 7.5.4. Market size and forecast, by Distribution Channel
- 7.5.4.1. LAMEA Offline channel Infant Nutrition Market by Sub Type
- 7.5.5. Market size and forecast, by country
- 7.5.5.1. Brazil
- 7.5.5.1.1. Key market trends, growth factors and opportunities
- 7.5.5.1.2. Market size and forecast, by Product Type
- 7.5.5.1.3. Market size and forecast, by Form
- 7.5.5.1.4. Market size and forecast, by Distribution Channel
- 7.5.5.2. South Africa
- 7.5.5.2.1. Key market trends, growth factors and opportunities
- 7.5.5.2.2. Market size and forecast, by Product Type
- 7.5.5.2.3. Market size and forecast, by Form
- 7.5.5.2.4. Market size and forecast, by Distribution Channel
- 7.5.5.3. UAE
- 7.5.5.3.1. Key market trends, growth factors and opportunities
- 7.5.5.3.2. Market size and forecast, by Product Type
- 7.5.5.3.3. Market size and forecast, by Form
- 7.5.5.3.4. Market size and forecast, by Distribution Channel
- 7.5.5.4. Rest of LAMEA
- 7.5.5.4.1. Key market trends, growth factors and opportunities
- 7.5.5.4.2. Market size and forecast, by Product Type
- 7.5.5.4.3. Market size and forecast, by Form
- 7.5.5.4.4. Market size and forecast, by Distribution Channel
CHAPTER 8: COMPETITIVE LANDSCAPE
- 8.1. Introduction
- 8.2. Top winning strategies
- 8.3. Product Mapping of Top 10 Player
- 8.4. Competitive Dashboard
- 8.5. Competitive Heatmap
- 8.6. Top player positioning, 2022
CHAPTER 9: COMPANY PROFILES
- 9.1. Nestle S.A.
- 9.1.1. Company overview
- 9.1.2. Key Executives
- 9.1.3. Company snapshot
- 9.1.4. Operating business segments
- 9.1.5. Product portfolio
- 9.1.6. Business performance
- 9.2. Perrigo Company plc
- 9.2.1. Company overview
- 9.2.2. Key Executives
- 9.2.3. Company snapshot
- 9.2.4. Operating business segments
- 9.2.5. Product portfolio
- 9.2.6. Business performance
- 9.2.7. Key strategic moves and developments
- 9.3. Abbott Laboratories
- 9.3.1. Company overview
- 9.3.2. Key Executives
- 9.3.3. Company snapshot
- 9.3.4. Operating business segments
- 9.3.5. Product portfolio
- 9.3.6. Business performance
- 9.3.7. Key strategic moves and developments
- 9.4. DANA DAIRY GROUP LTD.
- 9.4.1. Company overview
- 9.4.2. Key Executives
- 9.4.3. Company snapshot
- 9.4.4. Operating business segments
- 9.4.5. Product portfolio
- 9.5. Arla Foods amba
- 9.5.1. Company overview
- 9.5.2. Key Executives
- 9.5.3. Company snapshot
- 9.5.4. Operating business segments
- 9.5.5. Product portfolio
- 9.5.6. Business performance
- 9.5.7. Key strategic moves and developments
- 9.6. Danone S.A.
- 9.6.1. Company overview
- 9.6.2. Key Executives
- 9.6.3. Company snapshot
- 9.6.4. Operating business segments
- 9.6.5. Product portfolio
- 9.6.6. Business performance
- 9.6.7. Key strategic moves and developments
- 9.7. The Kraft Heinz Company
- 9.7.1. Company overview
- 9.7.2. Key Executives
- 9.7.3. Company snapshot
- 9.7.4. Operating business segments
- 9.7.5. Product portfolio
- 9.7.6. Business performance
- 9.8. Sun-Maid Growers of California, Inc.
- 9.8.1. Company overview
- 9.8.2. Key Executives
- 9.8.3. Company snapshot
- 9.8.4. Operating business segments
- 9.8.5. Product portfolio
- 9.8.6. Key strategic moves and developments
- 9.9. Gujarat Cooperative Milk Marketing Federation Ltd.
- 9.9.1. Company overview
- 9.9.2. Key Executives
- 9.9.3. Company snapshot
- 9.9.4. Operating business segments
- 9.9.5. Product portfolio
- 9.9.6. Business performance
- 9.10. Reckitt Benckiser Group PLC
- 9.10.1. Company overview
- 9.10.2. Key Executives
- 9.10.3. Company snapshot
- 9.10.4. Operating business segments
- 9.10.5. Product portfolio
- 9.10.6. Business performance
