
|
市場調査レポート
商品コード
1365585
モバイルアプリケーション市場:タイプ別、用途別:世界の機会分析と産業予測、2023~2032年Mobile Application Market By Type, By Application : Global Opportunity Analysis and Industry Forecast, 2023-2032 |
||||||
|
|||||||

| モバイルアプリケーション市場:タイプ別、用途別:世界の機会分析と産業予測、2023~2032年 |
|
出版日: 2023年07月01日
発行: Allied Market Research
ページ情報: 英文 277 Pages
納期: 2~3営業日
|

- 全表示
- 概要
- 図表
- 目次
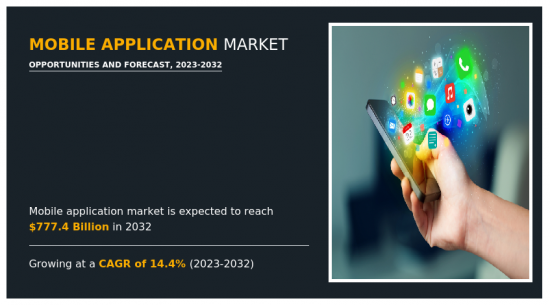
Allied Market Research発行の最新レポート「モバイルアプリケーション市場」によると、モバイルアプリケーション市場は2022年に2,084億6,000万米ドルと評価され、2032年には7,774億米ドルに達し、2023年から2032年までのCAGRは14.4%で成長すると推定されています。
さらに、AI、ML、クラウドコンピューティングなどの先進技術の統合は、新たな脅威をより効果的に検知・対応するなど、企業や消費者にとっていくつかのメリットを生み出す可能性を秘めています。モバイルアプリケーション・サービスは、エンドユーザーの効率性と生産性を向上させ、コストを削減するのに役立ちます。さらに、強化されたセキュリティ・ソリューションと、エンドユーザーにとってより良いユーザー・エクスペリエンスを提供することができます。さらに、モバイルアプリケーションは、進化・変化する消費者要件に適応する柔軟性と拡大性を提供します。これらの要素は、予測期間中に市場成長のための有利な機会を提供すると予想されます。
可変デバイス利用の増加、eコマース分野における顧客基盤の拡大などの要因。企業向けアプリケーションの急増、健康とフィットネスに特化したアプリへの注目の高まり、高いダウンロード率、ゲームアプリのアプリ内課金が市場の成長を後押ししています。しかし、新興国市場や低開発地域では高速接続環境が整っていないことや、企業が独自のアプリケーション開発に消極的であることが、市場の拡大を抑制すると予想されます。加えて、デジタル化投資の増加、モノのインターネット技術の採用増加、スマートアイテムのモバイル接続は、今後の市場拡大に大きな機会を提供すると予測されます。
タイプ別では、2022年のモバイルアプリケーション世界市場シェアはアップルアプリストアセグメントが独占しており、iPhone、iPod、iPadなどのガジェット向けのiOSオペレーティングシステム上で動作するさまざまなモバイルアプリケーションにより、今後もその優位性を維持すると予測されます。このストアは、iOSユーザーがお気に入りのプログラムを見つけ、ダウンロードし、アップデートするための中心的な場所であり、モバイル体験全体を向上させる。しかし、グーグル・プレイ・ストアは、アンドロイド・ユーザーにアプリケーションを配布するためのプラットフォームを開発者に提供するため、最も高い成長が見込まれています。
地域別では、アジア太平洋が2022年のモバイルアプリケーション市場で圧倒的なシェアを占めています。同地域は広大で多様な人口を抱え、地域固有または文化的に関連したアプリの作成につながるため、予測期間中に最も高い成長を示すと予想されます。また、インターネット接続の拡大と高速モバイルデータの利用可能性の向上により、アジアではより多くの人々がインターネットにアクセスしています。
- セグメント別レビュー
- モバイルアプリケーション市場は、タイプ、用途、地域に区分されます。タイプ別では、Apple app store、Google play store、その他に分類されます。用途別では、ゲーム、ソーシャルメディアとエンターテインメント、健康とフィットネス、旅行とホスピタリティ、小売とeコマース、学習と教育、その他に分類されます。地域別では、北米、欧州、アジア太平洋、ラテンアメリカ・中東・アフリカで分析されます。
- 世界のモバイルアプリケーション産業は、Microsoft Corporation、Hewlett Packard Enterprise Development LP、Apple Inc.、Intellectsoft US、Cognizant、Google LLC、Verbat Technologies、International Business Machines Corporation、CA Technologies, Inc.、China Mobile Limitedなどの主要参入企業によって支配されています。これらの参入企業は、市場への浸透を高め、モバイルアプリケーション業界における地位を強化するために様々な戦略を採用しています。
- COVID-19の影響分析
- COVID-19の流行はモバイルアプリケーション市場に大きな影響を与え、ユーザー行動に影響を与え、新たな動向を呼び起こし、特定のアプリケーションの需要に影響を与えました。パンデミックの間にリモートワークやバーチャルコラボレーションへのシフトが進んだため、リモートコミュニケーション、プロジェクト管理、ビデオ会議、文書共有を可能にするモバイルアプリケーションに対する需要が増加しました。個人が自宅で過ごす時間が長くなり、さまざまな作業をスマートフォンに依存するようになったため、モバイルアプリケーションの需要が高まっています。多くのモバイルアプリ開発者や企業にとって、これはダウンロード、利用、収入の増加につながっています。Zoom、Microsoft Teams、Slack、Google Meetなど、リモートワークや生産性を可能にするアプリケーションは、急激な発展を遂げています。パンデミックは健康とウェルビーイングへの関心を強め、フィットネスと健康に関するアプリケーションの需要を増加させました。
- 利害関係者にとっての主なメリット
- 当レポートでは、2022年から2032年までのモバイルアプリケーション市場分析の市場セグメント、現在の動向、推定・動向分析を定量的に提供し、一般的なモバイルアプリケーション市場の機会を特定します。
- 市場促進要因、市場抑制要因、市場機会に関連する情報とともに市場調査を提供します。
- ポーターのファイブフォース分析では、利害関係者が利益重視のビジネス決定を下し、サプライヤーとバイヤーのネットワークを強化できるよう、バイヤーとサプライヤーの潜在力を明らかにします。
- モバイルアプリケーション市場のセグメンテーションを詳細に分析することで、市場機会を見極めることができます。
- 各地域の主要国は、世界市場への収益貢献度に応じてマッピングされています。
- 市場参入企業のポジショニングはベンチマーキングを容易にし、市場参入企業の現在のポジションを明確に理解することができます。
- 本レポートには、地域別および世界のモバイルアプリケーション市場動向、主要企業、市場セグメント、応用分野、市場成長戦略の分析が含まれています。
その他の特典は以下の通りです:
- 四半期ごとのアップデートと*(法人向けライセンスでのみご利用いただけます。)
- 購入前または購入後に、ご希望の企業プロファイルを5社追加で無料アップデート。
- 5ユーザー・ライセンスおよびエンタープライズ・ユーザー・ライセンス購入の場合、次期バージョンを無料で提供。
- アナリストによる16時間のサポート*(購入後、レポートのレビューで追加データ要件が見つかった場合、質問や販売後の問い合わせを解決するためにアナリストによる16時間のサポートを受けることができます)
- 15%の無料カスタマイズ*(レポートの調査範囲またはセグメントがお客様の要件に一致しない場合、20%は3営業日の無料作業に相当します。)
- 5ユーザーライセンスおよびエンタープライズユーザーライセンスの無料データパック。(エクセル版レポート)
- レポートが6~12ヶ月以上前の場合、更新レポートを無料で提供。
- 24時間優先対応*。
- 業界の最新情報とホワイトペーパーを無料で提供
本レポートのカスタマイズも可能です。
- 製品ライフサイクル
- 規制ガイドライン
- クライアントの関心に応じた追加企業プロファイル
- 国別または地域別追加分析-市場規模と予測
- クリスクロスセグメント分析-市場規模と予測
- 過去の市場データ
- 主要参入企業の詳細(所在地、連絡先、サプライヤー/ベンダーネットワークなどを含む、エクセル形式)
- 世界/地域/国別レベルでの参入企業の市場シェア分析
- SWOT分析
目次
第1章 イントロダクション
第2章 エグゼクティブサマリー
第3章 市場概要
- 市場の定義と範囲
- 主な調査結果
- 影響要因
- 主な投資機会
- ポーターのファイブフォース分析
- 市場力学
- 促進要因
- データ使用量とインターネット普及率の増加
- ウェアラブルデバイスの採用急増
- スマートフォンユーザーの増加
- 抑制要因
- 発展途上地域や低開発地域における高速接続の欠如
- 企業による自社アプリケーション開発の不確実性
- 機会
- モノのインターネットやモバイル接続されたスマート・オブジェクトの採用の増加
- モバイルアプリにおける機械学習と人工知能の利用の増加
- 促進要因
- COVID-19市場への影響分析
第4章 モバイルアプリケーション市場:タイプ別
- 概要
- Appleアプリストア
- Googleプレイストア
- その他
第5章 モバイルアプリケーション市場:用途別
- 概要
- ゲーム
- ソーシャルメディアとエンターテインメント
- 健康とフィットネス
- 旅行とホスピタリティ
- 小売とeコマース
- 学習・教育
- その他
第6章 モバイルアプリケーション市場:地域別
- 概要
- 北米
- 米国
- カナダ
- 欧州
- 英国
- ドイツ
- フランス
- イタリア
- スペイン
- その他
- アジア太平洋
- 中国
- 日本
- インド
- オーストラリア
- 韓国
- その他
- ラテンアメリカ
- ラテンアメリカ
- 中東
- アフリカ
第7章 競合情勢
- イントロダクション
- 主要成功戦略
- 主要10社の製品マッピング
- 競合ダッシュボード
- 競合ヒートマップ
- 主要企業のポジショニング、2022年
第8章 企業プロファイル
- Microsoft Corporation
- Hewlett Packard Enterprise Development LP
- Apple Inc.
- Intellectsoft US
- Cognizant
- Google LLC
- Verbat Technologies
- International Business Machines Corporation
- CA Technologies, Inc.
- China Mobile Limited
LIST OF TABLES
- TABLE 01. GLOBAL MOBILE APPLICATION MARKET, BY TYPE, 2022-2032 ($BILLION)
- TABLE 02. MOBILE APPLICATION MARKET FOR APPLE APP STORE, BY REGION, 2022-2032 ($BILLION)
- TABLE 03. MOBILE APPLICATION MARKET FOR GOOGLE PLAY STORE, BY REGION, 2022-2032 ($BILLION)
- TABLE 04. MOBILE APPLICATION MARKET FOR OTHERS, BY REGION, 2022-2032 ($BILLION)
- TABLE 05. GLOBAL MOBILE APPLICATION MARKET, BY APPLICATION, 2022-2032 ($BILLION)
- TABLE 06. MOBILE APPLICATION MARKET FOR GAMING, BY REGION, 2022-2032 ($BILLION)
- TABLE 07. MOBILE APPLICATION MARKET FOR SOCIAL MEDIA AND ENTERTAINMENT, BY REGION, 2022-2032 ($BILLION)
- TABLE 08. MOBILE APPLICATION MARKET FOR HEALTH AND FITNESS, BY REGION, 2022-2032 ($BILLION)
- TABLE 09. MOBILE APPLICATION MARKET FOR TRAVEL AND HOSPITALITY, BY REGION, 2022-2032 ($BILLION)
- TABLE 10. MOBILE APPLICATION MARKET FOR RETAIL AND E-COMMERCE, BY REGION, 2022-2032 ($BILLION)
- TABLE 11. MOBILE APPLICATION MARKET FOR LEARNING AND EDUCATION, BY REGION, 2022-2032 ($BILLION)
- TABLE 12. MOBILE APPLICATION MARKET FOR OTHERS, BY REGION, 2022-2032 ($BILLION)
- TABLE 13. MOBILE APPLICATION MARKET, BY REGION, 2022-2032 ($BILLION)
- TABLE 14. NORTH AMERICA MOBILE APPLICATION MARKET, BY TYPE, 2022-2032 ($BILLION)
- TABLE 15. NORTH AMERICA MOBILE APPLICATION MARKET, BY APPLICATION, 2022-2032 ($BILLION)
- TABLE 16. NORTH AMERICA MOBILE APPLICATION MARKET, BY COUNTRY, 2022-2032 ($BILLION)
- TABLE 17. U.S. MOBILE APPLICATION MARKET, BY TYPE, 2022-2032 ($BILLION)
- TABLE 18. U.S. MOBILE APPLICATION MARKET, BY APPLICATION, 2022-2032 ($BILLION)
- TABLE 19. CANADA MOBILE APPLICATION MARKET, BY TYPE, 2022-2032 ($BILLION)
- TABLE 20. CANADA MOBILE APPLICATION MARKET, BY APPLICATION, 2022-2032 ($BILLION)
- TABLE 21. EUROPE MOBILE APPLICATION MARKET, BY TYPE, 2022-2032 ($BILLION)
- TABLE 22. EUROPE MOBILE APPLICATION MARKET, BY APPLICATION, 2022-2032 ($BILLION)
- TABLE 23. EUROPE MOBILE APPLICATION MARKET, BY COUNTRY, 2022-2032 ($BILLION)
- TABLE 24. UK MOBILE APPLICATION MARKET, BY TYPE, 2022-2032 ($BILLION)
- TABLE 25. UK MOBILE APPLICATION MARKET, BY APPLICATION, 2022-2032 ($BILLION)
- TABLE 26. GERMANY MOBILE APPLICATION MARKET, BY TYPE, 2022-2032 ($BILLION)
- TABLE 27. GERMANY MOBILE APPLICATION MARKET, BY APPLICATION, 2022-2032 ($BILLION)
- TABLE 28. FRANCE MOBILE APPLICATION MARKET, BY TYPE, 2022-2032 ($BILLION)
- TABLE 29. FRANCE MOBILE APPLICATION MARKET, BY APPLICATION, 2022-2032 ($BILLION)
- TABLE 30. ITALY MOBILE APPLICATION MARKET, BY TYPE, 2022-2032 ($BILLION)
- TABLE 31. ITALY MOBILE APPLICATION MARKET, BY APPLICATION, 2022-2032 ($BILLION)
- TABLE 32. SPAIN MOBILE APPLICATION MARKET, BY TYPE, 2022-2032 ($BILLION)
- TABLE 33. SPAIN MOBILE APPLICATION MARKET, BY APPLICATION, 2022-2032 ($BILLION)
- TABLE 34. REST OF EUROPE MOBILE APPLICATION MARKET, BY TYPE, 2022-2032 ($BILLION)
- TABLE 35. REST OF EUROPE MOBILE APPLICATION MARKET, BY APPLICATION, 2022-2032 ($BILLION)
- TABLE 36. ASIA-PACIFIC MOBILE APPLICATION MARKET, BY TYPE, 2022-2032 ($BILLION)
- TABLE 37. ASIA-PACIFIC MOBILE APPLICATION MARKET, BY APPLICATION, 2022-2032 ($BILLION)
- TABLE 38. ASIA-PACIFIC MOBILE APPLICATION MARKET, BY COUNTRY, 2022-2032 ($BILLION)
- TABLE 39. CHINA MOBILE APPLICATION MARKET, BY TYPE, 2022-2032 ($BILLION)
- TABLE 40. CHINA MOBILE APPLICATION MARKET, BY APPLICATION, 2022-2032 ($BILLION)
- TABLE 41. JAPAN MOBILE APPLICATION MARKET, BY TYPE, 2022-2032 ($BILLION)
- TABLE 42. JAPAN MOBILE APPLICATION MARKET, BY APPLICATION, 2022-2032 ($BILLION)
- TABLE 43. INDIA MOBILE APPLICATION MARKET, BY TYPE, 2022-2032 ($BILLION)
- TABLE 44. INDIA MOBILE APPLICATION MARKET, BY APPLICATION, 2022-2032 ($BILLION)
- TABLE 45. AUSTRALIA MOBILE APPLICATION MARKET, BY TYPE, 2022-2032 ($BILLION)
- TABLE 46. AUSTRALIA MOBILE APPLICATION MARKET, BY APPLICATION, 2022-2032 ($BILLION)
- TABLE 47. SOUTH KOREA MOBILE APPLICATION MARKET, BY TYPE, 2022-2032 ($BILLION)
- TABLE 48. SOUTH KOREA MOBILE APPLICATION MARKET, BY APPLICATION, 2022-2032 ($BILLION)
- TABLE 49. REST OF ASIA-PACIFIC MOBILE APPLICATION MARKET, BY TYPE, 2022-2032 ($BILLION)
- TABLE 50. REST OF ASIA-PACIFIC MOBILE APPLICATION MARKET, BY APPLICATION, 2022-2032 ($BILLION)
- TABLE 51. LAMEA MOBILE APPLICATION MARKET, BY TYPE, 2022-2032 ($BILLION)
- TABLE 52. LAMEA MOBILE APPLICATION MARKET, BY APPLICATION, 2022-2032 ($BILLION)
- TABLE 53. LAMEA MOBILE APPLICATION MARKET, BY COUNTRY, 2022-2032 ($BILLION)
- TABLE 54. LATIN AMERICA MOBILE APPLICATION MARKET, BY TYPE, 2022-2032 ($BILLION)
- TABLE 55. LATIN AMERICA MOBILE APPLICATION MARKET, BY APPLICATION, 2022-2032 ($BILLION)
- TABLE 56. MIDDLE EAST MOBILE APPLICATION MARKET, BY TYPE, 2022-2032 ($BILLION)
- TABLE 57. MIDDLE EAST MOBILE APPLICATION MARKET, BY APPLICATION, 2022-2032 ($BILLION)
- TABLE 58. AFRICA MOBILE APPLICATION MARKET, BY TYPE, 2022-2032 ($BILLION)
- TABLE 59. AFRICA MOBILE APPLICATION MARKET, BY APPLICATION, 2022-2032 ($BILLION)
- TABLE 60. MICROSOFT CORPORATION: KEY EXECUTIVES
- TABLE 61. MICROSOFT CORPORATION: COMPANY SNAPSHOT
- TABLE 62. MICROSOFT CORPORATION: SERVICE SEGMENTS
- TABLE 63. MICROSOFT CORPORATION: PRODUCT PORTFOLIO
- TABLE 64. MICROSOFT CORPORATION: KEY STRATERGIES
- TABLE 65. HEWLETT PACKARD ENTERPRISE DEVELOPMENT LP: KEY EXECUTIVES
- TABLE 66. HEWLETT PACKARD ENTERPRISE DEVELOPMENT LP: COMPANY SNAPSHOT
- TABLE 67. HEWLETT PACKARD ENTERPRISE DEVELOPMENT LP: SERVICE SEGMENTS
- TABLE 68. HEWLETT PACKARD ENTERPRISE DEVELOPMENT LP: PRODUCT PORTFOLIO
- TABLE 69. HEWLETT PACKARD ENTERPRISE DEVELOPMENT LP: KEY STRATERGIES
- TABLE 70. APPLE INC.: KEY EXECUTIVES
- TABLE 71. APPLE INC.: COMPANY SNAPSHOT
- TABLE 72. APPLE INC.: PRODUCT SEGMENTS
- TABLE 73. APPLE INC.: PRODUCT PORTFOLIO
- TABLE 74. APPLE INC.: KEY STRATERGIES
- TABLE 75. INTELLECTSOFT US: KEY EXECUTIVES
- TABLE 76. INTELLECTSOFT US: COMPANY SNAPSHOT
- TABLE 77. INTELLECTSOFT US: SERVICE SEGMENTS
- TABLE 78. INTELLECTSOFT US: PRODUCT PORTFOLIO
- TABLE 79. INTELLECTSOFT US: KEY STRATERGIES
- TABLE 80. COGNIZANT: KEY EXECUTIVES
- TABLE 81. COGNIZANT: COMPANY SNAPSHOT
- TABLE 82. COGNIZANT: SERVICE SEGMENTS
- TABLE 83. COGNIZANT: PRODUCT PORTFOLIO
- TABLE 84. COGNIZANT: KEY STRATERGIES
- TABLE 85. GOOGLE LLC: KEY EXECUTIVES
- TABLE 86. GOOGLE LLC: COMPANY SNAPSHOT
- TABLE 87. GOOGLE LLC: SERVICE SEGMENTS
- TABLE 88. GOOGLE LLC: PRODUCT PORTFOLIO
- TABLE 89. GOOGLE LLC: KEY STRATERGIES
- TABLE 90. VERBAT TECHNOLOGIES: KEY EXECUTIVES
- TABLE 91. VERBAT TECHNOLOGIES: COMPANY SNAPSHOT
- TABLE 92. VERBAT TECHNOLOGIES: SERVICE SEGMENTS
- TABLE 93. VERBAT TECHNOLOGIES: PRODUCT PORTFOLIO
- TABLE 94. INTERNATIONAL BUSINESS MACHINES CORPORATION: KEY EXECUTIVES
- TABLE 95. INTERNATIONAL BUSINESS MACHINES CORPORATION: COMPANY SNAPSHOT
- TABLE 96. INTERNATIONAL BUSINESS MACHINES CORPORATION: SERVICE SEGMENTS
- TABLE 97. INTERNATIONAL BUSINESS MACHINES CORPORATION: PRODUCT PORTFOLIO
- TABLE 98. INTERNATIONAL BUSINESS MACHINES CORPORATION: KEY STRATERGIES
- TABLE 99. CA TECHNOLOGIES, INC.: KEY EXECUTIVES
- TABLE 100. CA TECHNOLOGIES, INC.: COMPANY SNAPSHOT
- TABLE 101. CA TECHNOLOGIES, INC.: PRODUCT SEGMENTS
- TABLE 102. CA TECHNOLOGIES, INC.: SERVICE SEGMENTS
- TABLE 103. CA TECHNOLOGIES, INC.: PRODUCT PORTFOLIO
- TABLE 104. CHINA MOBILE LIMITED: KEY EXECUTIVES
- TABLE 105. CHINA MOBILE LIMITED: COMPANY SNAPSHOT
- TABLE 106. CHINA MOBILE LIMITED: SERVICE SEGMENTS
- TABLE 107. CHINA MOBILE LIMITED: PRODUCT PORTFOLIO
LIST OF FIGURES
- FIGURE 01. MOBILE APPLICATION MARKET, 2022-2032
- FIGURE 02. SEGMENTATION OF MOBILE APPLICATION MARKET, 2022-2032
- FIGURE 03. MOBILE APPLICATION MARKET,2022-2032
- FIGURE 04. TOP INVESTMENT POCKETS IN MOBILE APPLICATION MARKET (2023-2032)
- FIGURE 05. LOW BARGAINING POWER OF SUPPLIERS
- FIGURE 06. LOW THREAT OF NEW ENTRANTS
- FIGURE 07. LOW THREAT OF SUBSTITUTES
- FIGURE 08. LOW INTENSITY OF RIVALRY
- FIGURE 09. LOW BARGAINING POWER OF BUYERS
- FIGURE 10. GLOBAL MOBILE APPLICATION MARKET:DRIVERS, RESTRAINTS AND OPPORTUNITIES
- FIGURE 11. MOBILE APPLICATION MARKET, BY TYPE, 2022(%)
- FIGURE 12. COMPARATIVE SHARE ANALYSIS OF MOBILE APPLICATION MARKET FOR APPLE APP STORE, BY COUNTRY 2022-2032(%)
- FIGURE 13. COMPARATIVE SHARE ANALYSIS OF MOBILE APPLICATION MARKET FOR GOOGLE PLAY STORE, BY COUNTRY 2022-2032(%)
- FIGURE 14. COMPARATIVE SHARE ANALYSIS OF MOBILE APPLICATION MARKET FOR OTHERS, BY COUNTRY 2022-2032(%)
- FIGURE 15. MOBILE APPLICATION MARKET, BY APPLICATION, 2022(%)
- FIGURE 16. COMPARATIVE SHARE ANALYSIS OF MOBILE APPLICATION MARKET FOR GAMING, BY COUNTRY 2022-2032(%)
- FIGURE 17. COMPARATIVE SHARE ANALYSIS OF MOBILE APPLICATION MARKET FOR SOCIAL MEDIA AND ENTERTAINMENT, BY COUNTRY 2022-2032(%)
- FIGURE 18. COMPARATIVE SHARE ANALYSIS OF MOBILE APPLICATION MARKET FOR HEALTH AND FITNESS, BY COUNTRY 2022-2032(%)
- FIGURE 19. COMPARATIVE SHARE ANALYSIS OF MOBILE APPLICATION MARKET FOR TRAVEL AND HOSPITALITY, BY COUNTRY 2022-2032(%)
- FIGURE 20. COMPARATIVE SHARE ANALYSIS OF MOBILE APPLICATION MARKET FOR RETAIL AND E-COMMERCE, BY COUNTRY 2022-2032(%)
- FIGURE 21. COMPARATIVE SHARE ANALYSIS OF MOBILE APPLICATION MARKET FOR LEARNING AND EDUCATION, BY COUNTRY 2022-2032(%)
- FIGURE 22. COMPARATIVE SHARE ANALYSIS OF MOBILE APPLICATION MARKET FOR OTHERS, BY COUNTRY 2022-2032(%)
- FIGURE 23. MOBILE APPLICATION MARKET BY REGION, 2022
- FIGURE 24. U.S. MOBILE APPLICATION MARKET, 2022-2032 ($BILLION)
- FIGURE 25. CANADA MOBILE APPLICATION MARKET, 2022-2032 ($BILLION)
- FIGURE 26. UK MOBILE APPLICATION MARKET, 2022-2032 ($BILLION)
- FIGURE 27. GERMANY MOBILE APPLICATION MARKET, 2022-2032 ($BILLION)
- FIGURE 28. FRANCE MOBILE APPLICATION MARKET, 2022-2032 ($BILLION)
- FIGURE 29. ITALY MOBILE APPLICATION MARKET, 2022-2032 ($BILLION)
- FIGURE 30. SPAIN MOBILE APPLICATION MARKET, 2022-2032 ($BILLION)
- FIGURE 31. REST OF EUROPE MOBILE APPLICATION MARKET, 2022-2032 ($BILLION)
- FIGURE 32. CHINA MOBILE APPLICATION MARKET, 2022-2032 ($BILLION)
- FIGURE 33. JAPAN MOBILE APPLICATION MARKET, 2022-2032 ($BILLION)
- FIGURE 34. INDIA MOBILE APPLICATION MARKET, 2022-2032 ($BILLION)
- FIGURE 35. AUSTRALIA MOBILE APPLICATION MARKET, 2022-2032 ($BILLION)
- FIGURE 36. SOUTH KOREA MOBILE APPLICATION MARKET, 2022-2032 ($BILLION)
- FIGURE 37. REST OF ASIA-PACIFIC MOBILE APPLICATION MARKET, 2022-2032 ($BILLION)
- FIGURE 38. LATIN AMERICA MOBILE APPLICATION MARKET, 2022-2032 ($BILLION)
- FIGURE 39. MIDDLE EAST MOBILE APPLICATION MARKET, 2022-2032 ($BILLION)
- FIGURE 40. AFRICA MOBILE APPLICATION MARKET, 2022-2032 ($BILLION)
- FIGURE 41. TOP WINNING STRATEGIES, BY YEAR
- FIGURE 42. TOP WINNING STRATEGIES, BY DEVELOPMENT
- FIGURE 43. TOP WINNING STRATEGIES, BY COMPANY
- FIGURE 44. PRODUCT MAPPING OF TOP 10 PLAYERS
- FIGURE 45. COMPETITIVE DASHBOARD
- FIGURE 46. COMPETITIVE HEATMAP: MOBILE APPLICATION MARKET
- FIGURE 47. TOP PLAYER POSITIONING, 2022
- FIGURE 48. MICROSOFT CORPORATION: NET REVENUE, 2020-2022 ($MILLION)
- FIGURE 49. MICROSOFT CORPORATION: RESEARCH & DEVELOPMENT EXPENDITURE, 2020-2022 ($MILLION)
- FIGURE 50. MICROSOFT CORPORATION: REVENUE SHARE BY SEGMENT, 2022 (%)
- FIGURE 51. MICROSOFT CORPORATION: REVENUE SHARE BY REGION, 2022 (%)
- FIGURE 52. HEWLETT PACKARD ENTERPRISE DEVELOPMENT LP: NET REVENUE, 2019-2021 ($MILLION)
- FIGURE 53. HEWLETT PACKARD ENTERPRISE DEVELOPMENT LP: REVENUE SHARE BY SEGMENT, 2021 (%)
- FIGURE 54. HEWLETT PACKARD ENTERPRISE DEVELOPMENT LP: REVENUE SHARE BY REGION, 2021 (%)
- FIGURE 55. APPLE INC.: NET REVENUE, 2018-2020 ($MILLION)
- FIGURE 56. APPLE INC.: REVENUE SHARE BY SEGMENT, 2022 (%)
- FIGURE 57. APPLE INC.: REVENUE SHARE BY REGION, 2022 (%)
- FIGURE 58. COGNIZANT: NET REVENUE, 2020-2022 ($MILLION)
- FIGURE 59. COGNIZANT: REVENUE SHARE BY REGION, 2022 (%)
- FIGURE 60. GOOGLE LLC: NET REVENUE, 2020-2022 ($MILLION)
- FIGURE 61. GOOGLE LLC: RESEARCH & DEVELOPMENT EXPENDITURE, 2020-2022 ($MILLION)
- FIGURE 62. GOOGLE LLC: REVENUE SHARE BY REGION, 2022 (%)
- FIGURE 63. GOOGLE LLC: REVENUE SHARE BY SEGMENT, 2022 (%)
- FIGURE 64. INTERNATIONAL BUSINESS MACHINES CORPORATION: NET REVENUE, 2020-2022 ($MILLION)
- FIGURE 65. INTERNATIONAL BUSINESS MACHINES CORPORATION: RESEARCH & DEVELOPMENT EXPENDITURE, 2019-2021 ($MILLION
- FIGURE 66. INTERNATIONAL BUSINESS MACHINES CORPORATION: REVENUE SHARE BY REGION, 2022 (%)
- FIGURE 67. INTERNATIONAL BUSINESS MACHINES CORPORATION: REVENUE SHARE BY SEGMENT, 2022 (%)
- FIGURE 68. CA TECHNOLOGIES, INC.: NET REVENUE, 2020-2022 ($MILLION)
- FIGURE 69. CA TECHNOLOGIES, INC.: REVENUE SHARE BY SEGMENT, 2022 (%)
- FIGURE 70. CA TECHNOLOGIES, INC.: REVENUE SHARE BY REGION, 2022 (%)
- FIGURE 71. CHINA MOBILE LIMITED: NET REVENUE, 2020-2022 ($MILLION)
- FIGURE 72. CHINA MOBILE LIMITED: REVENUE SHARE BY SEGMENT, 2022 (%)
According to a new report published by Allied Market Research, titled, "Mobile Application Market," The mobile application market was valued at $208.46 billion in 2022, and is estimated to reach $777.4 billion by 2032, growing at a CAGR of 14.4% from 2023 to 2032.
Furthermore, the integration of advanced technologies such as AI, ML and cloud computing has the potential to create several benefits for businesses and consumers, including detecting and responding to emerging threats more effectively. A mobile application service can help to improve efficiency and productivity for end users, as well as reduce costs. Moreover, it can provide enhanced security solutions and a better user experience for end users. In addition, mobile applications provide flexibility and scalability to adapt to evolving and changing consumer requirements. These aforementioned factors are anticipated to provide lucrative opportunities for market growth during the forecast period.
Factors such as rise in variable device use and expanding client base in the e-commerce sector. Surge in enterprise applications, more attention on apps specifically utilized for health & fitness, strong download rates, and in-app purchases for gaming apps boost the growth of the market. However, the absence of high-speed connectivity in developing and underdeveloped areas as well as businesses' reluctance to develop their own applications are anticipated to restrain market expansion. In addition, rise in digitization investments, increased adoption of internet of things technologies, and mobile connectivity of smart items are anticipated to offer significant opportunities for market expansion in the future.
On the basis of the type, the global mobile application market share was dominated by the Apple app store segment in 2022 and is expected to maintain its dominance in the upcoming years, owing to different mobile applications that operate on the iOS operating system for gadgets such as iPhones, iPods and iPads. This store is a central location for iOS users to find, download, and update their favorite programs, boosting their overall mobile experience. However, the Google play store segment is expected to witness the highest growth, owing to provides developers with a platform to distribute their applications to android users globally.
By region, Asia-Pacific dominated the market share in 2022 for the mobile application market. The same region is expected to exhibit the highest growth during the forecast period, owing to vast and diverse population, leading to the creation of region-specific or culturally relevant apps. In addition, with the expansion of internet connectivity and the increasing availability of high-speed mobile data, more people in Asia have access to the internet.
- Segment Review
- The mobile application market is segmented into type, application, and region. By type, it is classified into Apple app store, Google play store, and others. By application, the market is categorized into gaming, social media and entertainment, health and fitness, travel and hospitality, retail and e-commerce, learning and education, and others. Region wise, it is analyzed across North America, Europe, Asia-Pacific, and LAMEA.
- The global mobile application industry is dominated by key players such as Microsoft Corporation, Hewlett Packard Enterprise Development LP, Apple Inc., Intellectsoft US, Cognizant, Google LLC, Verbat Technologies, International Business Machines Corporation, CA Technologies, Inc., and China Mobile Limited. These players have adopted various strategies to increase their market penetration and strengthen their position in the mobile application industry.
- COVID-19 Impact Analysis
- The COVID-19 pandemic had a considerable effect on the market for mobile applications, impacting user behavior, sparking new trends, and affecting the demand for particular applications. There has been an increase in demand for mobile applications that enable remote communication, project management, video conferencing, and document sharing owing to the shift towards remote work and virtual collaboration during the pandemic. The demand for mobile applications has grown as individuals spend more time at home and rely on their smartphones for various tasks. For many mobile app developers and businesses, this has resulted in an increase in downloads, usage, and income. Applications that enable remote work and productivity, such as Zoom, Microsoft Teams, Slack, and Google Meet, have seen exponential development. The pandemic has intensified attention on health and wellbeing, increasing demand for applications related to fitness and health.
- Key Benefits for Stakeholders
- This report provides a quantitative analysis of the market segments, current trends, estimations, and dynamics of the mobile application market analysis from 2022 to 2032 to identify the prevailing mobile application market opportunities.
- The market research is offered along with information related to key drivers, restraints, and opportunities.
- Porter's five forces analysis highlights the potency of buyers and suppliers to enable stakeholders make profit-oriented business decisions and strengthen their supplier-buyer network.
- In-depth analysis of the mobile application market segmentation assists to determine the prevailing market opportunities.
- Major countries in each region are mapped according to their revenue contribution to the global market.
- Market player positioning facilitates benchmarking and provides a clear understanding of the present position of the market players.
- The report includes the analysis of the regional as well as global mobile application market trends, key players, market segments, application areas, and market growth strategies.
Additional benefits you will get with this purchase are:
- Quarterly Update and* (only available with a corporate license, on listed price)
- 5 additional Company Profile of client Choice pre- or Post-purchase, as a free update.
- Free Upcoming Version on the Purchase of Five and Enterprise User License.
- 16 analyst hours of support* (post-purchase, if you find additional data requirements upon review of the report, you may receive support amounting to 16 analyst hours to solve questions, and post-sale queries)
- 15% Free Customization* (in case the scope or segment of the report does not match your requirements, 20% is equivalent to 3 working days of free work, applicable once)
- Free data Pack on the Five and Enterprise User License. (Excel version of the report)
- Free Updated report if the report is 6-12 months old or older.
- 24-hour priority response*
- Free Industry updates and white papers.
Possible Customization with this report (with additional cost and timeline talk to the sales executive to know more)
- Product Life Cycles
- Regulatory Guidelines
- Additional company profiles with specific to client's interest
- Additional country or region analysis- market size and forecast
- Criss-cross segment analysis- market size and forecast
- Historic market data
- Key player details (including location, contact details, supplier/vendor network etc. in excel format)
- Market share analysis of players at global/region/country level
- SWOT Analysis
Key Market Segments
By Type
- Apple App Store
- Google Play Store
- Others
By Application
- Gaming
- Social Media and Entertainment
- Health and Fitness
- Travel and Hospitality
- Retail and E-commerce
- Learning and Education
- Others
By Region
- North America
- U.S.
- Canada
- Europe
- UK
- Germany
- France
- Italy
- Spain
- Rest of Europe
- Asia-Pacific
- China
- Japan
- India
- Australia
- South Korea
- Rest of Asia-Pacific
- LAMEA
- Latin America
- Middle East
- Africa
Key Market Players:
- Apple Inc.
- CA Technologies, Inc.
- China Mobile Limited
- Cognizant
- Google LLC
- Hewlett Packard Enterprise Development LP
- Intellectsoft US
- International Business Machines Corporation
- Microsoft Corporation
- Verbat Technologies
TABLE OF CONTENTS
CHAPTER 1: INTRODUCTION
- 1.1. Report description
- 1.2. Key market segments
- 1.3. Key benefits to the stakeholders
- 1.4. Research Methodology
- 1.4.1. Primary research
- 1.4.2. Secondary research
- 1.4.3. Analyst tools and models
CHAPTER 2: EXECUTIVE SUMMARY
- 2.1. CXO Perspective
CHAPTER 3: MARKET OVERVIEW
- 3.1. Market definition and scope
- 3.2. Key findings
- 3.2.1. Top impacting factors
- 3.2.2. Top investment pockets
- 3.3. Porter's five forces analysis
- 3.3.1. Low bargaining power of suppliers
- 3.3.2. Low threat of new entrants
- 3.3.3. Low threat of substitutes
- 3.3.4. Low intensity of rivalry
- 3.3.5. Low bargaining power of buyers
- 3.4. Market dynamics
- 3.4.1. Drivers
- 3.4.1.1. Increase in data usage & internet penetration
- 3.4.1.2. Surge in adoption of wearable devices
- 3.4.1.3. Rise in smartphone users
- 3.4.1. Drivers
- 3.4.2. Restraints
- 3.4.2.1. Lack of high-speed connectivity in developing & underdeveloped regions
- 3.4.2.2. Uncertainty of enterprises in developing their own applications
- 3.4.3. Opportunities
- 3.4.3.1. Rise in adoption of internet of things and mobile-connected smart objects
- 3.4.3.2. Growth in usage of machine learning and artificial intelligence in mobile apps
- 3.5. COVID-19 Impact Analysis on the market
CHAPTER 4: MOBILE APPLICATION MARKET, BY TYPE
- 4.1. Overview
- 4.1.1. Market size and forecast
- 4.2. Apple App Store
- 4.2.1. Key market trends, growth factors and opportunities
- 4.2.2. Market size and forecast, by region
- 4.2.3. Market share analysis by country
- 4.3. Google Play Store
- 4.3.1. Key market trends, growth factors and opportunities
- 4.3.2. Market size and forecast, by region
- 4.3.3. Market share analysis by country
- 4.4. Others
- 4.4.1. Key market trends, growth factors and opportunities
- 4.4.2. Market size and forecast, by region
- 4.4.3. Market share analysis by country
CHAPTER 5: MOBILE APPLICATION MARKET, BY APPLICATION
- 5.1. Overview
- 5.1.1. Market size and forecast
- 5.2. Gaming
- 5.2.1. Key market trends, growth factors and opportunities
- 5.2.2. Market size and forecast, by region
- 5.2.3. Market share analysis by country
- 5.3. Social Media and Entertainment
- 5.3.1. Key market trends, growth factors and opportunities
- 5.3.2. Market size and forecast, by region
- 5.3.3. Market share analysis by country
- 5.4. Health and Fitness
- 5.4.1. Key market trends, growth factors and opportunities
- 5.4.2. Market size and forecast, by region
- 5.4.3. Market share analysis by country
- 5.5. Travel and Hospitality
- 5.5.1. Key market trends, growth factors and opportunities
- 5.5.2. Market size and forecast, by region
- 5.5.3. Market share analysis by country
- 5.6. Retail and E-commerce
- 5.6.1. Key market trends, growth factors and opportunities
- 5.6.2. Market size and forecast, by region
- 5.6.3. Market share analysis by country
- 5.7. Learning and Education
- 5.7.1. Key market trends, growth factors and opportunities
- 5.7.2. Market size and forecast, by region
- 5.7.3. Market share analysis by country
- 5.8. Others
- 5.8.1. Key market trends, growth factors and opportunities
- 5.8.2. Market size and forecast, by region
- 5.8.3. Market share analysis by country
CHAPTER 6: MOBILE APPLICATION MARKET, BY REGION
- 6.1. Overview
- 6.1.1. Market size and forecast By Region
- 6.2. North America
- 6.2.1. Key trends and opportunities
- 6.2.2. Market size and forecast, by Type
- 6.2.3. Market size and forecast, by Application
- 6.2.4. Market size and forecast, by country
- 6.2.4.1. U.S.
- 6.2.4.1.1. Key market trends, growth factors and opportunities
- 6.2.4.1.2. Market size and forecast, by Type
- 6.2.4.1.3. Market size and forecast, by Application
- 6.2.4.2. Canada
- 6.2.4.2.1. Key market trends, growth factors and opportunities
- 6.2.4.2.2. Market size and forecast, by Type
- 6.2.4.2.3. Market size and forecast, by Application
- 6.3. Europe
- 6.3.1. Key trends and opportunities
- 6.3.2. Market size and forecast, by Type
- 6.3.3. Market size and forecast, by Application
- 6.3.4. Market size and forecast, by country
- 6.3.4.1. UK
- 6.3.4.1.1. Key market trends, growth factors and opportunities
- 6.3.4.1.2. Market size and forecast, by Type
- 6.3.4.1.3. Market size and forecast, by Application
- 6.3.4.2. Germany
- 6.3.4.2.1. Key market trends, growth factors and opportunities
- 6.3.4.2.2. Market size and forecast, by Type
- 6.3.4.2.3. Market size and forecast, by Application
- 6.3.4.3. France
- 6.3.4.3.1. Key market trends, growth factors and opportunities
- 6.3.4.3.2. Market size and forecast, by Type
- 6.3.4.3.3. Market size and forecast, by Application
- 6.3.4.4. Italy
- 6.3.4.4.1. Key market trends, growth factors and opportunities
- 6.3.4.4.2. Market size and forecast, by Type
- 6.3.4.4.3. Market size and forecast, by Application
- 6.3.4.5. Spain
- 6.3.4.5.1. Key market trends, growth factors and opportunities
- 6.3.4.5.2. Market size and forecast, by Type
- 6.3.4.5.3. Market size and forecast, by Application
- 6.3.4.6. Rest of Europe
- 6.3.4.6.1. Key market trends, growth factors and opportunities
- 6.3.4.6.2. Market size and forecast, by Type
- 6.3.4.6.3. Market size and forecast, by Application
- 6.4. Asia-Pacific
- 6.4.1. Key trends and opportunities
- 6.4.2. Market size and forecast, by Type
- 6.4.3. Market size and forecast, by Application
- 6.4.4. Market size and forecast, by country
- 6.4.4.1. China
- 6.4.4.1.1. Key market trends, growth factors and opportunities
- 6.4.4.1.2. Market size and forecast, by Type
- 6.4.4.1.3. Market size and forecast, by Application
- 6.4.4.2. Japan
- 6.4.4.2.1. Key market trends, growth factors and opportunities
- 6.4.4.2.2. Market size and forecast, by Type
- 6.4.4.2.3. Market size and forecast, by Application
- 6.4.4.3. India
- 6.4.4.3.1. Key market trends, growth factors and opportunities
- 6.4.4.3.2. Market size and forecast, by Type
- 6.4.4.3.3. Market size and forecast, by Application
- 6.4.4.4. Australia
- 6.4.4.4.1. Key market trends, growth factors and opportunities
- 6.4.4.4.2. Market size and forecast, by Type
- 6.4.4.4.3. Market size and forecast, by Application
- 6.4.4.5. South Korea
- 6.4.4.5.1. Key market trends, growth factors and opportunities
- 6.4.4.5.2. Market size and forecast, by Type
- 6.4.4.5.3. Market size and forecast, by Application
- 6.4.4.6. Rest of Asia-Pacific
- 6.4.4.6.1. Key market trends, growth factors and opportunities
- 6.4.4.6.2. Market size and forecast, by Type
- 6.4.4.6.3. Market size and forecast, by Application
- 6.5. LAMEA
- 6.5.1. Key trends and opportunities
- 6.5.2. Market size and forecast, by Type
- 6.5.3. Market size and forecast, by Application
- 6.5.4. Market size and forecast, by country
- 6.5.4.1. Latin America
- 6.5.4.1.1. Key market trends, growth factors and opportunities
- 6.5.4.1.2. Market size and forecast, by Type
- 6.5.4.1.3. Market size and forecast, by Application
- 6.5.4.2. Middle East
- 6.5.4.2.1. Key market trends, growth factors and opportunities
- 6.5.4.2.2. Market size and forecast, by Type
- 6.5.4.2.3. Market size and forecast, by Application
- 6.5.4.3. Africa
- 6.5.4.3.1. Key market trends, growth factors and opportunities
- 6.5.4.3.2. Market size and forecast, by Type
- 6.5.4.3.3. Market size and forecast, by Application
CHAPTER 7: COMPETITIVE LANDSCAPE
- 7.1. Introduction
- 7.2. Top winning strategies
- 7.3. Product Mapping of Top 10 Player
- 7.4. Competitive Dashboard
- 7.5. Competitive Heatmap
- 7.6. Top player positioning, 2022
CHAPTER 8: COMPANY PROFILES
- 8.1. Microsoft Corporation
- 8.1.1. Company overview
- 8.1.2. Key Executives
- 8.1.3. Company snapshot
- 8.1.4. Operating business segments
- 8.1.5. Product portfolio
- 8.1.6. Business performance
- 8.1.7. Key strategic moves and developments
- 8.2. Hewlett Packard Enterprise Development LP
- 8.2.1. Company overview
- 8.2.2. Key Executives
- 8.2.3. Company snapshot
- 8.2.4. Operating business segments
- 8.2.5. Product portfolio
- 8.2.6. Business performance
- 8.2.7. Key strategic moves and developments
- 8.3. Apple Inc.
- 8.3.1. Company overview
- 8.3.2. Key Executives
- 8.3.3. Company snapshot
- 8.3.4. Operating business segments
- 8.3.5. Product portfolio
- 8.3.6. Business performance
- 8.3.7. Key strategic moves and developments
- 8.4. Intellectsoft US
- 8.4.1. Company overview
- 8.4.2. Key Executives
- 8.4.3. Company snapshot
- 8.4.4. Operating business segments
- 8.4.5. Product portfolio
- 8.4.6. Key strategic moves and developments
- 8.5. Cognizant
- 8.5.1. Company overview
- 8.5.2. Key Executives
- 8.5.3. Company snapshot
- 8.5.4. Operating business segments
- 8.5.5. Product portfolio
- 8.5.6. Business performance
- 8.5.7. Key strategic moves and developments
- 8.6. Google LLC
- 8.6.1. Company overview
- 8.6.2. Key Executives
- 8.6.3. Company snapshot
- 8.6.4. Operating business segments
- 8.6.5. Product portfolio
- 8.6.6. Business performance
- 8.6.7. Key strategic moves and developments
- 8.7. Verbat Technologies
- 8.7.1. Company overview
- 8.7.2. Key Executives
- 8.7.3. Company snapshot
- 8.7.4. Operating business segments
- 8.7.5. Product portfolio
- 8.8. International Business Machines Corporation
- 8.8.1. Company overview
- 8.8.2. Key Executives
- 8.8.3. Company snapshot
- 8.8.4. Operating business segments
- 8.8.5. Product portfolio
- 8.8.6. Business performance
- 8.8.7. Key strategic moves and developments
- 8.9. CA Technologies, Inc.
- 8.9.1. Company overview
- 8.9.2. Key Executives
- 8.9.3. Company snapshot
- 8.9.4. Operating business segments
- 8.9.5. Product portfolio
- 8.9.6. Business performance
- 8.10. China Mobile Limited
- 8.10.1. Company overview
- 8.10.2. Key Executives
- 8.10.3. Company snapshot
- 8.10.4. Operating business segments
- 8.10.5. Product portfolio
- 8.10.6. Business performance