
|
市場調査レポート
商品コード
1344552
セルフサービススーパーマーケット用センサー市場:コンポーネント別、タイプ別:世界の機会分析と産業予測、2023年~2032年Self Service Supermarket Sensor Market By Component (Systems, Services), By Type (Cash Based System, Cashless Based Systems): Global Opportunity Analysis and Industry Forecast, 2023-2032 |
||||||
|
|||||||

| セルフサービススーパーマーケット用センサー市場:コンポーネント別、タイプ別:世界の機会分析と産業予測、2023年~2032年 |
|
出版日: 2023年05月30日
発行: Allied Market Research
ページ情報: 英文 280 Pages
納期: 2~3営業日
|

- 全表示
- 概要
- 図表
- 目次
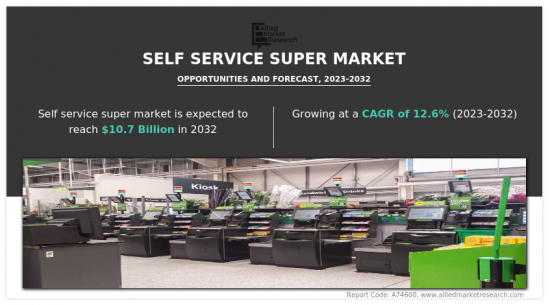
セルフサービススーパーマーケット用センサー市場は2022年に34億米ドルと評価され、2023年から2032年にかけてCAGR 12.6%で成長し、2032年には107億米ドルに達すると予測されています。
セルフサービススーパーマーケット用センサーは、小売業、スーパーマーケット、病院において、顧客がスタッフの助けを借りずにセルフオーダーやチェックアウトを行うための自動化技術です。以前のセルフレジシステムは、店舗で購入した別々の部品で構成されており、多くの保管スペースが必要だっています。それとは逆に、新しいセルフレジシステムは、消費者の需要を満たし、ビジネスのレイアウトにマッチし、機能性、コスト、フォームファクター、信頼性を向上させるために更新・作成されています。キオスクベンダーは、安全なセルフペイメント技術に対する需要の高まりから、すでにキャッシュレスソリューションを提供しています。
セルフサービススーパーマーケット用センサー技術は、ハイパーマーケットの近代的な小売業のパラダイムを一変させました。特に都市部や郊外地域の消費者は、この斬新なアプローチに熱狂しています。消費者がハイパーマーケットに魅了されるのは、必要不可欠なニーズや家庭用製品の要件を満たす、幅広い品揃えとブランドによるものです。買い物体験のあらゆる側面に消費者が積極的に参加することが、この近代的小売モデルを際立たせています。しかし、技術の進歩と現代生活の重視の高まりが、セルフサービスのハイパーマーケットの出現を加速させています。
ハイテクに精通した消費者の需要を満たすため、ハイパーマーケットにおける従来のレジ業務は、自動セルフレジステーションの導入を通じて変革されつつあります。これらのステーションは、最先端のセルフサービススーパーマーケット用センサー技術を特徴としています。顧客は、これらのセンサーを利用することで、商品を独自にスキャンして処理することができ、チェックアウトプロセスを迅速化し、人間のレジ係への依存度を下げることができます。この完全なセルフサービス設計は、現代の消費者の欲求に沿ったシームレスで効率的なショッピング体験を提供します。
しかし、データ漏洩、デバイスの誤作動、フィッシングの試み、ソフトウェア、ネットワークの欠陥など、特定の課題がセルフサービススーパーマーケット用センサーの採用を妨げると予想されます。例えば、安全でないネットワークを通じてデータがハッキングされるサイバー脅威の危険性が高いです。データハッカーは、消費者企業の口座の財務情報など、重要なデータや情報に素早く侵入し、アクセスすることができます。その結果、多大な金銭的損失や風評被害が発生する可能性があります。これは、予測期間中に市場の収益成長を妨げると予測される主な要因の1つです。
目次
第1章 イントロダクション
第2章 エグゼクティブサマリー
第3章 市場概要
- 市場の定義と範囲
- 主な調査結果
- 影響要因
- 主な投資機会
- ポーターのファイブフォース分析
- 市場力学
- 促進要因
- 抑制要因
- 機会
- COVID-19:市場への影響分析
- 平均販売価格
- ブランドシェア分析
- 主要規制分析
- 市場シェア分析
- 特許情勢
- 規制ガイドライン
- バリューチェーン分析
第4章 セルフサービススーパーマーケット用センサー市場:コンポーネント別
- 概要
- システム
- サービス
第5章 セルフサービススーパーマーケット用センサー市場:タイプ別
- 概要
- キャッシュベースシステム
- キャッシュレスシステム
第6章 セルフサービススーパーマーケット用センサー市場:地域別
- 概要
- 北米
- 米国
- カナダ
- メキシコ
- 欧州
- ドイツ
- 英国
- フランス
- スペイン
- イタリア
- その他欧州
- アジア太平洋
- 中国
- 日本
- インド
- 韓国
- オーストラリア
- その他アジア太平洋地域
- ラテンアメリカ・中東・アフリカ
- ブラジル
- サウジアラビア
- アラブ首長国連邦
- 南アフリカ
- その他ラテンアメリカ・中東・アフリカ
第7章 競合情勢
- イントロダクション
- 主要成功戦略
- 主要10社の製品マッピング
- 競合ダッシュボード
- 競合ヒートマップ
- 主要企業のポジショニング、2022年
第8章 企業プロファイル
- Diebold Nixdorf, Incorporated
- ECR Software Corporation
- Fujitsu Limited
- Gilbarco Inc.
- ITAB Group
- NCR Corporation
- Pan-Oston
- PCMS Group Ltd.
- Strong Point
- Toshiba Corporation
LIST OF TABLES
- TABLE 01. GLOBAL SELF SERVICE SUPERMARKET SENSOR MARKET, BY COMPONENT, 2022-2032 ($MILLION)
- TABLE 02. SELF SERVICE SUPERMARKET SENSOR MARKET FOR SYSTEMS, BY REGION, 2022-2032 ($MILLION)
- TABLE 03. SELF SERVICE SUPERMARKET SENSOR MARKET FOR SERVICES, BY REGION, 2022-2032 ($MILLION)
- TABLE 04. GLOBAL SELF SERVICE SUPERMARKET SENSOR MARKET, BY TYPE, 2022-2032 ($MILLION)
- TABLE 05. SELF SERVICE SUPERMARKET SENSOR MARKET FOR CASH BASED SYSTEM, BY REGION, 2022-2032 ($MILLION)
- TABLE 06. SELF SERVICE SUPERMARKET SENSOR MARKET FOR CASHLESS BASED SYSTEMS, BY REGION, 2022-2032 ($MILLION)
- TABLE 07. SELF SERVICE SUPERMARKET SENSOR MARKET, BY REGION, 2022-2032 ($MILLION)
- TABLE 08. NORTH AMERICA SELF SERVICE SUPERMARKET SENSOR MARKET, BY COMPONENT, 2022-2032 ($MILLION)
- TABLE 09. NORTH AMERICA SELF SERVICE SUPERMARKET SENSOR MARKET, BY TYPE, 2022-2032 ($MILLION)
- TABLE 10. NORTH AMERICA SELF SERVICE SUPERMARKET SENSOR MARKET, BY COUNTRY, 2022-2032 ($MILLION)
- TABLE 11. U.S. SELF SERVICE SUPERMARKET SENSOR MARKET, BY COMPONENT, 2022-2032 ($MILLION)
- TABLE 12. U.S. SELF SERVICE SUPERMARKET SENSOR MARKET, BY TYPE, 2022-2032 ($MILLION)
- TABLE 13. CANADA SELF SERVICE SUPERMARKET SENSOR MARKET, BY COMPONENT, 2022-2032 ($MILLION)
- TABLE 14. CANADA SELF SERVICE SUPERMARKET SENSOR MARKET, BY TYPE, 2022-2032 ($MILLION)
- TABLE 15. MEXICO SELF SERVICE SUPERMARKET SENSOR MARKET, BY COMPONENT, 2022-2032 ($MILLION)
- TABLE 16. MEXICO SELF SERVICE SUPERMARKET SENSOR MARKET, BY TYPE, 2022-2032 ($MILLION)
- TABLE 17. EUROPE SELF SERVICE SUPERMARKET SENSOR MARKET, BY COMPONENT, 2022-2032 ($MILLION)
- TABLE 18. EUROPE SELF SERVICE SUPERMARKET SENSOR MARKET, BY TYPE, 2022-2032 ($MILLION)
- TABLE 19. EUROPE SELF SERVICE SUPERMARKET SENSOR MARKET, BY COUNTRY, 2022-2032 ($MILLION)
- TABLE 20. GERMANY SELF SERVICE SUPERMARKET SENSOR MARKET, BY COMPONENT, 2022-2032 ($MILLION)
- TABLE 21. GERMANY SELF SERVICE SUPERMARKET SENSOR MARKET, BY TYPE, 2022-2032 ($MILLION)
- TABLE 22. UK SELF SERVICE SUPERMARKET SENSOR MARKET, BY COMPONENT, 2022-2032 ($MILLION)
- TABLE 23. UK SELF SERVICE SUPERMARKET SENSOR MARKET, BY TYPE, 2022-2032 ($MILLION)
- TABLE 24. FRANCE SELF SERVICE SUPERMARKET SENSOR MARKET, BY COMPONENT, 2022-2032 ($MILLION)
- TABLE 25. FRANCE SELF SERVICE SUPERMARKET SENSOR MARKET, BY TYPE, 2022-2032 ($MILLION)
- TABLE 26. SPAIN SELF SERVICE SUPERMARKET SENSOR MARKET, BY COMPONENT, 2022-2032 ($MILLION)
- TABLE 27. SPAIN SELF SERVICE SUPERMARKET SENSOR MARKET, BY TYPE, 2022-2032 ($MILLION)
- TABLE 28. ITALY SELF SERVICE SUPERMARKET SENSOR MARKET, BY COMPONENT, 2022-2032 ($MILLION)
- TABLE 29. ITALY SELF SERVICE SUPERMARKET SENSOR MARKET, BY TYPE, 2022-2032 ($MILLION)
- TABLE 30. REST OF EUROPE SELF SERVICE SUPERMARKET SENSOR MARKET, BY COMPONENT, 2022-2032 ($MILLION)
- TABLE 31. REST OF EUROPE SELF SERVICE SUPERMARKET SENSOR MARKET, BY TYPE, 2022-2032 ($MILLION)
- TABLE 32. ASIA-PACIFIC SELF SERVICE SUPERMARKET SENSOR MARKET, BY COMPONENT, 2022-2032 ($MILLION)
- TABLE 33. ASIA-PACIFIC SELF SERVICE SUPERMARKET SENSOR MARKET, BY TYPE, 2022-2032 ($MILLION)
- TABLE 34. ASIA-PACIFIC SELF SERVICE SUPERMARKET SENSOR MARKET, BY COUNTRY, 2022-2032 ($MILLION)
- TABLE 35. CHINA SELF SERVICE SUPERMARKET SENSOR MARKET, BY COMPONENT, 2022-2032 ($MILLION)
- TABLE 36. CHINA SELF SERVICE SUPERMARKET SENSOR MARKET, BY TYPE, 2022-2032 ($MILLION)
- TABLE 37. JAPAN SELF SERVICE SUPERMARKET SENSOR MARKET, BY COMPONENT, 2022-2032 ($MILLION)
- TABLE 38. JAPAN SELF SERVICE SUPERMARKET SENSOR MARKET, BY TYPE, 2022-2032 ($MILLION)
- TABLE 39. INDIA SELF SERVICE SUPERMARKET SENSOR MARKET, BY COMPONENT, 2022-2032 ($MILLION)
- TABLE 40. INDIA SELF SERVICE SUPERMARKET SENSOR MARKET, BY TYPE, 2022-2032 ($MILLION)
- TABLE 41. SOUTH KOREA SELF SERVICE SUPERMARKET SENSOR MARKET, BY COMPONENT, 2022-2032 ($MILLION)
- TABLE 42. SOUTH KOREA SELF SERVICE SUPERMARKET SENSOR MARKET, BY TYPE, 2022-2032 ($MILLION)
- TABLE 43. AUSTRALIA SELF SERVICE SUPERMARKET SENSOR MARKET, BY COMPONENT, 2022-2032 ($MILLION)
- TABLE 44. AUSTRALIA SELF SERVICE SUPERMARKET SENSOR MARKET, BY TYPE, 2022-2032 ($MILLION)
- TABLE 45. REST OF ASIA-PACIFIC SELF SERVICE SUPERMARKET SENSOR MARKET, BY COMPONENT, 2022-2032 ($MILLION)
- TABLE 46. REST OF ASIA-PACIFIC SELF SERVICE SUPERMARKET SENSOR MARKET, BY TYPE, 2022-2032 ($MILLION)
- TABLE 47. LAMEA SELF SERVICE SUPERMARKET SENSOR MARKET, BY COMPONENT, 2022-2032 ($MILLION)
- TABLE 48. LAMEA SELF SERVICE SUPERMARKET SENSOR MARKET, BY TYPE, 2022-2032 ($MILLION)
- TABLE 49. LAMEA SELF SERVICE SUPERMARKET SENSOR MARKET, BY COUNTRY, 2022-2032 ($MILLION)
- TABLE 50. BRAZIL SELF SERVICE SUPERMARKET SENSOR MARKET, BY COMPONENT, 2022-2032 ($MILLION)
- TABLE 51. BRAZIL SELF SERVICE SUPERMARKET SENSOR MARKET, BY TYPE, 2022-2032 ($MILLION)
- TABLE 52. SAUDI ARABIA SELF SERVICE SUPERMARKET SENSOR MARKET, BY COMPONENT, 2022-2032 ($MILLION)
- TABLE 53. SAUDI ARABIA SELF SERVICE SUPERMARKET SENSOR MARKET, BY TYPE, 2022-2032 ($MILLION)
- TABLE 54. UAE SELF SERVICE SUPERMARKET SENSOR MARKET, BY COMPONENT, 2022-2032 ($MILLION)
- TABLE 55. UAE SELF SERVICE SUPERMARKET SENSOR MARKET, BY TYPE, 2022-2032 ($MILLION)
- TABLE 56. SOUTH AFRICA SELF SERVICE SUPERMARKET SENSOR MARKET, BY COMPONENT, 2022-2032 ($MILLION)
- TABLE 57. SOUTH AFRICA SELF SERVICE SUPERMARKET SENSOR MARKET, BY TYPE, 2022-2032 ($MILLION)
- TABLE 58. REST OF LAMEA SELF SERVICE SUPERMARKET SENSOR MARKET, BY COMPONENT, 2022-2032 ($MILLION)
- TABLE 59. REST OF LAMEA SELF SERVICE SUPERMARKET SENSOR MARKET, BY TYPE, 2022-2032 ($MILLION)
- TABLE 60. DIEBOLD NIXDORF, INCORPORATED.: KEY EXECUTIVES
- TABLE 61. DIEBOLD NIXDORF, INCORPORATED.: COMPANY SNAPSHOT
- TABLE 62. ECR SOFTWARE CORPORATION: KEY EXECUTIVES
- TABLE 63. ECR SOFTWARE CORPORATION: COMPANY SNAPSHOT
- TABLE 64. FUJITSU LIMITED: KEY EXECUTIVES
- TABLE 65. FUJITSU LIMITED: COMPANY SNAPSHOT
- TABLE 66. GILBARCO INC.: KEY EXECUTIVES
- TABLE 67. GILBARCO INC.: COMPANY SNAPSHOT
- TABLE 68. ITAB GROUP: KEY EXECUTIVES
- TABLE 69. ITAB GROUP: COMPANY SNAPSHOT
- TABLE 70. NCR CORPORATION: KEY EXECUTIVES
- TABLE 71. NCR CORPORATION: COMPANY SNAPSHOT
- TABLE 72. PAN-OSTON: KEY EXECUTIVES
- TABLE 73. PAN-OSTON: COMPANY SNAPSHOT
- TABLE 74. PCMS GROUP LTD.: KEY EXECUTIVES
- TABLE 75. PCMS GROUP LTD.: COMPANY SNAPSHOT
- TABLE 76. STRONG POINT: KEY EXECUTIVES
- TABLE 77. STRONG POINT: COMPANY SNAPSHOT
- TABLE 78. TOSHIBA CORPORATION.: KEY EXECUTIVES
- TABLE 79. TOSHIBA CORPORATION.: COMPANY SNAPSHOT
LIST OF FIGURES
- FIGURE 01. SELF SERVICE SUPERMARKET SENSOR MARKET, 2022-2032
- FIGURE 02. SEGMENTATION OF SELF SERVICE SUPERMARKET SENSOR MARKET, 2022-2032
- FIGURE 03. TOP INVESTMENT POCKETS IN SELF SERVICE SUPERMARKET SENSOR MARKET (2023-2032)
- FIGURE 04. PORTER FIVE-1
- FIGURE 05. PORTER FIVE-2
- FIGURE 06. PORTER FIVE-3
- FIGURE 07. PORTER FIVE-4
- FIGURE 08. PORTER FIVE-5
- FIGURE 09. DRIVERS, RESTRAINTS AND OPPORTUNITIES: GLOBALSELF SERVICE SUPERMARKET SENSOR MARKET
- FIGURE 10. IMPACT OF KEY REGULATION: SELF SERVICE SUPERMARKET SENSOR MARKET
- FIGURE 11. MARKET SHARE ANALYSIS: SELF SERVICE SUPERMARKET SENSOR MARKET
- FIGURE 12. PATENT ANALYSIS BY COMPANY
- FIGURE 13. PATENT ANALYSIS BY COUNTRY
- FIGURE 14. REGULATORY GUIDELINES: SELF SERVICE SUPERMARKET SENSOR MARKET
- FIGURE 15. VALUE CHAIN ANALYSIS: SELF SERVICE SUPERMARKET SENSOR MARKET
- FIGURE 16. SELF SERVICE SUPERMARKET SENSOR MARKET, BY COMPONENT, 2022(%)
- FIGURE 17. COMPARATIVE SHARE ANALYSIS OF SELF SERVICE SUPERMARKET SENSOR MARKET FOR SYSTEMS, BY COUNTRY 2022 AND 2032(%)
- FIGURE 18. COMPARATIVE SHARE ANALYSIS OF SELF SERVICE SUPERMARKET SENSOR MARKET FOR SERVICES, BY COUNTRY 2022 AND 2032(%)
- FIGURE 19. SELF SERVICE SUPERMARKET SENSOR MARKET, BY TYPE, 2022(%)
- FIGURE 20. COMPARATIVE SHARE ANALYSIS OF SELF SERVICE SUPERMARKET SENSOR MARKET FOR CASH BASED SYSTEM, BY COUNTRY 2022 AND 2032(%)
- FIGURE 21. COMPARATIVE SHARE ANALYSIS OF SELF SERVICE SUPERMARKET SENSOR MARKET FOR CASHLESS BASED SYSTEMS, BY COUNTRY 2022 AND 2032(%)
- FIGURE 22. SELF SERVICE SUPERMARKET SENSOR MARKET BY REGION, 2022
- FIGURE 23. U.S. SELF SERVICE SUPERMARKET SENSOR MARKET, 2022-2032 ($MILLION)
- FIGURE 24. CANADA SELF SERVICE SUPERMARKET SENSOR MARKET, 2022-2032 ($MILLION)
- FIGURE 25. MEXICO SELF SERVICE SUPERMARKET SENSOR MARKET, 2022-2032 ($MILLION)
- FIGURE 26. GERMANY SELF SERVICE SUPERMARKET SENSOR MARKET, 2022-2032 ($MILLION)
- FIGURE 27. UK SELF SERVICE SUPERMARKET SENSOR MARKET, 2022-2032 ($MILLION)
- FIGURE 28. FRANCE SELF SERVICE SUPERMARKET SENSOR MARKET, 2022-2032 ($MILLION)
- FIGURE 29. SPAIN SELF SERVICE SUPERMARKET SENSOR MARKET, 2022-2032 ($MILLION)
- FIGURE 30. ITALY SELF SERVICE SUPERMARKET SENSOR MARKET, 2022-2032 ($MILLION)
- FIGURE 31. REST OF EUROPE SELF SERVICE SUPERMARKET SENSOR MARKET, 2022-2032 ($MILLION)
- FIGURE 32. CHINA SELF SERVICE SUPERMARKET SENSOR MARKET, 2022-2032 ($MILLION)
- FIGURE 33. JAPAN SELF SERVICE SUPERMARKET SENSOR MARKET, 2022-2032 ($MILLION)
- FIGURE 34. INDIA SELF SERVICE SUPERMARKET SENSOR MARKET, 2022-2032 ($MILLION)
- FIGURE 35. SOUTH KOREA SELF SERVICE SUPERMARKET SENSOR MARKET, 2022-2032 ($MILLION)
- FIGURE 36. AUSTRALIA SELF SERVICE SUPERMARKET SENSOR MARKET, 2022-2032 ($MILLION)
- FIGURE 37. REST OF ASIA-PACIFIC SELF SERVICE SUPERMARKET SENSOR MARKET, 2022-2032 ($MILLION)
- FIGURE 38. BRAZIL SELF SERVICE SUPERMARKET SENSOR MARKET, 2022-2032 ($MILLION)
- FIGURE 39. SAUDI ARABIA SELF SERVICE SUPERMARKET SENSOR MARKET, 2022-2032 ($MILLION)
- FIGURE 40. UAE SELF SERVICE SUPERMARKET SENSOR MARKET, 2022-2032 ($MILLION)
- FIGURE 41. SOUTH AFRICA SELF SERVICE SUPERMARKET SENSOR MARKET, 2022-2032 ($MILLION)
- FIGURE 42. REST OF LAMEA SELF SERVICE SUPERMARKET SENSOR MARKET, 2022-2032 ($MILLION)
- FIGURE 43. TOP WINNING STRATEGIES, BY YEAR
- FIGURE 44. TOP WINNING STRATEGIES, BY DEVELOPMENT
- FIGURE 45. TOP WINNING STRATEGIES, BY COMPANY
- FIGURE 46. PRODUCT MAPPING OF TOP 10 PLAYERS
- FIGURE 47. COMPETITIVE DASHBOARD
- FIGURE 48. COMPETITIVE HEATMAP: SELF SERVICE SUPERMARKET SENSOR MARKET
- FIGURE 49. TOP PLAYER POSITIONING, 2022
According to a new report published by Allied Market Research, titled, "Self Service Supermarket Sensor Market," The self service supermarket sensor market was valued at $3.4 billion in 2022, and is estimated to reach $10.7 billion by 2032, growing at a CAGR of 12.6% from 2023 to 2032.
Self service supermarket sensors are automated technologies that help customers self-order and check out without the aid of any staff members in the retail, supermarket, and hospitality industry. The earlier self-checkout systems were made up of separate, store-bought parts and needed a lot of storage space. On the contrary, new self-checkout systems are updated and created to meet consumer demand, match the layout of the business, and improve functionality, cost, form factors, and dependability. Kiosk vendors are already providing cashless solutions due to the rising demand for safe and self-payment technologies.
Self service supermarket sensor technology has transformed the modern retailing paradigm of hypermarkets. Consumers, particularly in urban and suburban regions, are enthusiastic about this novel approach. Customers are attracted to hypermarkets due to the extensive range of products and brands available, which fulfills their essential needs and household product requirements. The active participation of consumers in all aspects of the shopping experience distinguishes this modern retailing model. However, technological advancements and an increasing emphasis on modern lives have accelerated the emergence of self-service hypermarkets.
To fulfill the demands of tech-savvy customers, traditional cashiering operations in hypermarkets are being revolutionized through the incorporation of automatic self-checkout stations. These stations feature cutting-edge self service supermarket sensor technology. Customers can independently scan and process their goods by utilizing these sensors, expediting the checkout process, and lowering dependency on human cashiers. This totally self-service design provides a seamless and efficient shopping experience that aligns with modern consumer desires.
However, certain challenges such as data leaks, device malfunctions, phishing attempts, software, and network flaws are expected to hamper the adoption of self service supermarket sensors. For example, there is a high danger of cyber threats in which data can be hacked through unsafe and insecure networks. Data hackers can quickly breach and access crucial data and information, such as the financial credentials of consumer company accounts. This might result in significant financial loss as well as reputational damage. This is one of the major factors projected to hamper the market revenue growth during the forecast period.
Artificial intelligence is changing the retail shopping experience, allowing customers to pick up what they want and walk out the door without having to scan products or wait in a queue to pay. With the use of AI, machine vision, and deep learning, an increasing number of merchants are using autonomous shopping technology. During the COVID-19 pandemic, smart self-checkout solutions, such as AI-powered smart checkout systems and shopping carts, incorporate product recognition to give consumers contactless and automated checkout services. . Customers get a better shopping experience, and business owners save money on personnel overhead. The Al-powered smart checkout systems and shopping carts incorporate AI smart cameras, sensors, an edge AI system, and AI learning technology to speed up checkout services and eliminate human errors, allowing customers to enjoy quick checkout by completing purchases with speed, convenience, and simplicity. The smart camera takes a picture of the purchased item and displays it on the touchscreen. When the consumer authorizes the purchase, the screen displays payment information such as the number of things to be purchased and the total amount to be paid.
The COVID-19 pandemic has had significant impact on the self service supermarket sensor market. The need for self-service checkout supermarkets has rapidly expanded with the acceptance of remote work and virtual collaboration. The COVID-19 pandemic has also caused issues in the self service supermarket sensor industry. Consumer footfall at retail outlets, notably supermarkets, fell as a result of the fear and uncertainty about the virus. This decrease in consumer traffic influenced the adoption and use of self-service technologies. The pandemic also prompted the deployment of additional hygiene and sanitization methods. To maintain a safe shopping environment, supermarkets were required to ensure that self service supermarket sensors are cleaned and disinfected on a regular basis. These additional restrictions led to an increase in the operational challenges and costs for merchants.
The key players profiled in this report include: Nudge Rewards Inc., GuideSpark, Beekeeper AG, Sociabble, Inc., SocialChorus. Inc., Poppulo, OurPeople, Smarp, theemployeeapp, and Workvivo Limited. The market players are continuously striving to achieve a strong position in this competitive market using strategies such as collaborations and acquisitions.
Key Benefits For Stakeholders
- This report provides a quantitative analysis of the market segments, current trends, estimations, and dynamics of the self service supermarket sensor market analysis from 2022 to 2032 to identify the prevailing self service supermarket sensor market opportunities.
- The market research is offered along with information related to key drivers, restraints, and opportunities.
- Porter's five forces analysis highlights the potency of buyers and suppliers to enable stakeholders make profit-oriented business decisions and strengthen their supplier-buyer network.
- In-depth analysis of the self service supermarket sensor market segmentation assists to determine the prevailing market opportunities.
- Major countries in each region are mapped according to their revenue contribution to the global market.
- Market player positioning facilitates benchmarking and provides a clear understanding of the present position of the market players.
- The report includes the analysis of the regional as well as global self service supermarket sensor market trends, key players, market segments, application areas, and market growth strategies.
Key Market Segments
By Component
- Systems
- Services
By Type
- Cash Based System
- Cashless Based Systems
By Region
- North America
- U.S.
- Canada
- Mexico
- Europe
- Germany
- UK
- France
- Spain
- Italy
- Rest of Europe
- Asia-Pacific
- China
- Japan
- India
- South Korea
- Australia
- Rest of Asia-Pacific
- LAMEA
- Brazil
- Saudi Arabia
- UAE
- South Africa
- Rest of LAMEA
Key Market Players:
- Diebold Nixdorf, Incorporated.
- ECR Software Corporation
- Fujitsu Limited
- Gilbarco Inc.
- ITAB Group
- NCR Corporation
- Pan-Oston
- PCMS Group Ltd.
- Strong Point
- Toshiba Corporation.
TABLE OF CONTENTS
CHAPTER 1: INTRODUCTION
- 1.1. Report description
- 1.2. Key market segments
- 1.3. Key benefits to the stakeholders
- 1.4. Research Methodology
- 1.4.1. Primary research
- 1.4.2. Secondary research
- 1.4.3. Analyst tools and models
CHAPTER 2: EXECUTIVE SUMMARY
- 2.1. CXO Perspective
CHAPTER 3: MARKET OVERVIEW
- 3.1. Market definition and scope
- 3.2. Key findings
- 3.2.1. Top impacting factors
- 3.2.2. Top investment pockets
- 3.3. Porter's five forces analysis
- 3.4. Market dynamics
- 3.4.1. Drivers
- 3.4.2. Restraints
- 3.4.3. Opportunities
- 3.5. COVID-19 Impact Analysis on the market
- 3.6. Average Selling Price
- 3.7. Brand Share Analysis
- 3.8. Key Regulation Analysis
- 3.9. Market Share Analysis
- 3.10. Patent Landscape
- 3.11. Regulatory Guidelines
- 3.12. Value Chain Analysis
CHAPTER 4: SELF SERVICE SUPERMARKET SENSOR MARKET, BY COMPONENT
- 4.1. Overview
- 4.1.1. Market size and forecast
- 4.2. Systems
- 4.2.1. Key market trends, growth factors and opportunities
- 4.2.2. Market size and forecast, by region
- 4.2.3. Market share analysis by country
- 4.3. Services
- 4.3.1. Key market trends, growth factors and opportunities
- 4.3.2. Market size and forecast, by region
- 4.3.3. Market share analysis by country
CHAPTER 5: SELF SERVICE SUPERMARKET SENSOR MARKET, BY TYPE
- 5.1. Overview
- 5.1.1. Market size and forecast
- 5.2. Cash Based System
- 5.2.1. Key market trends, growth factors and opportunities
- 5.2.2. Market size and forecast, by region
- 5.2.3. Market share analysis by country
- 5.3. Cashless Based Systems
- 5.3.1. Key market trends, growth factors and opportunities
- 5.3.2. Market size and forecast, by region
- 5.3.3. Market share analysis by country
CHAPTER 6: SELF SERVICE SUPERMARKET SENSOR MARKET, BY REGION
- 6.1. Overview
- 6.1.1. Market size and forecast By Region
- 6.2. North America
- 6.2.1. Key trends and opportunities
- 6.2.2. Market size and forecast, by Component
- 6.2.3. Market size and forecast, by Type
- 6.2.4. Market size and forecast, by country
- 6.2.4.1. U.S.
- 6.2.4.1.1. Key market trends, growth factors and opportunities
- 6.2.4.1.2. Market size and forecast, by Component
- 6.2.4.1.3. Market size and forecast, by Type
- 6.2.4.2. Canada
- 6.2.4.2.1. Key market trends, growth factors and opportunities
- 6.2.4.2.2. Market size and forecast, by Component
- 6.2.4.2.3. Market size and forecast, by Type
- 6.2.4.3. Mexico
- 6.2.4.3.1. Key market trends, growth factors and opportunities
- 6.2.4.3.2. Market size and forecast, by Component
- 6.2.4.3.3. Market size and forecast, by Type
- 6.3. Europe
- 6.3.1. Key trends and opportunities
- 6.3.2. Market size and forecast, by Component
- 6.3.3. Market size and forecast, by Type
- 6.3.4. Market size and forecast, by country
- 6.3.4.1. Germany
- 6.3.4.1.1. Key market trends, growth factors and opportunities
- 6.3.4.1.2. Market size and forecast, by Component
- 6.3.4.1.3. Market size and forecast, by Type
- 6.3.4.2. UK
- 6.3.4.2.1. Key market trends, growth factors and opportunities
- 6.3.4.2.2. Market size and forecast, by Component
- 6.3.4.2.3. Market size and forecast, by Type
- 6.3.4.3. France
- 6.3.4.3.1. Key market trends, growth factors and opportunities
- 6.3.4.3.2. Market size and forecast, by Component
- 6.3.4.3.3. Market size and forecast, by Type
- 6.3.4.4. Spain
- 6.3.4.4.1. Key market trends, growth factors and opportunities
- 6.3.4.4.2. Market size and forecast, by Component
- 6.3.4.4.3. Market size and forecast, by Type
- 6.3.4.5. Italy
- 6.3.4.5.1. Key market trends, growth factors and opportunities
- 6.3.4.5.2. Market size and forecast, by Component
- 6.3.4.5.3. Market size and forecast, by Type
- 6.3.4.6. Rest of Europe
- 6.3.4.6.1. Key market trends, growth factors and opportunities
- 6.3.4.6.2. Market size and forecast, by Component
- 6.3.4.6.3. Market size and forecast, by Type
- 6.4. Asia-Pacific
- 6.4.1. Key trends and opportunities
- 6.4.2. Market size and forecast, by Component
- 6.4.3. Market size and forecast, by Type
- 6.4.4. Market size and forecast, by country
- 6.4.4.1. China
- 6.4.4.1.1. Key market trends, growth factors and opportunities
- 6.4.4.1.2. Market size and forecast, by Component
- 6.4.4.1.3. Market size and forecast, by Type
- 6.4.4.2. Japan
- 6.4.4.2.1. Key market trends, growth factors and opportunities
- 6.4.4.2.2. Market size and forecast, by Component
- 6.4.4.2.3. Market size and forecast, by Type
- 6.4.4.3. India
- 6.4.4.3.1. Key market trends, growth factors and opportunities
- 6.4.4.3.2. Market size and forecast, by Component
- 6.4.4.3.3. Market size and forecast, by Type
- 6.4.4.4. South Korea
- 6.4.4.4.1. Key market trends, growth factors and opportunities
- 6.4.4.4.2. Market size and forecast, by Component
- 6.4.4.4.3. Market size and forecast, by Type
- 6.4.4.5. Australia
- 6.4.4.5.1. Key market trends, growth factors and opportunities
- 6.4.4.5.2. Market size and forecast, by Component
- 6.4.4.5.3. Market size and forecast, by Type
- 6.4.4.6. Rest of Asia-Pacific
- 6.4.4.6.1. Key market trends, growth factors and opportunities
- 6.4.4.6.2. Market size and forecast, by Component
- 6.4.4.6.3. Market size and forecast, by Type
- 6.5. LAMEA
- 6.5.1. Key trends and opportunities
- 6.5.2. Market size and forecast, by Component
- 6.5.3. Market size and forecast, by Type
- 6.5.4. Market size and forecast, by country
- 6.5.4.1. Brazil
- 6.5.4.1.1. Key market trends, growth factors and opportunities
- 6.5.4.1.2. Market size and forecast, by Component
- 6.5.4.1.3. Market size and forecast, by Type
- 6.5.4.2. Saudi Arabia
- 6.5.4.2.1. Key market trends, growth factors and opportunities
- 6.5.4.2.2. Market size and forecast, by Component
- 6.5.4.2.3. Market size and forecast, by Type
- 6.5.4.3. UAE
- 6.5.4.3.1. Key market trends, growth factors and opportunities
- 6.5.4.3.2. Market size and forecast, by Component
- 6.5.4.3.3. Market size and forecast, by Type
- 6.5.4.4. South Africa
- 6.5.4.4.1. Key market trends, growth factors and opportunities
- 6.5.4.4.2. Market size and forecast, by Component
- 6.5.4.4.3. Market size and forecast, by Type
- 6.5.4.5. Rest of LAMEA
- 6.5.4.5.1. Key market trends, growth factors and opportunities
- 6.5.4.5.2. Market size and forecast, by Component
- 6.5.4.5.3. Market size and forecast, by Type
CHAPTER 7: COMPETITIVE LANDSCAPE
- 7.1. Introduction
- 7.2. Top winning strategies
- 7.3. Product Mapping of Top 10 Player
- 7.4. Competitive Dashboard
- 7.5. Competitive Heatmap
- 7.6. Top player positioning, 2022
CHAPTER 8: COMPANY PROFILES
- 8.1. Diebold Nixdorf, Incorporated.
- 8.1.1. Company overview
- 8.1.2. Key Executives
- 8.1.3. Company snapshot
- 8.2. ECR Software Corporation
- 8.2.1. Company overview
- 8.2.2. Key Executives
- 8.2.3. Company snapshot
- 8.3. Fujitsu Limited
- 8.3.1. Company overview
- 8.3.2. Key Executives
- 8.3.3. Company snapshot
- 8.4. Gilbarco Inc.
- 8.4.1. Company overview
- 8.4.2. Key Executives
- 8.4.3. Company snapshot
- 8.5. ITAB Group
- 8.5.1. Company overview
- 8.5.2. Key Executives
- 8.5.3. Company snapshot
- 8.6. NCR Corporation
- 8.6.1. Company overview
- 8.6.2. Key Executives
- 8.6.3. Company snapshot
- 8.7. Pan-Oston
- 8.7.1. Company overview
- 8.7.2. Key Executives
- 8.7.3. Company snapshot
- 8.8. PCMS Group Ltd.
- 8.8.1. Company overview
- 8.8.2. Key Executives
- 8.8.3. Company snapshot
- 8.9. Strong Point
- 8.9.1. Company overview
- 8.9.2. Key Executives
- 8.9.3. Company snapshot
- 8.10. Toshiba Corporation.
- 8.10.1. Company overview
- 8.10.2. Key Executives
- 8.10.3. Company snapshot