
|
市場調査レポート
商品コード
1344512
バイオ触媒市場:原料別、タイプ別、最終用途産業別:世界の機会分析と産業予測、2023-2032年Biocatalyst Market By Source, By Type, By End-use Industry: Global Opportunity Analysis and Industry Forecast, 2023-2032 |
||||||
|
|||||||

| バイオ触媒市場:原料別、タイプ別、最終用途産業別:世界の機会分析と産業予測、2023-2032年 |
|
出版日: 2023年06月01日
発行: Allied Market Research
ページ情報: 英文 372 Pages
納期: 2~3営業日
|

- 全表示
- 概要
- 図表
- 目次
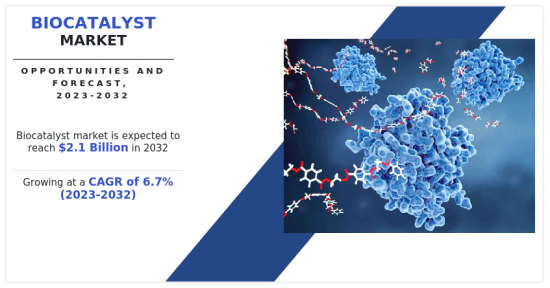
バイオ触媒市場は2022年に11億米ドルと評価され、2023年から2032年にかけてCAGR 6.7%で成長し、2032年には21億米ドルに達すると推定されています。
バイオ触媒市場は、さまざまな産業プロセスにおける生物学的由来の触媒や酵素の生産、流通、利用を包含する分野と定義できます。バイオ触媒は、化学反応を促進し、基質から所望の生成物への変換を促進する天然または改変された酵素です。これらの触媒は、バクテリア、菌類、植物、動物などの生物に由来するか、バイオテクノロジー技術によって設計されます。
バイオ触媒は、従来の化学合成に代わる、より環境に優しい代替手段を提供します。酵素は天然源に由来し、温和な条件下で反応を触媒することができるため、過酷な化学薬品やエネルギー集約的なプロセスの必要性を減らすことができます。これは、製薬業界が持続可能性を重視し、エコロジカル・フットプリントを削減していることと一致します。バイオ触媒は優れた選択性を持ち、医薬品合成において重要な特定のエナンチオマーやレジオアイソマーの生成を可能にします。この選択性は、収率の向上、廃棄物の削減、精製ステップの削減につながります。
化学的変換と酵素的変換を組み合わせた化学酵素的合成は、より効率的で多様な分子合成を可能にします。さらに、バイオ触媒作用は、従来の化学的手法だけでは困難、あるいは不可能でさえあった複雑な分子の合成を可能にします。酵素は、立体特異的あるいは位置選択的な変換など、化学触媒では達成困難な反応を行うことができ、創薬や医薬品開発に新たな可能性をもたらします。
植物由来のバイオ触媒に対する需要の主な原動力のひとつは、持続可能性への世界の関心の高まりと、工業プロセスによる環境への影響の低減です。従来の化学触媒は、再生不可能な資源に依存することが多く、有害な製品別を発生させる可能性があります。対照的に、植物由来のバイオ触媒は再生可能で環境に優しい代替手段を提供します。植物由来の触媒は、豊富に入手でき、持続可能な栽培が可能です。植物由来のバイオ触媒はカーボンフットプリントが低く、温室効果ガスの排出削減に役立つため、より環境に優しい代替品を求める産業にとって非常に魅力的です。
持続可能な製品に対する消費者の意識と需要も、植物由来のバイオ触媒の需要を促進する上で重要な役割を果たしています。消費者は、使用する製品が環境や健康に与える影響をより意識するようになり、植物由来の代替品を積極的に求めるようになっています。植物由来の食品であれ、化粧品であれ、パーソナルケア用品であれ、消費者は持続可能な植物由来の原料を使った製品を選ぶようになっています。このような消費者の要望を受けて、メーカーは消費者の嗜好に合わせ、拡大する市場シェアを獲得するために、生産プロセスにおける植物由来のバイオ触媒の使用を模索しています。
規制当局からの圧力もまた、植物由来のバイオ触媒を採用する大きな原動力となっています。世界中の政府や規制機関は、有害化学物質の使用を最小限に抑え、持続可能な代替物質の使用を促進するため、より厳しい規制を実施しています。植物由来のバイオ触媒は、より安全で環境に優しい選択肢を提供することで、企業はこうした規制を遵守することができ、同時に持続可能性の証明も向上させることができます。
バイオ触媒は、しばしば有害物質を含み有害な廃棄物を発生させる従来の化学触媒に取って代わることで、グリーンケミストリーの推進に重要な役割を果たしています。持続可能で環境に優しいプロセスを重視する傾向が強まっていることは、バイオ触媒市場にとって有利な環境を作り出しています。再生可能エネルギー源へのシフトと持続可能な化学物質へのニーズが、バイオ燃料と再生可能化学物質セクターにおけるバイオ触媒の門戸を開いています。バイオ触媒は、バイオディーゼルやバイオエタノールなどのバイオ燃料の生産を助け、バイオマスから価値ある化学物質への変換を促進することができます。
目次
第1章 イントロダクション
第2章 エグゼクティブサマリー
第3章 市場概要
- 市場の定義と範囲
- 主な調査結果
- 影響要因
- 主な投資機会
- ポーターのファイブフォース分析
- 市場力学
- 促進要因
- 製薬業界からの需要の増加
- バイオ燃料需要の増加
- 抑制要因
- バイオ触媒の用途が限定的
- 機会
- 新興国からの需要の増加
- 促進要因
- COVID-19市場への影響分析
- 価格分析
- バリューチェーン分析
第4章 バイオ触媒市場:原料別
- 概要
- 植物
- 動物
- 微生物
第5章 バイオ触媒市場:タイプ別
- 概要
- 酸化還元酵素
- 転移酵素
- ヒドロラーゼ
- その他
第6章 バイオ触媒市場:最終用途産業別
- 概要
- 医薬品
- 飲食品
- 水処理
- バイオ燃料
- その他
第7章 バイオ触媒市場:地域別
- 概要
- 北米
- 米国
- カナダ
- メキシコ
- 欧州
- ドイツ
- フランス
- 英国
- イタリア
- スペイン
- その他欧州
- アジア太平洋
- 中国
- インド
- 日本
- 韓国
- オーストラリア
- その他アジア太平洋地域
- ラテンアメリカ・中東・アフリカ
- ブラジル
- サウジアラビア
- 南アフリカ
- その他の地域
第8章 競合情勢
- イントロダクション
- 主要成功戦略
- 主要10企業の製品マッピング
- 競合ダッシュボード
- 競合ヒートマップ
- 主要企業のポジショニング、2022年
第9章 企業プロファイル
- DSM
- BASF SE
- Codexis, Inc.
- AB Enzymes
- Amano Enzyme Inc.
- Novozymes
- Biocatalysts
- Lonza
- Prozomix Limited
- DuPont de Nemours, Inc.
LIST OF TABLES
- TABLE 01. GLOBAL BIOCATALYST MARKET, BY SOURCE, 2022-2032 ($MILLION)
- TABLE 02. GLOBAL BIOCATALYST MARKET, BY SOURCE, 2022-2032 (KILOTON)
- TABLE 03. BIOCATALYST MARKET FOR PLANT, BY REGION, 2022-2032 ($MILLION)
- TABLE 04. BIOCATALYST MARKET FOR PLANT, BY REGION, 2022-2032 (KILOTON)
- TABLE 05. BIOCATALYST MARKET FOR ANIMAL, BY REGION, 2022-2032 ($MILLION)
- TABLE 06. BIOCATALYST MARKET FOR ANIMAL, BY REGION, 2022-2032 (KILOTON)
- TABLE 07. BIOCATALYST MARKET FOR MICRO-ORGANISM, BY REGION, 2022-2032 ($MILLION)
- TABLE 08. BIOCATALYST MARKET FOR MICRO-ORGANISM, BY REGION, 2022-2032 (KILOTON)
- TABLE 09. GLOBAL BIOCATALYST MARKET, BY TYPE, 2022-2032 ($MILLION)
- TABLE 10. GLOBAL BIOCATALYST MARKET, BY TYPE, 2022-2032 (KILOTON)
- TABLE 11. BIOCATALYST MARKET FOR OXIDOREDUCTASES, BY REGION, 2022-2032 ($MILLION)
- TABLE 12. BIOCATALYST MARKET FOR OXIDOREDUCTASES, BY REGION, 2022-2032 (KILOTON)
- TABLE 13. BIOCATALYST MARKET FOR TRANSFERASES, BY REGION, 2022-2032 ($MILLION)
- TABLE 14. BIOCATALYST MARKET FOR TRANSFERASES, BY REGION, 2022-2032 (KILOTON)
- TABLE 15. BIOCATALYST MARKET FOR HYDROLASES, BY REGION, 2022-2032 ($MILLION)
- TABLE 16. BIOCATALYST MARKET FOR HYDROLASES, BY REGION, 2022-2032 (KILOTON)
- TABLE 17. BIOCATALYST MARKET FOR OTHERS, BY REGION, 2022-2032 ($MILLION)
- TABLE 18. BIOCATALYST MARKET FOR OTHERS, BY REGION, 2022-2032 (KILOTON)
- TABLE 19. GLOBAL BIOCATALYST MARKET, BY END-USE INDUSTRY, 2022-2032 ($MILLION)
- TABLE 20. GLOBAL BIOCATALYST MARKET, BY END-USE INDUSTRY, 2022-2032 (KILOTON)
- TABLE 21. BIOCATALYST MARKET FOR PHARMACEUTICAL, BY REGION, 2022-2032 ($MILLION)
- TABLE 22. BIOCATALYST MARKET FOR PHARMACEUTICAL, BY REGION, 2022-2032 (KILOTON)
- TABLE 23. BIOCATALYST MARKET FOR FOOD AND BEVERAGE, BY REGION, 2022-2032 ($MILLION)
- TABLE 24. BIOCATALYST MARKET FOR FOOD AND BEVERAGE, BY REGION, 2022-2032 (KILOTON)
- TABLE 25. BIOCATALYST MARKET FOR WATER TREATMENT, BY REGION, 2022-2032 ($MILLION)
- TABLE 26. BIOCATALYST MARKET FOR WATER TREATMENT, BY REGION, 2022-2032 (KILOTON)
- TABLE 27. BIOCATALYST MARKET FOR BIOFUEL, BY REGION, 2022-2032 ($MILLION)
- TABLE 28. BIOCATALYST MARKET FOR BIOFUEL, BY REGION, 2022-2032 (KILOTON)
- TABLE 29. BIOCATALYST MARKET FOR OTHERS, BY REGION, 2022-2032 ($MILLION)
- TABLE 30. BIOCATALYST MARKET FOR OTHERS, BY REGION, 2022-2032 (KILOTON)
- TABLE 31. BIOCATALYST MARKET, BY REGION, 2022-2032 ($MILLION)
- TABLE 32. BIOCATALYST MARKET, BY REGION, 2022-2032 (KILOTON)
- TABLE 33. NORTH AMERICA BIOCATALYST MARKET, BY SOURCE, 2022-2032 ($MILLION)
- TABLE 34. NORTH AMERICA BIOCATALYST MARKET, BY SOURCE, 2022-2032 (KILOTON)
- TABLE 35. NORTH AMERICA BIOCATALYST MARKET, BY TYPE, 2022-2032 ($MILLION)
- TABLE 36. NORTH AMERICA BIOCATALYST MARKET, BY TYPE, 2022-2032 (KILOTON)
- TABLE 37. NORTH AMERICA BIOCATALYST MARKET, BY END-USE INDUSTRY, 2022-2032 ($MILLION)
- TABLE 38. NORTH AMERICA BIOCATALYST MARKET, BY END-USE INDUSTRY, 2022-2032 (KILOTON)
- TABLE 39. NORTH AMERICA BIOCATALYST MARKET, BY COUNTRY, 2022-2032 ($MILLION)
- TABLE 40. NORTH AMERICA BIOCATALYST MARKET, BY COUNTRY, 2022-2032 (KILOTON)
- TABLE 41. U.S. BIOCATALYST MARKET, BY SOURCE, 2022-2032 ($MILLION)
- TABLE 42. U.S. BIOCATALYST MARKET, BY SOURCE, 2022-2032 (KILOTON)
- TABLE 43. U.S. BIOCATALYST MARKET, BY TYPE, 2022-2032 ($MILLION)
- TABLE 44. U.S. BIOCATALYST MARKET, BY TYPE, 2022-2032 (KILOTON)
- TABLE 45. U.S. BIOCATALYST MARKET, BY END-USE INDUSTRY, 2022-2032 ($MILLION)
- TABLE 46. U.S. BIOCATALYST MARKET, BY END-USE INDUSTRY, 2022-2032 (KILOTON)
- TABLE 47. CANADA BIOCATALYST MARKET, BY SOURCE, 2022-2032 ($MILLION)
- TABLE 48. CANADA BIOCATALYST MARKET, BY SOURCE, 2022-2032 (KILOTON)
- TABLE 49. CANADA BIOCATALYST MARKET, BY TYPE, 2022-2032 ($MILLION)
- TABLE 50. CANADA BIOCATALYST MARKET, BY TYPE, 2022-2032 (KILOTON)
- TABLE 51. CANADA BIOCATALYST MARKET, BY END-USE INDUSTRY, 2022-2032 ($MILLION)
- TABLE 52. CANADA BIOCATALYST MARKET, BY END-USE INDUSTRY, 2022-2032 (KILOTON)
- TABLE 53. MEXICO BIOCATALYST MARKET, BY SOURCE, 2022-2032 ($MILLION)
- TABLE 54. MEXICO BIOCATALYST MARKET, BY SOURCE, 2022-2032 (KILOTON)
- TABLE 55. MEXICO BIOCATALYST MARKET, BY TYPE, 2022-2032 ($MILLION)
- TABLE 56. MEXICO BIOCATALYST MARKET, BY TYPE, 2022-2032 (KILOTON)
- TABLE 57. MEXICO BIOCATALYST MARKET, BY END-USE INDUSTRY, 2022-2032 ($MILLION)
- TABLE 58. MEXICO BIOCATALYST MARKET, BY END-USE INDUSTRY, 2022-2032 (KILOTON)
- TABLE 59. EUROPE BIOCATALYST MARKET, BY SOURCE, 2022-2032 ($MILLION)
- TABLE 60. EUROPE BIOCATALYST MARKET, BY SOURCE, 2022-2032 (KILOTON)
- TABLE 61. EUROPE BIOCATALYST MARKET, BY TYPE, 2022-2032 ($MILLION)
- TABLE 62. EUROPE BIOCATALYST MARKET, BY TYPE, 2022-2032 (KILOTON)
- TABLE 63. EUROPE BIOCATALYST MARKET, BY END-USE INDUSTRY, 2022-2032 ($MILLION)
- TABLE 64. EUROPE BIOCATALYST MARKET, BY END-USE INDUSTRY, 2022-2032 (KILOTON)
- TABLE 65. EUROPE BIOCATALYST MARKET, BY COUNTRY, 2022-2032 ($MILLION)
- TABLE 66. EUROPE BIOCATALYST MARKET, BY COUNTRY, 2022-2032 (KILOTON)
- TABLE 67. GERMANY BIOCATALYST MARKET, BY SOURCE, 2022-2032 ($MILLION)
- TABLE 68. GERMANY BIOCATALYST MARKET, BY SOURCE, 2022-2032 (KILOTON)
- TABLE 69. GERMANY BIOCATALYST MARKET, BY TYPE, 2022-2032 ($MILLION)
- TABLE 70. GERMANY BIOCATALYST MARKET, BY TYPE, 2022-2032 (KILOTON)
- TABLE 71. GERMANY BIOCATALYST MARKET, BY END-USE INDUSTRY, 2022-2032 ($MILLION)
- TABLE 72. GERMANY BIOCATALYST MARKET, BY END-USE INDUSTRY, 2022-2032 (KILOTON)
- TABLE 73. FRANCE BIOCATALYST MARKET, BY SOURCE, 2022-2032 ($MILLION)
- TABLE 74. FRANCE BIOCATALYST MARKET, BY SOURCE, 2022-2032 (KILOTON)
- TABLE 75. FRANCE BIOCATALYST MARKET, BY TYPE, 2022-2032 ($MILLION)
- TABLE 76. FRANCE BIOCATALYST MARKET, BY TYPE, 2022-2032 (KILOTON)
- TABLE 77. FRANCE BIOCATALYST MARKET, BY END-USE INDUSTRY, 2022-2032 ($MILLION)
- TABLE 78. FRANCE BIOCATALYST MARKET, BY END-USE INDUSTRY, 2022-2032 (KILOTON)
- TABLE 79. UK BIOCATALYST MARKET, BY SOURCE, 2022-2032 ($MILLION)
- TABLE 80. UK BIOCATALYST MARKET, BY SOURCE, 2022-2032 (KILOTON)
- TABLE 81. UK BIOCATALYST MARKET, BY TYPE, 2022-2032 ($MILLION)
- TABLE 82. UK BIOCATALYST MARKET, BY TYPE, 2022-2032 (KILOTON)
- TABLE 83. UK BIOCATALYST MARKET, BY END-USE INDUSTRY, 2022-2032 ($MILLION)
- TABLE 84. UK BIOCATALYST MARKET, BY END-USE INDUSTRY, 2022-2032 (KILOTON)
- TABLE 85. ITALY BIOCATALYST MARKET, BY SOURCE, 2022-2032 ($MILLION)
- TABLE 86. ITALY BIOCATALYST MARKET, BY SOURCE, 2022-2032 (KILOTON)
- TABLE 87. ITALY BIOCATALYST MARKET, BY TYPE, 2022-2032 ($MILLION)
- TABLE 88. ITALY BIOCATALYST MARKET, BY TYPE, 2022-2032 (KILOTON)
- TABLE 89. ITALY BIOCATALYST MARKET, BY END-USE INDUSTRY, 2022-2032 ($MILLION)
- TABLE 90. ITALY BIOCATALYST MARKET, BY END-USE INDUSTRY, 2022-2032 (KILOTON)
- TABLE 91. SPAIN BIOCATALYST MARKET, BY SOURCE, 2022-2032 ($MILLION)
- TABLE 92. SPAIN BIOCATALYST MARKET, BY SOURCE, 2022-2032 (KILOTON)
- TABLE 93. SPAIN BIOCATALYST MARKET, BY TYPE, 2022-2032 ($MILLION)
- TABLE 94. SPAIN BIOCATALYST MARKET, BY TYPE, 2022-2032 (KILOTON)
- TABLE 95. SPAIN BIOCATALYST MARKET, BY END-USE INDUSTRY, 2022-2032 ($MILLION)
- TABLE 96. SPAIN BIOCATALYST MARKET, BY END-USE INDUSTRY, 2022-2032 (KILOTON)
- TABLE 97. REST OF EUROPE BIOCATALYST MARKET, BY SOURCE, 2022-2032 ($MILLION)
- TABLE 98. REST OF EUROPE BIOCATALYST MARKET, BY SOURCE, 2022-2032 (KILOTON)
- TABLE 99. REST OF EUROPE BIOCATALYST MARKET, BY TYPE, 2022-2032 ($MILLION)
- TABLE 100. REST OF EUROPE BIOCATALYST MARKET, BY TYPE, 2022-2032 (KILOTON)
- TABLE 101. REST OF EUROPE BIOCATALYST MARKET, BY END-USE INDUSTRY, 2022-2032 ($MILLION)
- TABLE 102. REST OF EUROPE BIOCATALYST MARKET, BY END-USE INDUSTRY, 2022-2032 (KILOTON)
- TABLE 103. ASIA-PACIFIC BIOCATALYST MARKET, BY SOURCE, 2022-2032 ($MILLION)
- TABLE 104. ASIA-PACIFIC BIOCATALYST MARKET, BY SOURCE, 2022-2032 (KILOTON)
- TABLE 105. ASIA-PACIFIC BIOCATALYST MARKET, BY TYPE, 2022-2032 ($MILLION)
- TABLE 106. ASIA-PACIFIC BIOCATALYST MARKET, BY TYPE, 2022-2032 (KILOTON)
- TABLE 107. ASIA-PACIFIC BIOCATALYST MARKET, BY END-USE INDUSTRY, 2022-2032 ($MILLION)
- TABLE 108. ASIA-PACIFIC BIOCATALYST MARKET, BY END-USE INDUSTRY, 2022-2032 (KILOTON)
- TABLE 109. ASIA-PACIFIC BIOCATALYST MARKET, BY COUNTRY, 2022-2032 ($MILLION)
- TABLE 110. ASIA-PACIFIC BIOCATALYST MARKET, BY COUNTRY, 2022-2032 (KILOTON)
- TABLE 111. CHINA BIOCATALYST MARKET, BY SOURCE, 2022-2032 ($MILLION)
- TABLE 112. CHINA BIOCATALYST MARKET, BY SOURCE, 2022-2032 (KILOTON)
- TABLE 113. CHINA BIOCATALYST MARKET, BY TYPE, 2022-2032 ($MILLION)
- TABLE 114. CHINA BIOCATALYST MARKET, BY TYPE, 2022-2032 (KILOTON)
- TABLE 115. CHINA BIOCATALYST MARKET, BY END-USE INDUSTRY, 2022-2032 ($MILLION)
- TABLE 116. CHINA BIOCATALYST MARKET, BY END-USE INDUSTRY, 2022-2032 (KILOTON)
- TABLE 117. INDIA BIOCATALYST MARKET, BY SOURCE, 2022-2032 ($MILLION)
- TABLE 118. INDIA BIOCATALYST MARKET, BY SOURCE, 2022-2032 (KILOTON)
- TABLE 119. INDIA BIOCATALYST MARKET, BY TYPE, 2022-2032 ($MILLION)
- TABLE 120. INDIA BIOCATALYST MARKET, BY TYPE, 2022-2032 (KILOTON)
- TABLE 121. INDIA BIOCATALYST MARKET, BY END-USE INDUSTRY, 2022-2032 ($MILLION)
- TABLE 122. INDIA BIOCATALYST MARKET, BY END-USE INDUSTRY, 2022-2032 (KILOTON)
- TABLE 123. JAPAN BIOCATALYST MARKET, BY SOURCE, 2022-2032 ($MILLION)
- TABLE 124. JAPAN BIOCATALYST MARKET, BY SOURCE, 2022-2032 (KILOTON)
- TABLE 125. JAPAN BIOCATALYST MARKET, BY TYPE, 2022-2032 ($MILLION)
- TABLE 126. JAPAN BIOCATALYST MARKET, BY TYPE, 2022-2032 (KILOTON)
- TABLE 127. JAPAN BIOCATALYST MARKET, BY END-USE INDUSTRY, 2022-2032 ($MILLION)
- TABLE 128. JAPAN BIOCATALYST MARKET, BY END-USE INDUSTRY, 2022-2032 (KILOTON)
- TABLE 129. SOUTH KOREA BIOCATALYST MARKET, BY SOURCE, 2022-2032 ($MILLION)
- TABLE 130. SOUTH KOREA BIOCATALYST MARKET, BY SOURCE, 2022-2032 (KILOTON)
- TABLE 131. SOUTH KOREA BIOCATALYST MARKET, BY TYPE, 2022-2032 ($MILLION)
- TABLE 132. SOUTH KOREA BIOCATALYST MARKET, BY TYPE, 2022-2032 (KILOTON)
- TABLE 133. SOUTH KOREA BIOCATALYST MARKET, BY END-USE INDUSTRY, 2022-2032 ($MILLION)
- TABLE 134. SOUTH KOREA BIOCATALYST MARKET, BY END-USE INDUSTRY, 2022-2032 (KILOTON)
- TABLE 135. AUSTRALIA BIOCATALYST MARKET, BY SOURCE, 2022-2032 ($MILLION)
- TABLE 136. AUSTRALIA BIOCATALYST MARKET, BY SOURCE, 2022-2032 (KILOTON)
- TABLE 137. AUSTRALIA BIOCATALYST MARKET, BY TYPE, 2022-2032 ($MILLION)
- TABLE 138. AUSTRALIA BIOCATALYST MARKET, BY TYPE, 2022-2032 (KILOTON)
- TABLE 139. AUSTRALIA BIOCATALYST MARKET, BY END-USE INDUSTRY, 2022-2032 ($MILLION)
- TABLE 140. AUSTRALIA BIOCATALYST MARKET, BY END-USE INDUSTRY, 2022-2032 (KILOTON)
- TABLE 141. REST OF ASIA-PACIFIC BIOCATALYST MARKET, BY SOURCE, 2022-2032 ($MILLION)
- TABLE 142. REST OF ASIA-PACIFIC BIOCATALYST MARKET, BY SOURCE, 2022-2032 (KILOTON)
- TABLE 143. REST OF ASIA-PACIFIC BIOCATALYST MARKET, BY TYPE, 2022-2032 ($MILLION)
- TABLE 144. REST OF ASIA-PACIFIC BIOCATALYST MARKET, BY TYPE, 2022-2032 (KILOTON)
- TABLE 145. REST OF ASIA-PACIFIC BIOCATALYST MARKET, BY END-USE INDUSTRY, 2022-2032 ($MILLION)
- TABLE 146. REST OF ASIA-PACIFIC BIOCATALYST MARKET, BY END-USE INDUSTRY, 2022-2032 (KILOTON)
- TABLE 147. LAMEA BIOCATALYST MARKET, BY SOURCE, 2022-2032 ($MILLION)
- TABLE 148. LAMEA BIOCATALYST MARKET, BY SOURCE, 2022-2032 (KILOTON)
- TABLE 149. LAMEA BIOCATALYST MARKET, BY TYPE, 2022-2032 ($MILLION)
- TABLE 150. LAMEA BIOCATALYST MARKET, BY TYPE, 2022-2032 (KILOTON)
- TABLE 151. LAMEA BIOCATALYST MARKET, BY END-USE INDUSTRY, 2022-2032 ($MILLION)
- TABLE 152. LAMEA BIOCATALYST MARKET, BY END-USE INDUSTRY, 2022-2032 (KILOTON)
- TABLE 153. LAMEA BIOCATALYST MARKET, BY COUNTRY, 2022-2032 ($MILLION)
- TABLE 154. LAMEA BIOCATALYST MARKET, BY COUNTRY, 2022-2032 (KILOTON)
- TABLE 155. BRAZIL BIOCATALYST MARKET, BY SOURCE, 2022-2032 ($MILLION)
- TABLE 156. BRAZIL BIOCATALYST MARKET, BY SOURCE, 2022-2032 (KILOTON)
- TABLE 157. BRAZIL BIOCATALYST MARKET, BY TYPE, 2022-2032 ($MILLION)
- TABLE 158. BRAZIL BIOCATALYST MARKET, BY TYPE, 2022-2032 (KILOTON)
- TABLE 159. BRAZIL BIOCATALYST MARKET, BY END-USE INDUSTRY, 2022-2032 ($MILLION)
- TABLE 160. BRAZIL BIOCATALYST MARKET, BY END-USE INDUSTRY, 2022-2032 (KILOTON)
- TABLE 161. SAUDI ARABIA BIOCATALYST MARKET, BY SOURCE, 2022-2032 ($MILLION)
- TABLE 162. SAUDI ARABIA BIOCATALYST MARKET, BY SOURCE, 2022-2032 (KILOTON)
- TABLE 163. SAUDI ARABIA BIOCATALYST MARKET, BY TYPE, 2022-2032 ($MILLION)
- TABLE 164. SAUDI ARABIA BIOCATALYST MARKET, BY TYPE, 2022-2032 (KILOTON)
- TABLE 165. SAUDI ARABIA BIOCATALYST MARKET, BY END-USE INDUSTRY, 2022-2032 ($MILLION)
- TABLE 166. SAUDI ARABIA BIOCATALYST MARKET, BY END-USE INDUSTRY, 2022-2032 (KILOTON)
- TABLE 167. SOUTH AFRICA BIOCATALYST MARKET, BY SOURCE, 2022-2032 ($MILLION)
- TABLE 168. SOUTH AFRICA BIOCATALYST MARKET, BY SOURCE, 2022-2032 (KILOTON)
- TABLE 169. SOUTH AFRICA BIOCATALYST MARKET, BY TYPE, 2022-2032 ($MILLION)
- TABLE 170. SOUTH AFRICA BIOCATALYST MARKET, BY TYPE, 2022-2032 (KILOTON)
- TABLE 171. SOUTH AFRICA BIOCATALYST MARKET, BY END-USE INDUSTRY, 2022-2032 ($MILLION)
- TABLE 172. SOUTH AFRICA BIOCATALYST MARKET, BY END-USE INDUSTRY, 2022-2032 (KILOTON)
- TABLE 173. REST OF LAMEA BIOCATALYST MARKET, BY SOURCE, 2022-2032 ($MILLION)
- TABLE 174. REST OF LAMEA BIOCATALYST MARKET, BY SOURCE, 2022-2032 (KILOTON)
- TABLE 175. REST OF LAMEA BIOCATALYST MARKET, BY TYPE, 2022-2032 ($MILLION)
- TABLE 176. REST OF LAMEA BIOCATALYST MARKET, BY TYPE, 2022-2032 (KILOTON)
- TABLE 177. REST OF LAMEA BIOCATALYST MARKET, BY END-USE INDUSTRY, 2022-2032 ($MILLION)
- TABLE 178. REST OF LAMEA BIOCATALYST MARKET, BY END-USE INDUSTRY, 2022-2032 (KILOTON)
- TABLE 179. DSM: KEY EXECUTIVES
- TABLE 180. DSM: COMPANY SNAPSHOT
- TABLE 181. DSM: PRODUCT SEGMENTS
- TABLE 182. DSM: PRODUCT PORTFOLIO
- TABLE 183. BASF SE: KEY EXECUTIVES
- TABLE 184. BASF SE: COMPANY SNAPSHOT
- TABLE 185. BASF SE: PRODUCT SEGMENTS
- TABLE 186. BASF SE: PRODUCT PORTFOLIO
- TABLE 187. CODEXIS, INC.: KEY EXECUTIVES
- TABLE 188. CODEXIS, INC.: COMPANY SNAPSHOT
- TABLE 189. CODEXIS, INC.: PRODUCT SEGMENTS
- TABLE 190. CODEXIS, INC.: PRODUCT PORTFOLIO
- TABLE 191. AB ENZYMES: KEY EXECUTIVES
- TABLE 192. AB ENZYMES: COMPANY SNAPSHOT
- TABLE 193. AB ENZYMES: PRODUCT SEGMENTS
- TABLE 194. AB ENZYMES: PRODUCT PORTFOLIO
- TABLE 195. AMANO ENZYME INC.: KEY EXECUTIVES
- TABLE 196. AMANO ENZYME INC.: COMPANY SNAPSHOT
- TABLE 197. AMANO ENZYME INC.: PRODUCT SEGMENTS
- TABLE 198. AMANO ENZYME INC.: PRODUCT PORTFOLIO
- TABLE 199. NOVOZYMES: KEY EXECUTIVES
- TABLE 200. NOVOZYMES: COMPANY SNAPSHOT
- TABLE 201. NOVOZYMES: PRODUCT SEGMENTS
- TABLE 202. NOVOZYMES: PRODUCT PORTFOLIO
- TABLE 203. BIOCATALYSTS: KEY EXECUTIVES
- TABLE 204. BIOCATALYSTS: COMPANY SNAPSHOT
- TABLE 205. BIOCATALYSTS: PRODUCT SEGMENTS
- TABLE 206. BIOCATALYSTS: PRODUCT PORTFOLIO
- TABLE 207. LONZA: KEY EXECUTIVES
- TABLE 208. LONZA: COMPANY SNAPSHOT
- TABLE 209. LONZA: PRODUCT SEGMENTS
- TABLE 210. LONZA: SERVICE SEGMENTS
- TABLE 211. LONZA: PRODUCT PORTFOLIO
- TABLE 212. PROZOMIX LIMITED: KEY EXECUTIVES
- TABLE 213. PROZOMIX LIMITED: COMPANY SNAPSHOT
- TABLE 214. PROZOMIX LIMITED: PRODUCT SEGMENTS
- TABLE 215. PROZOMIX LIMITED: PRODUCT PORTFOLIO
- TABLE 216. DUPONT DE NEMOURS, INC.: KEY EXECUTIVES
- TABLE 217. DUPONT DE NEMOURS, INC.: COMPANY SNAPSHOT
- TABLE 218. DUPONT DE NEMOURS, INC.: PRODUCT SEGMENTS
- TABLE 219. DUPONT DE NEMOURS, INC.: PRODUCT PORTFOLIO
LIST OF FIGURES
- FIGURE 01. BIOCATALYST MARKET, 2022-2032
- FIGURE 02. SEGMENTATION OF BIOCATALYST MARKET, 2022-2032
- FIGURE 03. TOP INVESTMENT POCKETS IN BIOCATALYST MARKET (2023-2032)
- FIGURE 04. LOW BARGAINING POWER OF SUPPLIERS
- FIGURE 05. LOW THREAT OF NEW ENTRANTS
- FIGURE 06. LOW THREAT OF SUBSTITUTES
- FIGURE 07. LOW INTENSITY OF RIVALRY
- FIGURE 08. LOW BARGAINING POWER OF BUYERS
- FIGURE 09. DRIVERS, RESTRAINTS AND OPPORTUNITIES: GLOBALBIOCATALYST MARKET
- FIGURE 10. PRICING ANALYSIS: BIOCATALYST MARKET 2022 AND 2032
- FIGURE 10. BIOCATALYST MARKET, BY SOURCE, 2022(%)
- FIGURE 11. COMPARATIVE SHARE ANALYSIS OF BIOCATALYST MARKET FOR PLANT, BY COUNTRY 2022 AND 2032(%)
- FIGURE 12. COMPARATIVE SHARE ANALYSIS OF BIOCATALYST MARKET FOR ANIMAL, BY COUNTRY 2022 AND 2032(%)
- FIGURE 13. COMPARATIVE SHARE ANALYSIS OF BIOCATALYST MARKET FOR MICRO-ORGANISM, BY COUNTRY 2022 AND 2032(%)
- FIGURE 14. BIOCATALYST MARKET, BY TYPE, 2022(%)
- FIGURE 15. COMPARATIVE SHARE ANALYSIS OF BIOCATALYST MARKET FOR OXIDOREDUCTASES, BY COUNTRY 2022 AND 2032(%)
- FIGURE 16. COMPARATIVE SHARE ANALYSIS OF BIOCATALYST MARKET FOR TRANSFERASES, BY COUNTRY 2022 AND 2032(%)
- FIGURE 17. COMPARATIVE SHARE ANALYSIS OF BIOCATALYST MARKET FOR HYDROLASES, BY COUNTRY 2022 AND 2032(%)
- FIGURE 18. COMPARATIVE SHARE ANALYSIS OF BIOCATALYST MARKET FOR OTHERS, BY COUNTRY 2022 AND 2032(%)
- FIGURE 19. BIOCATALYST MARKET, BY END-USE INDUSTRY, 2022(%)
- FIGURE 20. COMPARATIVE SHARE ANALYSIS OF BIOCATALYST MARKET FOR PHARMACEUTICAL, BY COUNTRY 2022 AND 2032(%)
- FIGURE 21. COMPARATIVE SHARE ANALYSIS OF BIOCATALYST MARKET FOR FOOD AND BEVERAGE, BY COUNTRY 2022 AND 2032(%)
- FIGURE 22. COMPARATIVE SHARE ANALYSIS OF BIOCATALYST MARKET FOR WATER TREATMENT, BY COUNTRY 2022 AND 2032(%)
- FIGURE 23. COMPARATIVE SHARE ANALYSIS OF BIOCATALYST MARKET FOR BIOFUEL, BY COUNTRY 2022 AND 2032(%)
- FIGURE 24. COMPARATIVE SHARE ANALYSIS OF BIOCATALYST MARKET FOR OTHERS, BY COUNTRY 2022 AND 2032(%)
- FIGURE 25. BIOCATALYST MARKET BY REGION, 2022
- FIGURE 26. U.S. BIOCATALYST MARKET, 2022-2032 ($MILLION)
- FIGURE 27. CANADA BIOCATALYST MARKET, 2022-2032 ($MILLION)
- FIGURE 28. MEXICO BIOCATALYST MARKET, 2022-2032 ($MILLION)
- FIGURE 29. GERMANY BIOCATALYST MARKET, 2022-2032 ($MILLION)
- FIGURE 30. FRANCE BIOCATALYST MARKET, 2022-2032 ($MILLION)
- FIGURE 31. UK BIOCATALYST MARKET, 2022-2032 ($MILLION)
- FIGURE 32. ITALY BIOCATALYST MARKET, 2022-2032 ($MILLION)
- FIGURE 33. SPAIN BIOCATALYST MARKET, 2022-2032 ($MILLION)
- FIGURE 34. REST OF EUROPE BIOCATALYST MARKET, 2022-2032 ($MILLION)
- FIGURE 35. CHINA BIOCATALYST MARKET, 2022-2032 ($MILLION)
- FIGURE 36. INDIA BIOCATALYST MARKET, 2022-2032 ($MILLION)
- FIGURE 37. JAPAN BIOCATALYST MARKET, 2022-2032 ($MILLION)
- FIGURE 38. SOUTH KOREA BIOCATALYST MARKET, 2022-2032 ($MILLION)
- FIGURE 39. AUSTRALIA BIOCATALYST MARKET, 2022-2032 ($MILLION)
- FIGURE 40. REST OF ASIA-PACIFIC BIOCATALYST MARKET, 2022-2032 ($MILLION)
- FIGURE 41. BRAZIL BIOCATALYST MARKET, 2022-2032 ($MILLION)
- FIGURE 42. SAUDI ARABIA BIOCATALYST MARKET, 2022-2032 ($MILLION)
- FIGURE 43. SOUTH AFRICA BIOCATALYST MARKET, 2022-2032 ($MILLION)
- FIGURE 44. REST OF LAMEA BIOCATALYST MARKET, 2022-2032 ($MILLION)
- FIGURE 45. TOP WINNING STRATEGIES, BY YEAR
- FIGURE 46. TOP WINNING STRATEGIES, BY DEVELOPMENT
- FIGURE 47. TOP WINNING STRATEGIES, BY COMPANY
- FIGURE 48. PRODUCT MAPPING OF TOP 10 PLAYERS
- FIGURE 49. COMPETITIVE DASHBOARD
- FIGURE 50. COMPETITIVE HEATMAP: BIOCATALYST MARKET
- FIGURE 51. TOP PLAYER POSITIONING, 2022
- FIGURE 52. DSM: NET REVENUE, 2020-2022 ($MILLION)
- FIGURE 53. DSM: REVENUE SHARE BY SEGMENT, 2022 (%)
- FIGURE 54. BASF SE: NET SALES, 2020-2022 ($MILLION)
- FIGURE 55. BASF SE: RESEARCH & DEVELOPMENT EXPENDITURE, 2020-2022 ($MILLION)
- FIGURE 56. BASF SE: REVENUE SHARE BY SEGMENT, 2022 (%)
- FIGURE 57. BASF SE: REVENUE SHARE BY REGION, 2022 (%)
- FIGURE 58. CODEXIS, INC.: NET REVENUE, 2020-2022 ($MILLION)
- FIGURE 59. CODEXIS, INC.: REVENUE SHARE BY SEGMENT, 2022 (%)
- FIGURE 60. CODEXIS, INC.: REVENUE SHARE BY REGION, 2022 (%)
- FIGURE 61. NOVOZYMES: NET REVENUE, 2020-2022 ($MILLION)
- FIGURE 62. NOVOZYMES: REVENUE SHARE BY SEGMENT, 2022 (%)
- FIGURE 63. LONZA: NET SALES, 2020-2022 ($MILLION)
- FIGURE 64. LONZA: REVENUE SHARE BY SEGMENT, 2022 (%)
- FIGURE 65. LONZA: REVENUE SHARE BY REGION, 2022 (%)
- FIGURE 66. DUPONT DE NEMOURS, INC.: RESEARCH & DEVELOPMENT EXPENDITURE, 2019-2021
- FIGURE 67. DUPONT DE NEMOURS, INC.: NET REVENUE, 2019-2021 ($MILLION)
- FIGURE 68. DUPONT DE NEMOURS, INC.: REVENUE SHARE BY SEGMENT, 2021 (%)
- FIGURE 69. DUPONT DE NEMOURS, INC.: REVENUE SHARE BY REGION, 2021 (%)
According to a new report published by Allied Market Research, titled, "Biocatalyst Market," The biocatalyst market was valued at $1.1 billion in 2022, and is estimated to reach $2.1 billion by 2032, growing at a CAGR of 6.7% from 2023 to 2032.
The biocatalyst market can be defined as the sector that encompasses the production, distribution, and utilization of biologically derived catalysts or enzymes for various industrial processes. Biocatalysts are natural or modified enzymes that accelerate chemical reactions and facilitate the conversion of substrates into desired products. These catalysts are derived from living organisms such as bacteria, fungi, plants, and animals, or can be engineered through biotechnology techniques.
Biocatalysis provides a more environmentally friendly alternative to traditional chemical synthesis. Enzymes are derived from natural sources and can catalyze reactions under mild conditions, reducing the need for harsh chemicals and energy-intensive processes. This aligns with the pharmaceutical industry's growing emphasis on sustainability and reducing its ecological footprint. Biocatalysts offer exquisite selectivity, enabling the production of specific enantiomers or regioisomers, which is crucial in pharmaceutical synthesis. This selectivity can lead to improved yields, reduced waste, and fewer purification steps.
Chemoenzymatic synthesis, combining chemical and enzymatic transformations, allows for more efficient and diverse molecule synthesis. In addition, biocatalysis enables the synthesis of complex molecules that are challenging or even impossible to produce using traditional chemical methods alone. Enzymes can perform reactions that are difficult to achieve with chemical catalysts, such as stereospecific or regioselective transformations, opening new possibilities for drug discovery and development.
One of the key drivers of the demand for plant-based biocatalysts is the increasing global focus on sustainability and reducing the environmental impact of industrial processes. Conventional chemical catalysts often rely on non-renewable resources and can generate harmful byproducts. In contrast, plant-based biocatalysts offer a renewable and eco-friendly alternative. They are derived from plant sources, which are abundantly available and can be grown sustainably. Plant-based biocatalysts have lower carbon footprints and can help reduce greenhouse gas emissions, making them highly attractive to industries seeking greener alternatives.
Consumer awareness and demand for sustainable products have also played a crucial role in driving the demand for plant-based biocatalysts. As consumers become more conscious of the environmental and health impacts of the products they use, they are actively seeking out plant-based alternatives. Whether it's plant-based foods, cosmetics, or personal care items, consumers are increasingly opting for products made using sustainable and plant-derived ingredients. This consumer demand has prompted manufacturers to explore the use of plant-based biocatalysts in their production processes to align with consumer preferences and capture a growing market share.
Regulatory pressures have been another significant driver for the adoption of plant-based biocatalysts. Governments and regulatory bodies around the world are implementing stricter regulations to minimize the use of hazardous chemicals and promote the use of sustainable alternatives. Plant-based biocatalysts offer a safer and more environmentally friendly option, enabling companies to comply with these regulations while also improving their sustainability credentials.
Biocatalysts play a crucial role in promoting green chemistry practices by replacing traditional chemical catalysts, which often involve hazardous substances and generate harmful waste. The increasing emphasis on sustainable and environmentally friendly processes creates a favorable environment for the biocatalyst market. The shift towards renewable energy sources and the need for sustainable chemicals have opened doors for biocatalysts in the biofuels and renewable chemicals sector. Biocatalysts can aid in the production of biofuels such as biodiesel and bioethanol and facilitate the conversion of biomass into valuable chemicals.
The biocatalyst market is segmented into source, type, end-use industry, and region. On the basis of source, it is categorized into plant, animal, and microorganism. By type, the market is classified into oxidoreductases, transferases, hydrolases, and others. End-use industry covered in the report are pharmaceutical, food & beverage, water treatment, biofuel, and others. Region-wise, the market is studied across North America, Europe, Asia-Pacific, and LAMEA.
The major players operating in the global biocatalyst market include Novozymes, DuPont, DSM, Codexis, BASF SE, Lonza, Amano Enzyme Inc., Dyadic International Inc., Biocatalysts Limited and Piramal Pharma Solutions. Other players include AB Enzymes, Prozomix Limited, Chr Hansen Holding A/S and evoxx technologies GmbH.
Key Benefits For Stakeholders
- This report provides a quantitative analysis of the market segments, current trends, estimations, and dynamics of the biocatalyst market analysis from 2022 to 2032 to identify the prevailing biocatalyst market opportunities.
- The market research is offered along with information related to key drivers, restraints, and opportunities.
- Porter's five forces analysis highlights the potency of buyers and suppliers to enable stakeholders make profit-oriented business decisions and strengthen their supplier-buyer network.
- In-depth analysis of the biocatalyst market segmentation assists to determine the prevailing market opportunities.
- Major countries in each region are mapped according to their revenue contribution to the global market.
- Market player positioning facilitates benchmarking and provides a clear understanding of the present position of the market players.
- The report includes the analysis of the regional as well as global biocatalyst market trends, key players, market segments, application areas, and market growth strategies.
Key Market Segments
By Source
- Plant
- Animal
- Micro-organism
By Type
- Oxidoreductases
- Transferases
- Hydrolases
- Others
By End-use industry
- Pharmaceutical
- Food and beverage
- Water Treatment
- Biofuel
- Others
By Region
- North America
- U.S.
- Canada
- Mexico
- Europe
- Germany
- France
- UK
- Italy
- Spain
- Rest of Europe
- Asia-Pacific
- China
- India
- Japan
- South Korea
- Australia
- Rest of Asia-Pacific
- LAMEA
- Brazil
- Saudi Arabia
- South Africa
- Rest of LAMEA
Key Market Players:
- AB Enzymes
- Amano Enzyme Inc.
- BASF SE
- Biocatalysts
- Codexis, Inc.
- DSM
- DuPont de Nemours, Inc.
- Lonza
- Novozymes
- Prozomix Limited
TABLE OF CONTENTS
CHAPTER 1: INTRODUCTION
- 1.1. Report description
- 1.2. Key market segments
- 1.3. Key benefits to the stakeholders
- 1.4. Research Methodology
- 1.4.1. Primary research
- 1.4.2. Secondary research
- 1.4.3. Analyst tools and models
CHAPTER 2: EXECUTIVE SUMMARY
- 2.1. CXO Perspective
CHAPTER 3: MARKET OVERVIEW
- 3.1. Market definition and scope
- 3.2. Key findings
- 3.2.1. Top impacting factors
- 3.2.2. Top investment pockets
- 3.3. Porter's five forces analysis
- 3.3.1. Low bargaining power of suppliers
- 3.3.2. Low threat of new entrants
- 3.3.3. Low threat of substitutes
- 3.3.4. Low intensity of rivalry
- 3.3.5. Low bargaining power of buyers
- 3.4. Market dynamics
- 3.4.1. Drivers
- 3.4.1.1. Increased demand from the pharmaceutical industry
- 3.4.1.2. Increased demand for biofuels
- 3.4.1. Drivers
- 3.4.2. Restraints
- 3.4.2.1. Limited application of biocatalyst
- 3.4.3. Opportunities
- 3.4.3.1. Increase in demand from emerging countries
- 3.5. COVID-19 Impact Analysis on the market
- 3.6. Pricing Analysis
- 3.7. Value Chain Analysis
CHAPTER 4: BIOCATALYST MARKET, BY SOURCE
- 4.1. Overview
- 4.1.1. Market size and forecast
- 4.2. Plant
- 4.2.1. Key market trends, growth factors and opportunities
- 4.2.2. Market size and forecast, by region
- 4.2.3. Market share analysis by country
- 4.3. Animal
- 4.3.1. Key market trends, growth factors and opportunities
- 4.3.2. Market size and forecast, by region
- 4.3.3. Market share analysis by country
- 4.4. Micro-organism
- 4.4.1. Key market trends, growth factors and opportunities
- 4.4.2. Market size and forecast, by region
- 4.4.3. Market share analysis by country
CHAPTER 5: BIOCATALYST MARKET, BY TYPE
- 5.1. Overview
- 5.1.1. Market size and forecast
- 5.2. Oxidoreductases
- 5.2.1. Key market trends, growth factors and opportunities
- 5.2.2. Market size and forecast, by region
- 5.2.3. Market share analysis by country
- 5.3. Transferases
- 5.3.1. Key market trends, growth factors and opportunities
- 5.3.2. Market size and forecast, by region
- 5.3.3. Market share analysis by country
- 5.4. Hydrolases
- 5.4.1. Key market trends, growth factors and opportunities
- 5.4.2. Market size and forecast, by region
- 5.4.3. Market share analysis by country
- 5.5. Others
- 5.5.1. Key market trends, growth factors and opportunities
- 5.5.2. Market size and forecast, by region
- 5.5.3. Market share analysis by country
CHAPTER 6: BIOCATALYST MARKET, BY END-USE INDUSTRY
- 6.1. Overview
- 6.1.1. Market size and forecast
- 6.2. Pharmaceutical
- 6.2.1. Key market trends, growth factors and opportunities
- 6.2.2. Market size and forecast, by region
- 6.2.3. Market share analysis by country
- 6.3. Food and beverage
- 6.3.1. Key market trends, growth factors and opportunities
- 6.3.2. Market size and forecast, by region
- 6.3.3. Market share analysis by country
- 6.4. Water Treatment
- 6.4.1. Key market trends, growth factors and opportunities
- 6.4.2. Market size and forecast, by region
- 6.4.3. Market share analysis by country
- 6.5. Biofuel
- 6.5.1. Key market trends, growth factors and opportunities
- 6.5.2. Market size and forecast, by region
- 6.5.3. Market share analysis by country
- 6.6. Others
- 6.6.1. Key market trends, growth factors and opportunities
- 6.6.2. Market size and forecast, by region
- 6.6.3. Market share analysis by country
CHAPTER 7: BIOCATALYST MARKET, BY REGION
- 7.1. Overview
- 7.1.1. Market size and forecast By Region
- 7.2. North America
- 7.2.1. Key trends and opportunities
- 7.2.2. Market size and forecast, by Source
- 7.2.3. Market size and forecast, by Type
- 7.2.4. Market size and forecast, by End-use industry
- 7.2.5. Market size and forecast, by country
- 7.2.5.1. U.S.
- 7.2.5.1.1. Key market trends, growth factors and opportunities
- 7.2.5.1.2. Market size and forecast, by Source
- 7.2.5.1.3. Market size and forecast, by Type
- 7.2.5.1.4. Market size and forecast, by End-use industry
- 7.2.5.2. Canada
- 7.2.5.2.1. Key market trends, growth factors and opportunities
- 7.2.5.2.2. Market size and forecast, by Source
- 7.2.5.2.3. Market size and forecast, by Type
- 7.2.5.2.4. Market size and forecast, by End-use industry
- 7.2.5.3. Mexico
- 7.2.5.3.1. Key market trends, growth factors and opportunities
- 7.2.5.3.2. Market size and forecast, by Source
- 7.2.5.3.3. Market size and forecast, by Type
- 7.2.5.3.4. Market size and forecast, by End-use industry
- 7.3. Europe
- 7.3.1. Key trends and opportunities
- 7.3.2. Market size and forecast, by Source
- 7.3.3. Market size and forecast, by Type
- 7.3.4. Market size and forecast, by End-use industry
- 7.3.5. Market size and forecast, by country
- 7.3.5.1. Germany
- 7.3.5.1.1. Key market trends, growth factors and opportunities
- 7.3.5.1.2. Market size and forecast, by Source
- 7.3.5.1.3. Market size and forecast, by Type
- 7.3.5.1.4. Market size and forecast, by End-use industry
- 7.3.5.2. France
- 7.3.5.2.1. Key market trends, growth factors and opportunities
- 7.3.5.2.2. Market size and forecast, by Source
- 7.3.5.2.3. Market size and forecast, by Type
- 7.3.5.2.4. Market size and forecast, by End-use industry
- 7.3.5.3. UK
- 7.3.5.3.1. Key market trends, growth factors and opportunities
- 7.3.5.3.2. Market size and forecast, by Source
- 7.3.5.3.3. Market size and forecast, by Type
- 7.3.5.3.4. Market size and forecast, by End-use industry
- 7.3.5.4. Italy
- 7.3.5.4.1. Key market trends, growth factors and opportunities
- 7.3.5.4.2. Market size and forecast, by Source
- 7.3.5.4.3. Market size and forecast, by Type
- 7.3.5.4.4. Market size and forecast, by End-use industry
- 7.3.5.5. Spain
- 7.3.5.5.1. Key market trends, growth factors and opportunities
- 7.3.5.5.2. Market size and forecast, by Source
- 7.3.5.5.3. Market size and forecast, by Type
- 7.3.5.5.4. Market size and forecast, by End-use industry
- 7.3.5.6. Rest of Europe
- 7.3.5.6.1. Key market trends, growth factors and opportunities
- 7.3.5.6.2. Market size and forecast, by Source
- 7.3.5.6.3. Market size and forecast, by Type
- 7.3.5.6.4. Market size and forecast, by End-use industry
- 7.4. Asia-Pacific
- 7.4.1. Key trends and opportunities
- 7.4.2. Market size and forecast, by Source
- 7.4.3. Market size and forecast, by Type
- 7.4.4. Market size and forecast, by End-use industry
- 7.4.5. Market size and forecast, by country
- 7.4.5.1. China
- 7.4.5.1.1. Key market trends, growth factors and opportunities
- 7.4.5.1.2. Market size and forecast, by Source
- 7.4.5.1.3. Market size and forecast, by Type
- 7.4.5.1.4. Market size and forecast, by End-use industry
- 7.4.5.2. India
- 7.4.5.2.1. Key market trends, growth factors and opportunities
- 7.4.5.2.2. Market size and forecast, by Source
- 7.4.5.2.3. Market size and forecast, by Type
- 7.4.5.2.4. Market size and forecast, by End-use industry
- 7.4.5.3. Japan
- 7.4.5.3.1. Key market trends, growth factors and opportunities
- 7.4.5.3.2. Market size and forecast, by Source
- 7.4.5.3.3. Market size and forecast, by Type
- 7.4.5.3.4. Market size and forecast, by End-use industry
- 7.4.5.4. South Korea
- 7.4.5.4.1. Key market trends, growth factors and opportunities
- 7.4.5.4.2. Market size and forecast, by Source
- 7.4.5.4.3. Market size and forecast, by Type
- 7.4.5.4.4. Market size and forecast, by End-use industry
- 7.4.5.5. Australia
- 7.4.5.5.1. Key market trends, growth factors and opportunities
- 7.4.5.5.2. Market size and forecast, by Source
- 7.4.5.5.3. Market size and forecast, by Type
- 7.4.5.5.4. Market size and forecast, by End-use industry
- 7.4.5.6. Rest of Asia-Pacific
- 7.4.5.6.1. Key market trends, growth factors and opportunities
- 7.4.5.6.2. Market size and forecast, by Source
- 7.4.5.6.3. Market size and forecast, by Type
- 7.4.5.6.4. Market size and forecast, by End-use industry
- 7.5. LAMEA
- 7.5.1. Key trends and opportunities
- 7.5.2. Market size and forecast, by Source
- 7.5.3. Market size and forecast, by Type
- 7.5.4. Market size and forecast, by End-use industry
- 7.5.5. Market size and forecast, by country
- 7.5.5.1. Brazil
- 7.5.5.1.1. Key market trends, growth factors and opportunities
- 7.5.5.1.2. Market size and forecast, by Source
- 7.5.5.1.3. Market size and forecast, by Type
- 7.5.5.1.4. Market size and forecast, by End-use industry
- 7.5.5.2. Saudi Arabia
- 7.5.5.2.1. Key market trends, growth factors and opportunities
- 7.5.5.2.2. Market size and forecast, by Source
- 7.5.5.2.3. Market size and forecast, by Type
- 7.5.5.2.4. Market size and forecast, by End-use industry
- 7.5.5.3. South Africa
- 7.5.5.3.1. Key market trends, growth factors and opportunities
- 7.5.5.3.2. Market size and forecast, by Source
- 7.5.5.3.3. Market size and forecast, by Type
- 7.5.5.3.4. Market size and forecast, by End-use industry
- 7.5.5.4. Rest of LAMEA
- 7.5.5.4.1. Key market trends, growth factors and opportunities
- 7.5.5.4.2. Market size and forecast, by Source
- 7.5.5.4.3. Market size and forecast, by Type
- 7.5.5.4.4. Market size and forecast, by End-use industry
CHAPTER 8: COMPETITIVE LANDSCAPE
- 8.1. Introduction
- 8.2. Top winning strategies
- 8.3. Product Mapping of Top 10 Player
- 8.4. Competitive Dashboard
- 8.5. Competitive Heatmap
- 8.6. Top player positioning, 2022
CHAPTER 9: COMPANY PROFILES
- 9.1. DSM
- 9.1.1. Company overview
- 9.1.2. Key Executives
- 9.1.3. Company snapshot
- 9.1.4. Operating business segments
- 9.1.5. Product portfolio
- 9.1.6. Business performance
- 9.2. BASF SE
- 9.2.1. Company overview
- 9.2.2. Key Executives
- 9.2.3. Company snapshot
- 9.2.4. Operating business segments
- 9.2.5. Product portfolio
- 9.2.6. Business performance
- 9.3. Codexis, Inc.
- 9.3.1. Company overview
- 9.3.2. Key Executives
- 9.3.3. Company snapshot
- 9.3.4. Operating business segments
- 9.3.5. Product portfolio
- 9.3.6. Business performance
- 9.4. AB Enzymes
- 9.4.1. Company overview
- 9.4.2. Key Executives
- 9.4.3. Company snapshot
- 9.4.4. Operating business segments
- 9.4.5. Product portfolio
- 9.5. Amano Enzyme Inc.
- 9.5.1. Company overview
- 9.5.2. Key Executives
- 9.5.3. Company snapshot
- 9.5.4. Operating business segments
- 9.5.5. Product portfolio
- 9.6. Novozymes
- 9.6.1. Company overview
- 9.6.2. Key Executives
- 9.6.3. Company snapshot
- 9.6.4. Operating business segments
- 9.6.5. Product portfolio
- 9.6.6. Business performance
- 9.7. Biocatalysts
- 9.7.1. Company overview
- 9.7.2. Key Executives
- 9.7.3. Company snapshot
- 9.7.4. Operating business segments
- 9.7.5. Product portfolio
- 9.8. Lonza
- 9.8.1. Company overview
- 9.8.2. Key Executives
- 9.8.3. Company snapshot
- 9.8.4. Operating business segments
- 9.8.5. Product portfolio
- 9.8.6. Business performance
- 9.9. Prozomix Limited
- 9.9.1. Company overview
- 9.9.2. Key Executives
- 9.9.3. Company snapshot
- 9.9.4. Operating business segments
- 9.9.5. Product portfolio
- 9.10. DuPont de Nemours, Inc.
- 9.10.1. Company overview
- 9.10.2. Key Executives
- 9.10.3. Company snapshot
- 9.10.4. Operating business segments
- 9.10.5. Product portfolio
- 9.10.6. Business performance