|
|
市場調査レポート
商品コード
1344510
カーボンクレジット市場:タイプ別、システム別、最終用途産業別:世界の機会分析と産業予測、2023-2032年Carbon Credits Market By Type (Regulatory, Voluntary), By System (Cap-and-Trade, Baseline-and-Credit), By End-use Industry (Aviation, Energy, Industrial, Petrochemical, Others): Global Opportunity Analysis and Industry Forecast, 2023-2032 |
||||||
|
|
|||||||
|
|||||||


| カーボンクレジット市場:タイプ別、システム別、最終用途産業別:世界の機会分析と産業予測、2023-2032年 |
|
出版日: 2023年06月01日
発行: Allied Market Research
ページ情報: 英文 280 Pages
納期: 2~3営業日
|

- 全表示
- 概要
- 図表
- 目次
カーボンクレジット市場は2022年に20億米ドルと評価され、2023年から2032年にかけて55.5%のCAGRで成長し、2032年には1,435億米ドルに達すると推定されています。
カーボンクレジットは炭素市場で売買できます。企業、政府、個人などの買い手は、自らの排出量を相殺し、持続可能性の目標を達成するためにカーボンクレジットを購入します。カーボン・クレジットは売り手から買い手に譲渡されるが、多くの場合、専門のプラットフォームや取引所を通じて行われます。カーボンクレジットは、企業が温室効果ガスの排出を最小限に抑えるのに役立ちます。
温室効果ガスの排出を削減し、ネット・ゼロ・カーボン・ニュートラルを達成するために様々な国が行っているいくつかの取り組みが、カーボンクレジット市場の需要を牽引しています。この市場では、カーボンクレジットの所有権を追跡し、二重計上を防ぐために、各カーボンクレジットに固有の識別番号が割り当てられています。洪水、干ばつ、氷河の融解、地震などの環境問題の高まりに対処するためには、温室効果ガスの排出を削減する必要があります。カーボンクレジットは炭素排出を抑制するのに役立つが、やむを得ない排出もあります。そのような場合、カーボンクレジットは、環境に排出される二酸化炭素の量のバランスをとるために、炭素排出を補償または中和するために利用されます。また、カーボンクレジットは、資産の回転やビジネスモデルの開発を通じて、将来の排出量を削減する機会を企業に与えるだけでなく、現在の排出量を相殺するオプションでもあります。多くの民間企業は、企業の社会的責任(CSR)活動の一環として、自主的にカーボンクレジット市場に参加しています。カーボンクレジットは通常、林業や農業の実践を通じて生成されます。
しかし、カーボンクレジットのコストは地域や国によって異なります。例えば、ブラジルの場合、1クレジットのコストは約411.36米ドル(2000レアル)です。このように、カーボンクレジットのコスト上昇により、市場は課題に直面する可能性があります。また、カーボン・クレジットは、企業や個人による実際の炭素排出削減量を表すものではないです。というのも、カーボンクレジットの信頼性と完全性を維持するには、適切な報告や監視が必要だが、現時点ではそれが行われていないからです。これらの要因は、今後数年間の市場収益の伸びを妨げると予測されます。
気候変動と闘うための数カ国にまたがる集団的行動と協力は、今後数年間のカーボンクレジット市場の成長を後押しすると予想されます。例えば、2023年2月、インドは環境持続可能性の達成に役立つ投資と活動リストを発表しました。例えば、これらの活動の下で、インド政府は国際市場におけるパリ協定第6条に基づくカーボンクレジットの取引を検討しています。インドがカーボンクレジットへの投資を誘致する分野の希望リストには、グリーン水素、火力発電、洋上風力、圧縮バイオガスなどの再生可能エネルギー発電、炭素回収・貯留、その他の炭素除去・緩和活動が含まれています。また、2023年6月8日には、世界銀行の保険部門である多国間投資保証機関(MIGA)が、カーボンクレジット・プロジェクトに保険を提供する予定です。これはまた、カーボンクレジットの取引を規制するのにも役立つと思われます。こうした側面が、予測期間中のカーボンクレジット市場規模を押し上げると予想されます。
COVID-19パンデミックはカーボンクレジット市場に大きな影響を与えています。パンデミックの結果、炭素排出削減に役立つ数多くのプロジェクトが中止されました。渡航制限、サプライチェーンの途絶、財政的な制約などにより、プロジェクトは遅延または中止されました。その結果、新たなカーボンクレジットの創出にも影響が及び、市場性が低下しました。カーボンクレジットの需要は、パンデミックがもたらした景気後退の影響を受けた。財政難や収益の減少を経験している企業は、自主的なカーボン・オフセットの取り組みを減らしたかもしれないです。さらに、一部の企業は長期的な持続可能性の目標よりも短期的な財務的存続を優先したため、一部の業界ではカーボン・クレジットの需要が減少しました。
目次
第1章 イントロダクション
第2章 エグゼクティブサマリー
第3章 市場概要
- 市場の定義と範囲
- 主な調査結果
- 影響要因
- 主な投資機会
- ポーターのファイブフォース分析
- 市場力学
- 促進要因
- 抑制要因
- 機会
- COVID-19市場への影響分析
- ブランドシェア分析
- 主要規制分析
- 市場シェア分析
- 特許情勢
- 規制ガイドライン
- バリューチェーン分析
第4章 カーボンクレジット市場:タイプ別
- 概要
- 規制
- 自主規制
第5章 カーボンクレジット市場:システム別
- 概要
- キャップ・アンド・トレード
- ベースライン・アンド・クレジット
第6章 カーボンクレジット市場:最終用途産業別
- 概要
- 航空
- エネルギー
- 産業
- 石油化学
- その他
第7章 カーボンクレジット市場:地域別
- 概要
- 北米
- 米国
- カナダ
- メキシコ
- 欧州
- ドイツ
- 英国
- フランス
- トルコ
- ロシア
- その他
- アジア太平洋
- 中国
- 日本
- インド
- 韓国
- オーストラリア
- その他
- ラテンアメリカ・中東・アフリカ
- ブラジル
- UAE
- サウジアラビア
- 南アフリカ
- その他
第8章 競合情勢
- イントロダクション
- 主要成功戦略
- 主要10企業の製品マッピング
- 競合ダッシュボード
- 競合ヒートマップ
- 主要企業のポジショニング、2022年
第9章 企業プロファイル
- South Pole
- 3Degrees
- EKI Energy Services Ltd.
- TerraPass
- NATUREOFFICE
- Moss.Earth
- Climate Impact Partners
- Carbon Credit Capital, LLC.
- CarbonBetter
- NativeEnergy
LIST OF TABLES
- TABLE 01. GLOBAL CARBON CREDITS MARKET, BY TYPE, 2022-2032 ($MILLION)
- TABLE 02. CARBON CREDITS MARKET FOR REGULATORY, BY REGION, 2022-2032 ($MILLION)
- TABLE 03. CARBON CREDITS MARKET FOR VOLUNTARY, BY REGION, 2022-2032 ($MILLION)
- TABLE 04. GLOBAL CARBON CREDITS MARKET, BY SYSTEM, 2022-2032 ($MILLION)
- TABLE 05. CARBON CREDITS MARKET FOR CAP-AND-TRADE, BY REGION, 2022-2032 ($MILLION)
- TABLE 06. CARBON CREDITS MARKET FOR BASELINE-AND-CREDIT, BY REGION, 2022-2032 ($MILLION)
- TABLE 07. GLOBAL CARBON CREDITS MARKET, BY END-USE INDUSTRY, 2022-2032 ($MILLION)
- TABLE 08. CARBON CREDITS MARKET FOR AVIATION, BY REGION, 2022-2032 ($MILLION)
- TABLE 09. CARBON CREDITS MARKET FOR ENERGY, BY REGION, 2022-2032 ($MILLION)
- TABLE 10. CARBON CREDITS MARKET FOR INDUSTRIAL, BY REGION, 2022-2032 ($MILLION)
- TABLE 11. CARBON CREDITS MARKET FOR PETROCHEMICAL, BY REGION, 2022-2032 ($MILLION)
- TABLE 12. CARBON CREDITS MARKET FOR OTHERS, BY REGION, 2022-2032 ($MILLION)
- TABLE 13. CARBON CREDITS MARKET, BY REGION, 2022-2032 ($MILLION)
- TABLE 14. NORTH AMERICA CARBON CREDITS MARKET, BY TYPE, 2022-2032 ($MILLION)
- TABLE 15. NORTH AMERICA CARBON CREDITS MARKET, BY SYSTEM, 2022-2032 ($MILLION)
- TABLE 16. NORTH AMERICA CARBON CREDITS MARKET, BY END-USE INDUSTRY, 2022-2032 ($MILLION)
- TABLE 17. NORTH AMERICA CARBON CREDITS MARKET, BY COUNTRY, 2022-2032 ($MILLION)
- TABLE 18. U.S. CARBON CREDITS MARKET, BY TYPE, 2022-2032 ($MILLION)
- TABLE 19. U.S. CARBON CREDITS MARKET, BY SYSTEM, 2022-2032 ($MILLION)
- TABLE 20. U.S. CARBON CREDITS MARKET, BY END-USE INDUSTRY, 2022-2032 ($MILLION)
- TABLE 21. CANADA CARBON CREDITS MARKET, BY TYPE, 2022-2032 ($MILLION)
- TABLE 22. CANADA CARBON CREDITS MARKET, BY SYSTEM, 2022-2032 ($MILLION)
- TABLE 23. CANADA CARBON CREDITS MARKET, BY END-USE INDUSTRY, 2022-2032 ($MILLION)
- TABLE 24. MEXICO CARBON CREDITS MARKET, BY TYPE, 2022-2032 ($MILLION)
- TABLE 25. MEXICO CARBON CREDITS MARKET, BY SYSTEM, 2022-2032 ($MILLION)
- TABLE 26. MEXICO CARBON CREDITS MARKET, BY END-USE INDUSTRY, 2022-2032 ($MILLION)
- TABLE 27. EUROPE CARBON CREDITS MARKET, BY TYPE, 2022-2032 ($MILLION)
- TABLE 28. EUROPE CARBON CREDITS MARKET, BY SYSTEM, 2022-2032 ($MILLION)
- TABLE 29. EUROPE CARBON CREDITS MARKET, BY END-USE INDUSTRY, 2022-2032 ($MILLION)
- TABLE 30. EUROPE CARBON CREDITS MARKET, BY COUNTRY, 2022-2032 ($MILLION)
- TABLE 31. GERMANY CARBON CREDITS MARKET, BY TYPE, 2022-2032 ($MILLION)
- TABLE 32. GERMANY CARBON CREDITS MARKET, BY SYSTEM, 2022-2032 ($MILLION)
- TABLE 33. GERMANY CARBON CREDITS MARKET, BY END-USE INDUSTRY, 2022-2032 ($MILLION)
- TABLE 34. UK CARBON CREDITS MARKET, BY TYPE, 2022-2032 ($MILLION)
- TABLE 35. UK CARBON CREDITS MARKET, BY SYSTEM, 2022-2032 ($MILLION)
- TABLE 36. UK CARBON CREDITS MARKET, BY END-USE INDUSTRY, 2022-2032 ($MILLION)
- TABLE 37. FRANCE CARBON CREDITS MARKET, BY TYPE, 2022-2032 ($MILLION)
- TABLE 38. FRANCE CARBON CREDITS MARKET, BY SYSTEM, 2022-2032 ($MILLION)
- TABLE 39. FRANCE CARBON CREDITS MARKET, BY END-USE INDUSTRY, 2022-2032 ($MILLION)
- TABLE 40. TURKEY CARBON CREDITS MARKET, BY TYPE, 2022-2032 ($MILLION)
- TABLE 41. TURKEY CARBON CREDITS MARKET, BY SYSTEM, 2022-2032 ($MILLION)
- TABLE 42. TURKEY CARBON CREDITS MARKET, BY END-USE INDUSTRY, 2022-2032 ($MILLION)
- TABLE 43. RUSSIA CARBON CREDITS MARKET, BY TYPE, 2022-2032 ($MILLION)
- TABLE 44. RUSSIA CARBON CREDITS MARKET, BY SYSTEM, 2022-2032 ($MILLION)
- TABLE 45. RUSSIA CARBON CREDITS MARKET, BY END-USE INDUSTRY, 2022-2032 ($MILLION)
- TABLE 46. REST OF EUROPE CARBON CREDITS MARKET, BY TYPE, 2022-2032 ($MILLION)
- TABLE 47. REST OF EUROPE CARBON CREDITS MARKET, BY SYSTEM, 2022-2032 ($MILLION)
- TABLE 48. REST OF EUROPE CARBON CREDITS MARKET, BY END-USE INDUSTRY, 2022-2032 ($MILLION)
- TABLE 49. ASIA-PACIFIC CARBON CREDITS MARKET, BY TYPE, 2022-2032 ($MILLION)
- TABLE 50. ASIA-PACIFIC CARBON CREDITS MARKET, BY SYSTEM, 2022-2032 ($MILLION)
- TABLE 51. ASIA-PACIFIC CARBON CREDITS MARKET, BY END-USE INDUSTRY, 2022-2032 ($MILLION)
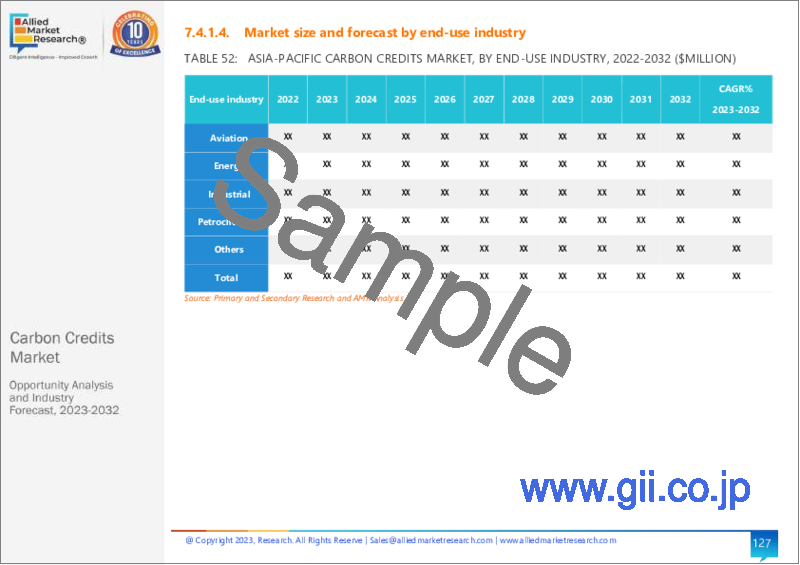
- TABLE 52. ASIA-PACIFIC CARBON CREDITS MARKET, BY COUNTRY, 2022-2032 ($MILLION)
- TABLE 53. CHINA CARBON CREDITS MARKET, BY TYPE, 2022-2032 ($MILLION)
- TABLE 54. CHINA CARBON CREDITS MARKET, BY SYSTEM, 2022-2032 ($MILLION)
- TABLE 55. CHINA CARBON CREDITS MARKET, BY END-USE INDUSTRY, 2022-2032 ($MILLION)
- TABLE 56. JAPAN CARBON CREDITS MARKET, BY TYPE, 2022-2032 ($MILLION)
- TABLE 57. JAPAN CARBON CREDITS MARKET, BY SYSTEM, 2022-2032 ($MILLION)
- TABLE 58. JAPAN CARBON CREDITS MARKET, BY END-USE INDUSTRY, 2022-2032 ($MILLION)
- TABLE 59. INDIA CARBON CREDITS MARKET, BY TYPE, 2022-2032 ($MILLION)
- TABLE 60. INDIA CARBON CREDITS MARKET, BY SYSTEM, 2022-2032 ($MILLION)
- TABLE 61. INDIA CARBON CREDITS MARKET, BY END-USE INDUSTRY, 2022-2032 ($MILLION)
- TABLE 62. SOUTH KOREA CARBON CREDITS MARKET, BY TYPE, 2022-2032 ($MILLION)
- TABLE 63. SOUTH KOREA CARBON CREDITS MARKET, BY SYSTEM, 2022-2032 ($MILLION)
- TABLE 64. SOUTH KOREA CARBON CREDITS MARKET, BY END-USE INDUSTRY, 2022-2032 ($MILLION)
- TABLE 65. AUSTRALIA CARBON CREDITS MARKET, BY TYPE, 2022-2032 ($MILLION)
- TABLE 66. AUSTRALIA CARBON CREDITS MARKET, BY SYSTEM, 2022-2032 ($MILLION)
- TABLE 67. AUSTRALIA CARBON CREDITS MARKET, BY END-USE INDUSTRY, 2022-2032 ($MILLION)
- TABLE 68. REST OF ASIA-PACIFIC CARBON CREDITS MARKET, BY TYPE, 2022-2032 ($MILLION)
- TABLE 69. REST OF ASIA-PACIFIC CARBON CREDITS MARKET, BY SYSTEM, 2022-2032 ($MILLION)
- TABLE 70. REST OF ASIA-PACIFIC CARBON CREDITS MARKET, BY END-USE INDUSTRY, 2022-2032 ($MILLION)
- TABLE 71. LAMEA CARBON CREDITS MARKET, BY TYPE, 2022-2032 ($MILLION)
- TABLE 72. LAMEA CARBON CREDITS MARKET, BY SYSTEM, 2022-2032 ($MILLION)
- TABLE 73. LAMEA CARBON CREDITS MARKET, BY END-USE INDUSTRY, 2022-2032 ($MILLION)
- TABLE 74. LAMEA CARBON CREDITS MARKET, BY COUNTRY, 2022-2032 ($MILLION)
- TABLE 75. BRAZIL CARBON CREDITS MARKET, BY TYPE, 2022-2032 ($MILLION)
- TABLE 76. BRAZIL CARBON CREDITS MARKET, BY SYSTEM, 2022-2032 ($MILLION)
- TABLE 77. BRAZIL CARBON CREDITS MARKET, BY END-USE INDUSTRY, 2022-2032 ($MILLION)
- TABLE 78. UAE CARBON CREDITS MARKET, BY TYPE, 2022-2032 ($MILLION)
- TABLE 79. UAE CARBON CREDITS MARKET, BY SYSTEM, 2022-2032 ($MILLION)
- TABLE 80. UAE CARBON CREDITS MARKET, BY END-USE INDUSTRY, 2022-2032 ($MILLION)
- TABLE 81. SAUDI ARABIA CARBON CREDITS MARKET, BY TYPE, 2022-2032 ($MILLION)
- TABLE 82. SAUDI ARABIA CARBON CREDITS MARKET, BY SYSTEM, 2022-2032 ($MILLION)
- TABLE 83. SAUDI ARABIA CARBON CREDITS MARKET, BY END-USE INDUSTRY, 2022-2032 ($MILLION)
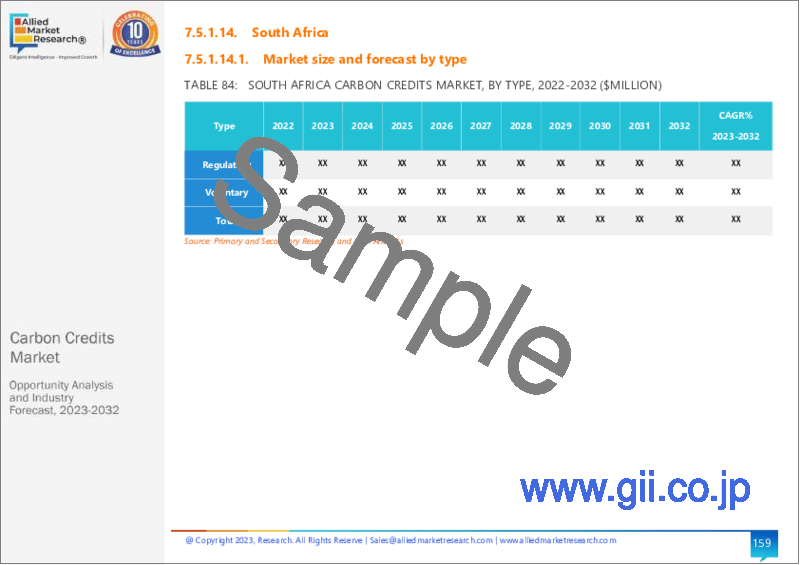
- TABLE 84. SOUTH AFRICA CARBON CREDITS MARKET, BY TYPE, 2022-2032 ($MILLION)
- TABLE 85. SOUTH AFRICA CARBON CREDITS MARKET, BY SYSTEM, 2022-2032 ($MILLION)
- TABLE 86. SOUTH AFRICA CARBON CREDITS MARKET, BY END-USE INDUSTRY, 2022-2032 ($MILLION)
- TABLE 87. REST OF LAMEA CARBON CREDITS MARKET, BY TYPE, 2022-2032 ($MILLION)
- TABLE 88. REST OF LAMEA CARBON CREDITS MARKET, BY SYSTEM, 2022-2032 ($MILLION)
- TABLE 89. REST OF LAMEA CARBON CREDITS MARKET, BY END-USE INDUSTRY, 2022-2032 ($MILLION)
- TABLE 90. SOUTH POLE : KEY EXECUTIVES
- TABLE 91. SOUTH POLE : COMPANY SNAPSHOT
- TABLE 92. 3DEGREES : KEY EXECUTIVES
- TABLE 93. 3DEGREES : COMPANY SNAPSHOT
- TABLE 94. EKI ENERGY SERVICES LTD.: KEY EXECUTIVES
- TABLE 95. EKI ENERGY SERVICES LTD.: COMPANY SNAPSHOT
- TABLE 96. TERRAPASS : KEY EXECUTIVES
- TABLE 97. TERRAPASS : COMPANY SNAPSHOT
- TABLE 98. NATUREOFFICE: KEY EXECUTIVES
- TABLE 99. NATUREOFFICE: COMPANY SNAPSHOT
- TABLE 100. MOSS.EARTH: KEY EXECUTIVES
- TABLE 101. MOSS.EARTH: COMPANY SNAPSHOT
- TABLE 102. CLIMATE IMPACT PARTNERS: KEY EXECUTIVES
- TABLE 103. CLIMATE IMPACT PARTNERS: COMPANY SNAPSHOT
- TABLE 104. CARBON CREDIT CAPITAL, LLC.: KEY EXECUTIVES
- TABLE 105. CARBON CREDIT CAPITAL, LLC.: COMPANY SNAPSHOT
- TABLE 106. CARBONBETTER : KEY EXECUTIVES
- TABLE 107. CARBONBETTER : COMPANY SNAPSHOT
- TABLE 108. NATIVEENERGY: KEY EXECUTIVES
- TABLE 109. NATIVEENERGY: COMPANY SNAPSHOT
LIST OF FIGURES
- FIGURE 01. CARBON CREDITS MARKET, 2022-2032
- FIGURE 02. SEGMENTATION OF CARBON CREDITS MARKET, 2022-2032
- FIGURE 03. TOP INVESTMENT POCKETS IN CARBON CREDITS MARKET (2023-2032)
- FIGURE 04. PORTER FIVE-1
- FIGURE 05. PORTER FIVE-2
- FIGURE 06. PORTER FIVE-3
- FIGURE 07. PORTER FIVE-4
- FIGURE 08. PORTER FIVE-5
- FIGURE 09. DRIVERS, RESTRAINTS AND OPPORTUNITIES: GLOBALCARBON CREDITS MARKET
- FIGURE 10. IMPACT OF KEY REGULATION: CARBON CREDITS MARKET
- FIGURE 11. MARKET SHARE ANALYSIS: CARBON CREDITS MARKET
- FIGURE 12. PATENT ANALYSIS BY COMPANY
- FIGURE 13. PATENT ANALYSIS BY COUNTRY
- FIGURE 14. REGULATORY GUIDELINES: CARBON CREDITS MARKET
- FIGURE 15. VALUE CHAIN ANALYSIS: CARBON CREDITS MARKET
- FIGURE 16. CARBON CREDITS MARKET, BY TYPE, 2022(%)
- FIGURE 17. COMPARATIVE SHARE ANALYSIS OF CARBON CREDITS MARKET FOR REGULATORY, BY COUNTRY 2022 AND 2032(%)
- FIGURE 18. COMPARATIVE SHARE ANALYSIS OF CARBON CREDITS MARKET FOR VOLUNTARY, BY COUNTRY 2022 AND 2032(%)
- FIGURE 19. CARBON CREDITS MARKET, BY SYSTEM, 2022(%)
- FIGURE 20. COMPARATIVE SHARE ANALYSIS OF CARBON CREDITS MARKET FOR CAP-AND-TRADE, BY COUNTRY 2022 AND 2032(%)
- FIGURE 21. COMPARATIVE SHARE ANALYSIS OF CARBON CREDITS MARKET FOR BASELINE-AND-CREDIT, BY COUNTRY 2022 AND 2032(%)
- FIGURE 22. CARBON CREDITS MARKET, BY END-USE INDUSTRY, 2022(%)
- FIGURE 23. COMPARATIVE SHARE ANALYSIS OF CARBON CREDITS MARKET FOR AVIATION, BY COUNTRY 2022 AND 2032(%)
- FIGURE 24. COMPARATIVE SHARE ANALYSIS OF CARBON CREDITS MARKET FOR ENERGY, BY COUNTRY 2022 AND 2032(%)
- FIGURE 25. COMPARATIVE SHARE ANALYSIS OF CARBON CREDITS MARKET FOR INDUSTRIAL, BY COUNTRY 2022 AND 2032(%)
- FIGURE 26. COMPARATIVE SHARE ANALYSIS OF CARBON CREDITS MARKET FOR PETROCHEMICAL, BY COUNTRY 2022 AND 2032(%)
- FIGURE 27. COMPARATIVE SHARE ANALYSIS OF CARBON CREDITS MARKET FOR OTHERS, BY COUNTRY 2022 AND 2032(%)
- FIGURE 28. CARBON CREDITS MARKET BY REGION, 2022
- FIGURE 29. U.S. CARBON CREDITS MARKET, 2022-2032 ($MILLION)
- FIGURE 30. CANADA CARBON CREDITS MARKET, 2022-2032 ($MILLION)
- FIGURE 31. MEXICO CARBON CREDITS MARKET, 2022-2032 ($MILLION)
- FIGURE 32. GERMANY CARBON CREDITS MARKET, 2022-2032 ($MILLION)
- FIGURE 33. UK CARBON CREDITS MARKET, 2022-2032 ($MILLION)
- FIGURE 34. FRANCE CARBON CREDITS MARKET, 2022-2032 ($MILLION)
- FIGURE 35. TURKEY CARBON CREDITS MARKET, 2022-2032 ($MILLION)
- FIGURE 36. RUSSIA CARBON CREDITS MARKET, 2022-2032 ($MILLION)
- FIGURE 37. REST OF EUROPE CARBON CREDITS MARKET, 2022-2032 ($MILLION)
- FIGURE 38. CHINA CARBON CREDITS MARKET, 2022-2032 ($MILLION)
- FIGURE 39. JAPAN CARBON CREDITS MARKET, 2022-2032 ($MILLION)
- FIGURE 40. INDIA CARBON CREDITS MARKET, 2022-2032 ($MILLION)
- FIGURE 41. SOUTH KOREA CARBON CREDITS MARKET, 2022-2032 ($MILLION)
- FIGURE 42. AUSTRALIA CARBON CREDITS MARKET, 2022-2032 ($MILLION)
- FIGURE 43. REST OF ASIA-PACIFIC CARBON CREDITS MARKET, 2022-2032 ($MILLION)
- FIGURE 44. BRAZIL CARBON CREDITS MARKET, 2022-2032 ($MILLION)
- FIGURE 45. UAE CARBON CREDITS MARKET, 2022-2032 ($MILLION)
- FIGURE 46. SAUDI ARABIA CARBON CREDITS MARKET, 2022-2032 ($MILLION)
- FIGURE 47. SOUTH AFRICA CARBON CREDITS MARKET, 2022-2032 ($MILLION)
- FIGURE 48. REST OF LAMEA CARBON CREDITS MARKET, 2022-2032 ($MILLION)
- FIGURE 49. TOP WINNING STRATEGIES, BY YEAR
- FIGURE 50. TOP WINNING STRATEGIES, BY DEVELOPMENT
- FIGURE 51. TOP WINNING STRATEGIES, BY COMPANY
- FIGURE 52. PRODUCT MAPPING OF TOP 10 PLAYERS
- FIGURE 53. COMPETITIVE DASHBOARD
- FIGURE 54. COMPETITIVE HEATMAP: CARBON CREDITS MARKET
- FIGURE 55. TOP PLAYER POSITIONING, 2022
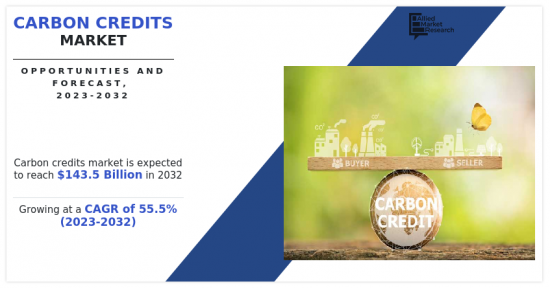
According to a new report published by Allied Market Research, titled, "Carbon Credits Market," The carbon credits market was valued at $2 billion in 2022, and is estimated to reach $143.5 billion by 2032, growing at a CAGR of 55.5% from 2023 to 2032. Carbon credits can be bought and sold in carbon markets. Buyers, such as companies, governments, or individuals, purchase carbon credits to offset their own emissions and meet their sustainability goals. The carbon credits are transferred from the seller to the buyer, often facilitated through specialized platforms or exchanges. Carbon credits help the companies to minimize their greenhouse gas emissions.
Several initiatives taken by various countries to lower the emission of greenhouse gases and to achieve net zero carbon neutrality is driving the demand for the carbon credits market. In this market, each carbon credit is assigned a unique identification number to track ownership and prevent double-counting. The emission of greenhouse gases need to be reduced to address the rising environmental issues such as floods, droughts, melting glaciers, earthquakes, and others. Carbon credits help to slow down carbon emissions, however some emissions are unavoidable. In such cases, the carbon credits are utilized to compensate or neutralize the carbon emissions to balance the amount of carbon dioxide emitted into the environment. Also, carbon credits give businesses the chance to reduce their future emissions through asset turnover and the development of their business models, as well as the option to offset their current emissions. Many private businesses voluntarily participate in the carbon credits market as a part of their corporate social responsibility (CSR) activities. Carbon credits are usually generated via forestry or agricultural practices.
However, the cost of carbon credits vary based on regions and countries. For instance, in Brazil, the cost of 1 carbon credit is around $411.36 (R$2000). Thus, the market may face challenges due to the rising cost of carbon credits. Also, carbon credits do not represent actual carbon emission reductions by the company or an individual. This is because maintaining the credibility and integrity of carbon credits needs proper reporting, monitoring which is not present at the moment. These factors are projected to hamper the market revenue growth in the upcoming years.
The collective actions and co-operation across several countries to combat the climate change is anticipated to boost the carbon credits market growth in the upcoming years. For instance, in February 2023, India announced investments and list of activities that can help in achieving environmental sustainability. For instance, under these activities, the Indian government has considered the trading of carbon credits under Article 6 of the Paris Agreement in the international market. The wish list of areas from where India would attract investments in carbon credits include renewable energy generation such as green hydrogen, thermal power, off-shore wind, compressed biogas, carbon capture and storage, and other carbon removal & mitigation activities. Also, on June 8, 2023, the World Bank's insurance arm named the Multilateral Investment Guarantee Agency (MIGA) has planned to provide insurance cover for carbon credits projects that will attract large-scale investments across the countries that are major carbon-emitters. This will also help in regulating the trade of carbon credits. These aspects are anticipated to boost the carbon credits market size during the forecast period.
The COVID-19 pandemic has had significant impact on the market for carbon credits. Numerous projects that help in reducing the carbon emissions were halted as a result of the pandemic. Projects were delayed or cancelled due to travel restrictions, supply chain disruptions, and financial limitations. This consequently had an impact on the creation of new carbon credits and decreased their marketability. The demand for carbon credits was impacted by the economic downturn brought on by the pandemic. Businesses that are experiencing financial difficulties and declining revenues may have reduced their voluntary carbon offsetting efforts. In addition, some businesses put short-term financial viability ahead of long-term sustainability objectives, which led to a decline in the demand for carbon credits in some industries.
The key players profiled in this report include: South Pole, 3Degrees, EKI Energy Services Ltd, TerraPass, NATUREOFFICE, Moss.Earth, Climate Impact Partners, Carbon Credit Capital, LLC, CarbonBetter, and NativeEnergy. The market players are continuously endeavoring to have a dominant position in this competitive market by using strategies such as collaborations and acquisitions.
Key Benefits For Stakeholders
- This report provides a quantitative analysis of the market segments, current trends, estimations, and dynamics of the carbon credits market analysis from 2022 to 2032 to identify the prevailing carbon credits market opportunities.
- The market research is offered along with information related to key drivers, restraints, and opportunities.
- Porter's five forces analysis highlights the potency of buyers and suppliers to enable stakeholders make profit-oriented business decisions and strengthen their supplier-buyer network.
- In-depth analysis of the carbon credits market segmentation assists to determine the prevailing market opportunities.
- Major countries in each region are mapped according to their revenue contribution to the global market.
- Market player positioning facilitates benchmarking and provides a clear understanding of the present position of the market players.
- The report includes the analysis of the regional as well as global carbon credits market trends, key players, market segments, application areas, and market growth strategies.
Key Market Segments
By Type
- Regulatory
- Voluntary
By System
- Cap-and-Trade
- Baseline-and-Credit
By End-use Industry
- Aviation
- Energy
- Industrial
- Petrochemical
- Others
By Region
- North America
- U.S.
- Canada
- Mexico
- Europe
- Germany
- UK
- France
- Turkey
- Russia
- Rest of Europe
- Asia-Pacific
- China
- Japan
- India
- South Korea
- Australia
- Rest of Asia-Pacific
- LAMEA
- Brazil
- UAE
- Saudi Arabia
- South Africa
- Rest of LAMEA
Key Market Players:
- 3Degrees
- CarbonBetter
- Carbon Credit Capital, LLC.
- Climate Impact Partners
- EKI Energy Services Ltd.
- Moss.Earth
- NativeEnergy
- NATUREOFFICE
- South Pole
- TerraPass
TABLE OF CONTENTS
CHAPTER 1: INTRODUCTION
- 1.1. Report description
- 1.2. Key market segments
- 1.3. Key benefits to the stakeholders
- 1.4. Research Methodology
- 1.4.1. Primary research
- 1.4.2. Secondary research
- 1.4.3. Analyst tools and models
CHAPTER 2: EXECUTIVE SUMMARY
- 2.1. CXO Perspective
CHAPTER 3: MARKET OVERVIEW
- 3.1. Market definition and scope
- 3.2. Key findings
- 3.2.1. Top impacting factors
- 3.2.2. Top investment pockets
- 3.3. Porter's five forces analysis
- 3.4. Market dynamics
- 3.4.1. Drivers
- 3.4.2. Restraints
- 3.4.3. Opportunities
- 3.5. COVID-19 Impact Analysis on the market
- 3.6. Brand Share Analysis
- 3.7. Key Regulation Analysis
- 3.8. Market Share Analysis
- 3.9. Patent Landscape
- 3.10. Regulatory Guidelines
- 3.11. Value Chain Analysis
CHAPTER 4: CARBON CREDITS MARKET, BY TYPE
- 4.1. Overview
- 4.1.1. Market size and forecast
- 4.2. Regulatory
- 4.2.1. Key market trends, growth factors and opportunities
- 4.2.2. Market size and forecast, by region
- 4.2.3. Market share analysis by country
- 4.3. Voluntary
- 4.3.1. Key market trends, growth factors and opportunities
- 4.3.2. Market size and forecast, by region
- 4.3.3. Market share analysis by country
CHAPTER 5: CARBON CREDITS MARKET, BY SYSTEM
- 5.1. Overview
- 5.1.1. Market size and forecast
- 5.2. Cap-and-Trade
- 5.2.1. Key market trends, growth factors and opportunities
- 5.2.2. Market size and forecast, by region
- 5.2.3. Market share analysis by country
- 5.3. Baseline-and-Credit
- 5.3.1. Key market trends, growth factors and opportunities
- 5.3.2. Market size and forecast, by region
- 5.3.3. Market share analysis by country
CHAPTER 6: CARBON CREDITS MARKET, BY END-USE INDUSTRY
- 6.1. Overview
- 6.1.1. Market size and forecast
- 6.2. Aviation
- 6.2.1. Key market trends, growth factors and opportunities
- 6.2.2. Market size and forecast, by region
- 6.2.3. Market share analysis by country
- 6.3. Energy
- 6.3.1. Key market trends, growth factors and opportunities
- 6.3.2. Market size and forecast, by region
- 6.3.3. Market share analysis by country
- 6.4. Industrial
- 6.4.1. Key market trends, growth factors and opportunities
- 6.4.2. Market size and forecast, by region
- 6.4.3. Market share analysis by country
- 6.5. Petrochemical
- 6.5.1. Key market trends, growth factors and opportunities
- 6.5.2. Market size and forecast, by region
- 6.5.3. Market share analysis by country
- 6.6. Others
- 6.6.1. Key market trends, growth factors and opportunities
- 6.6.2. Market size and forecast, by region
- 6.6.3. Market share analysis by country
CHAPTER 7: CARBON CREDITS MARKET, BY REGION
- 7.1. Overview
- 7.1.1. Market size and forecast By Region
- 7.2. North America
- 7.2.1. Key trends and opportunities
- 7.2.2. Market size and forecast, by Type
- 7.2.3. Market size and forecast, by System
- 7.2.4. Market size and forecast, by End-use Industry
- 7.2.5. Market size and forecast, by country
- 7.2.5.1. U.S.
- 7.2.5.1.1. Key market trends, growth factors and opportunities
- 7.2.5.1.2. Market size and forecast, by Type
- 7.2.5.1.3. Market size and forecast, by System
- 7.2.5.1.4. Market size and forecast, by End-use Industry
- 7.2.5.2. Canada
- 7.2.5.2.1. Key market trends, growth factors and opportunities
- 7.2.5.2.2. Market size and forecast, by Type
- 7.2.5.2.3. Market size and forecast, by System
- 7.2.5.2.4. Market size and forecast, by End-use Industry
- 7.2.5.3. Mexico
- 7.2.5.3.1. Key market trends, growth factors and opportunities
- 7.2.5.3.2. Market size and forecast, by Type
- 7.2.5.3.3. Market size and forecast, by System
- 7.2.5.3.4. Market size and forecast, by End-use Industry
- 7.3. Europe
- 7.3.1. Key trends and opportunities
- 7.3.2. Market size and forecast, by Type
- 7.3.3. Market size and forecast, by System
- 7.3.4. Market size and forecast, by End-use Industry
- 7.3.5. Market size and forecast, by country
- 7.3.5.1. Germany
- 7.3.5.1.1. Key market trends, growth factors and opportunities
- 7.3.5.1.2. Market size and forecast, by Type
- 7.3.5.1.3. Market size and forecast, by System
- 7.3.5.1.4. Market size and forecast, by End-use Industry
- 7.3.5.2. UK
- 7.3.5.2.1. Key market trends, growth factors and opportunities
- 7.3.5.2.2. Market size and forecast, by Type
- 7.3.5.2.3. Market size and forecast, by System
- 7.3.5.2.4. Market size and forecast, by End-use Industry
- 7.3.5.3. France
- 7.3.5.3.1. Key market trends, growth factors and opportunities
- 7.3.5.3.2. Market size and forecast, by Type
- 7.3.5.3.3. Market size and forecast, by System
- 7.3.5.3.4. Market size and forecast, by End-use Industry
- 7.3.5.4. Turkey
- 7.3.5.4.1. Key market trends, growth factors and opportunities
- 7.3.5.4.2. Market size and forecast, by Type
- 7.3.5.4.3. Market size and forecast, by System
- 7.3.5.4.4. Market size and forecast, by End-use Industry
- 7.3.5.5. Russia
- 7.3.5.5.1. Key market trends, growth factors and opportunities
- 7.3.5.5.2. Market size and forecast, by Type
- 7.3.5.5.3. Market size and forecast, by System
- 7.3.5.5.4. Market size and forecast, by End-use Industry
- 7.3.5.6. Rest of Europe
- 7.3.5.6.1. Key market trends, growth factors and opportunities
- 7.3.5.6.2. Market size and forecast, by Type
- 7.3.5.6.3. Market size and forecast, by System
- 7.3.5.6.4. Market size and forecast, by End-use Industry
- 7.4. Asia-Pacific
- 7.4.1. Key trends and opportunities
- 7.4.2. Market size and forecast, by Type
- 7.4.3. Market size and forecast, by System
- 7.4.4. Market size and forecast, by End-use Industry
- 7.4.5. Market size and forecast, by country
- 7.4.5.1. China
- 7.4.5.1.1. Key market trends, growth factors and opportunities
- 7.4.5.1.2. Market size and forecast, by Type
- 7.4.5.1.3. Market size and forecast, by System
- 7.4.5.1.4. Market size and forecast, by End-use Industry
- 7.4.5.2. Japan
- 7.4.5.2.1. Key market trends, growth factors and opportunities
- 7.4.5.2.2. Market size and forecast, by Type
- 7.4.5.2.3. Market size and forecast, by System
- 7.4.5.2.4. Market size and forecast, by End-use Industry
- 7.4.5.3. India
- 7.4.5.3.1. Key market trends, growth factors and opportunities
- 7.4.5.3.2. Market size and forecast, by Type
- 7.4.5.3.3. Market size and forecast, by System
- 7.4.5.3.4. Market size and forecast, by End-use Industry
- 7.4.5.4. South Korea
- 7.4.5.4.1. Key market trends, growth factors and opportunities
- 7.4.5.4.2. Market size and forecast, by Type
- 7.4.5.4.3. Market size and forecast, by System
- 7.4.5.4.4. Market size and forecast, by End-use Industry
- 7.4.5.5. Australia
- 7.4.5.5.1. Key market trends, growth factors and opportunities
- 7.4.5.5.2. Market size and forecast, by Type
- 7.4.5.5.3. Market size and forecast, by System
- 7.4.5.5.4. Market size and forecast, by End-use Industry
- 7.4.5.6. Rest of Asia-Pacific
- 7.4.5.6.1. Key market trends, growth factors and opportunities
- 7.4.5.6.2. Market size and forecast, by Type
- 7.4.5.6.3. Market size and forecast, by System
- 7.4.5.6.4. Market size and forecast, by End-use Industry
- 7.5. LAMEA
- 7.5.1. Key trends and opportunities
- 7.5.2. Market size and forecast, by Type
- 7.5.3. Market size and forecast, by System
- 7.5.4. Market size and forecast, by End-use Industry
- 7.5.5. Market size and forecast, by country
- 7.5.5.1. Brazil
- 7.5.5.1.1. Key market trends, growth factors and opportunities
- 7.5.5.1.2. Market size and forecast, by Type
- 7.5.5.1.3. Market size and forecast, by System
- 7.5.5.1.4. Market size and forecast, by End-use Industry
- 7.5.5.2. UAE
- 7.5.5.2.1. Key market trends, growth factors and opportunities
- 7.5.5.2.2. Market size and forecast, by Type
- 7.5.5.2.3. Market size and forecast, by System
- 7.5.5.2.4. Market size and forecast, by End-use Industry
- 7.5.5.3. Saudi Arabia
- 7.5.5.3.1. Key market trends, growth factors and opportunities
- 7.5.5.3.2. Market size and forecast, by Type
- 7.5.5.3.3. Market size and forecast, by System
- 7.5.5.3.4. Market size and forecast, by End-use Industry
- 7.5.5.4. South Africa
- 7.5.5.4.1. Key market trends, growth factors and opportunities
- 7.5.5.4.2. Market size and forecast, by Type
- 7.5.5.4.3. Market size and forecast, by System
- 7.5.5.4.4. Market size and forecast, by End-use Industry
- 7.5.5.5. Rest of LAMEA
- 7.5.5.5.1. Key market trends, growth factors and opportunities
- 7.5.5.5.2. Market size and forecast, by Type
- 7.5.5.5.3. Market size and forecast, by System
- 7.5.5.5.4. Market size and forecast, by End-use Industry
CHAPTER 8: COMPETITIVE LANDSCAPE
- 8.1. Introduction
- 8.2. Top winning strategies
- 8.3. Product Mapping of Top 10 Player
- 8.4. Competitive Dashboard
- 8.5. Competitive Heatmap
- 8.6. Top player positioning, 2022
CHAPTER 9: COMPANY PROFILES
- 9.1. South Pole
- 9.1.1. Company overview
- 9.1.2. Key Executives
- 9.1.3. Company snapshot
- 9.2. 3Degrees
- 9.2.1. Company overview
- 9.2.2. Key Executives
- 9.2.3. Company snapshot
- 9.3. EKI Energy Services Ltd.
- 9.3.1. Company overview
- 9.3.2. Key Executives
- 9.3.3. Company snapshot
- 9.4. TerraPass
- 9.4.1. Company overview
- 9.4.2. Key Executives
- 9.4.3. Company snapshot
- 9.5. NATUREOFFICE
- 9.5.1. Company overview
- 9.5.2. Key Executives
- 9.5.3. Company snapshot
- 9.6. Moss.Earth
- 9.6.1. Company overview
- 9.6.2. Key Executives
- 9.6.3. Company snapshot
- 9.7. Climate Impact Partners
- 9.7.1. Company overview
- 9.7.2. Key Executives
- 9.7.3. Company snapshot
- 9.8. Carbon Credit Capital, LLC.
- 9.8.1. Company overview
- 9.8.2. Key Executives
- 9.8.3. Company snapshot
- 9.9. CarbonBetter
- 9.9.1. Company overview
- 9.9.2. Key Executives
- 9.9.3. Company snapshot
- 9.10. NativeEnergy
- 9.10.1. Company overview
- 9.10.2. Key Executives
- 9.10.3. Company snapshot