
|
市場調査レポート
商品コード
1344429
飼料用マイコトキシン結合剤市場:家畜別、供給源別、形態別:世界機会分析と産業予測、2022-2031年Feed Mycotoxin Binders Market By Livestock (Swine, Ruminants, Poultry, Aquatic animals, Others), By Source (Organic, Conventional), By Form (Dry, Liquid, Others): Global Opportunity Analysis and Industry Forecast, 2022-2031 |
||||||
|
|||||||

| 飼料用マイコトキシン結合剤市場:家畜別、供給源別、形態別:世界機会分析と産業予測、2022-2031年 |
|
出版日: 2023年05月30日
発行: Allied Market Research
ページ情報: 英文 233 Pages
納期: 2~3営業日
|

- 全表示
- 概要
- 図表
- 目次
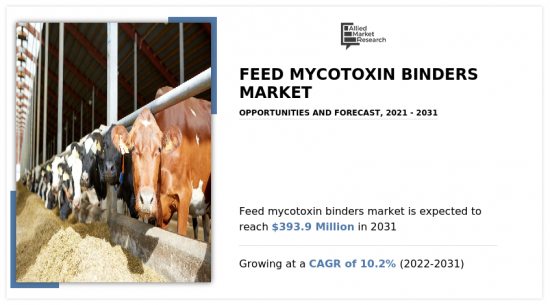
Allied Market Researchが発行した最新レポート「飼料用マイコトキシン結合剤市場」によると、飼料用マイコトキシン結合剤市場は2021年に1億4,460万米ドルと評価され、2031年には3億9,390万米ドルに達し、2022年から2031年までのCAGRは10.2%で成長すると予測されています。
マイコトキシンは、畑や穀物、飼料、飼料の貯蔵中にカビや真菌によって産生される二次代謝産物です。マイコトキシンは土壌を媒介する病原体と考えられています。すべてのカビや真菌がマイコトキシンを生成するわけではないです。マイコトキシンは主に単独で発生します。1つのカビが複数のマイコトキシンを産生する可能性があることから、複数のカビが1つの飼料原料を汚染する可能性があります。動物用飼料には複数の原材料が含まれているため、完成した飼料中に複数のマイコトキシンが検出されることはよくあることです。このため、カビ毒同士の相互作用が起こり、動物への相乗効果や相加効果が生じる。
飼料用マイコトキシン結合剤業界は現在、乳製品需要の増加、食肉および食肉製品の需要増加、人口増加、畜産業の成長によって牽引されています。さらに、有機栽培された家畜の需要の増加は、飼料用マイコトキシン結合剤市場の需要を促進します。飼料用マイコトキシン結合剤は、マイコトキシンに関連する影響を軽減するために動物飼料に使用されます。飼料に含まれる主なカビ毒には、アフラトキシン(B1、B2、G1、G2、M1)、オクラトキシンA、フモニシン(B1、B2、B3)を含むフザリウム・カビが産生するパツリン毒素、トリコテセン(主にニバレノール、デオキシニバレノール、T-2、HT-2毒素)、ゼアラレノン、エルゴアルカロイド、シトリニン、ステリグマトシスチン、オルタナリア毒素などがあります。このうち、アフラトキシンは最も有害なカビ毒の一種で、胃腸障害、生殖障害、免疫系の抑制など、さまざまな健康上の懸念を引き起こす可能性があります。アジア太平洋市場は、主要な市場プレイヤーの存在により、着実な成長が見込まれます。
家禽産業は、家禽飼料中のカビ毒の存在により常に脅威にさらされています。家禽飼料の製造に使用される飼料原料は、有害なカビ毒に汚染されている可能性があり、家禽が消化できないことで深刻な損害につながる可能性があります。カビには、収穫時にカビ毒を生成するものもあれば、穀物の貯蔵中にカビ毒を生成するものもあります。カビ毒の被害を受ける最も一般的な家禽用飼料原料は、大豆粕、大麦、トウモロコシ&トウモロコシ製品別、小麦&小麦製品別などです。家禽はカビ毒に対して非常に敏感です。臓器サイズの増大、肝臓障害、神経学的影響、繁殖力の低下、飼料拒否などを引き起こす可能性があります。マイコトキシンは、飼料にマイコトキシン結合剤をイントロダクションすることで防ぐことができます。従って、家禽用飼料における飼料用マイコトキシン結合剤の需要を促進しています。
しかし、製品承認に関連する厳しい政府規制が市場成長の妨げになる可能性が高いです。例えば、欧州連合(EU)では、カビ毒による飼料の汚染を軽減するための物質は技術的飼料添加物のカテゴリーに分類されています。この製品群は、飼料添加物の登録手順を定めた規則EC 1831/2003に記載された規則に従って登録されなければならないです。
生産者の有機飼料への需要は、飼料マイコトキシン結合剤メーカーにチャンスをもたらすと思われます。オーガニック食品の消費に関する消費者の意識の高まりと、様々なメーカーによる健康的な食品オプションの利用可能性により、オーガニック食品への需要が高まっていることが、家畜生産者が家畜飼料にオーガニック原料を使用することを奨励しています。
目次
第1章 イントロダクション
第2章 エグゼクティブサマリー
第3章 市場概要
- 市場の定義と範囲
- 主な調査結果
- 影響要因
- 主な投資機会
- ポーターのファイブフォース分析
- 市場力学
- 促進要因
- 食肉生産と消費の増加
- 疾病発生による食肉製品の標準化
- 動物の健康に及ぼすカビ毒の影響の増加
- 抑制要因
- 原材料コストの上昇
- 厳しい規制と国際品質基準
- 機会
- オーガニック需要の増加
- eコマースの拡大
- 促進要因
- COVID-19による市場への影響分析
第4章 飼料用マイコトキシン結合剤市場:家畜別
- 豚
- 反芻動物
- 家禽
- 水生動物
- その他
第5章 飼料用マイコトキシン結合剤市場:供給源別
- オーガニック
- 従来型
第6章 飼料用マイコトキシン結合剤市場:形態別
- 乾式
- 液体
- その他
第7章 飼料用マイコトキシン結合剤市場:地域別
- 北米
- 米国
- カナダ
- メキシコ
- 欧州
- ドイツ
- 英国
- イタリア
- フランス
- スペイン
- ロシア
- その他欧州
- アジア太平洋
- 中国
- 日本
- インド
- 韓国
- オーストラリア
- シンガポール
- ニュージーランド
- その他アジア太平洋地域
- ラテンアメリカ・中東・アフリカ
- ブラジル
- アルゼンチン
- 南アフリカ
- アラブ首長国連邦
- その他の地域
第8章 競合情勢
- イントロダクション
- 主要成功戦略
- 主要10企業の製品マッピング
- 競合ダッシュボード
- 競合ヒートマップ
- 主要企業のポジショニング、2021年
第9章 企業プロファイル
- Alltech, Inc.
- BASF SE
- Bentoli, Inc.
- Bertol Company s.r.o.
- Cargill, Incorporated
- Clariant Ltd.
- Koninklijke DSM N.V.
- EW Nutrition GmbH
- GLOBAL NUTRITECH
- Impextraco N.V.
- Kemin Industries, Inc.
- Norel, S.A
- SVH Holding N.V.
- Olmix S.A.
- Perstorp Holding AB
- Simfa Labs Pvt. Ltd.
- Virbac S.A.
LIST OF TABLES
- TABLE 01. GLOBAL FEED MYCOTOXIN BINDERS MARKET, BY LIVESTOCK, 2021-2031 ($MILLION)
- TABLE 02. FEED MYCOTOXIN BINDERS MARKET FOR SWINE, BY REGION, 2021-2031 ($MILLION)
- TABLE 03. FEED MYCOTOXIN BINDERS MARKET FOR RUMINANTS, BY REGION, 2021-2031 ($MILLION)
- TABLE 04. FEED MYCOTOXIN BINDERS MARKET FOR POULTRY, BY REGION, 2021-2031 ($MILLION)
- TABLE 05. FEED MYCOTOXIN BINDERS MARKET FOR AQUATIC ANIMALS, BY REGION, 2021-2031 ($MILLION)
- TABLE 06. FEED MYCOTOXIN BINDERS MARKET FOR OTHERS, BY REGION, 2021-2031 ($MILLION)
- TABLE 07. GLOBAL FEED MYCOTOXIN BINDERS MARKET, BY SOURCE, 2021-2031 ($MILLION)
- TABLE 08. FEED MYCOTOXIN BINDERS MARKET FOR ORGANIC, BY REGION, 2021-2031 ($MILLION)
- TABLE 09. FEED MYCOTOXIN BINDERS MARKET FOR CONVENTIONAL, BY REGION, 2021-2031 ($MILLION)
- TABLE 10. GLOBAL FEED MYCOTOXIN BINDERS MARKET, BY FORM, 2021-2031 ($MILLION)
- TABLE 11. FEED MYCOTOXIN BINDERS MARKET FOR DRY, BY REGION, 2021-2031 ($MILLION)
- TABLE 12. FEED MYCOTOXIN BINDERS MARKET FOR LIQUID, BY REGION, 2021-2031 ($MILLION)
- TABLE 13. FEED MYCOTOXIN BINDERS MARKET FOR OTHERS, BY REGION, 2021-2031 ($MILLION)
- TABLE 14. FEED MYCOTOXIN BINDERS MARKET, BY REGION, 2021-2031 ($MILLION)
- TABLE 15. NORTH AMERICA FEED MYCOTOXIN BINDERS MARKET, BY LIVESTOCK, 2021-2031 ($MILLION)
- TABLE 16. NORTH AMERICA FEED MYCOTOXIN BINDERS MARKET, BY SOURCE, 2021-2031 ($MILLION)
- TABLE 17. NORTH AMERICA FEED MYCOTOXIN BINDERS MARKET, BY FORM, 2021-2031 ($MILLION)
- TABLE 18. NORTH AMERICA FEED MYCOTOXIN BINDERS MARKET, BY COUNTRY, 2021-2031 ($MILLION)
- TABLE 19. U.S. FEED MYCOTOXIN BINDERS MARKET, BY LIVESTOCK, 2021-2031 ($MILLION)
- TABLE 20. U.S. FEED MYCOTOXIN BINDERS MARKET, BY SOURCE, 2021-2031 ($MILLION)
- TABLE 21. U.S. FEED MYCOTOXIN BINDERS MARKET, BY FORM, 2021-2031 ($MILLION)
- TABLE 22. CANADA FEED MYCOTOXIN BINDERS MARKET, BY LIVESTOCK, 2021-2031 ($MILLION)
- TABLE 23. CANADA FEED MYCOTOXIN BINDERS MARKET, BY SOURCE, 2021-2031 ($MILLION)
- TABLE 24. CANADA FEED MYCOTOXIN BINDERS MARKET, BY FORM, 2021-2031 ($MILLION)
- TABLE 25. MEXICO FEED MYCOTOXIN BINDERS MARKET, BY LIVESTOCK, 2021-2031 ($MILLION)
- TABLE 26. MEXICO FEED MYCOTOXIN BINDERS MARKET, BY SOURCE, 2021-2031 ($MILLION)
- TABLE 27. MEXICO FEED MYCOTOXIN BINDERS MARKET, BY FORM, 2021-2031 ($MILLION)
- TABLE 28. EUROPE FEED MYCOTOXIN BINDERS MARKET, BY LIVESTOCK, 2021-2031 ($MILLION)
- TABLE 29. EUROPE FEED MYCOTOXIN BINDERS MARKET, BY SOURCE, 2021-2031 ($MILLION)
- TABLE 30. EUROPE FEED MYCOTOXIN BINDERS MARKET, BY FORM, 2021-2031 ($MILLION)
- TABLE 31. EUROPE FEED MYCOTOXIN BINDERS MARKET, BY COUNTRY, 2021-2031 ($MILLION)
- TABLE 32. GERMANY FEED MYCOTOXIN BINDERS MARKET, BY LIVESTOCK, 2021-2031 ($MILLION)
- TABLE 33. GERMANY FEED MYCOTOXIN BINDERS MARKET, BY SOURCE, 2021-2031 ($MILLION)
- TABLE 34. GERMANY FEED MYCOTOXIN BINDERS MARKET, BY FORM, 2021-2031 ($MILLION)
- TABLE 35. UK FEED MYCOTOXIN BINDERS MARKET, BY LIVESTOCK, 2021-2031 ($MILLION)
- TABLE 36. UK FEED MYCOTOXIN BINDERS MARKET, BY SOURCE, 2021-2031 ($MILLION)
- TABLE 37. UK FEED MYCOTOXIN BINDERS MARKET, BY FORM, 2021-2031 ($MILLION)
- TABLE 38. ITALY FEED MYCOTOXIN BINDERS MARKET, BY LIVESTOCK, 2021-2031 ($MILLION)
- TABLE 39. ITALY FEED MYCOTOXIN BINDERS MARKET, BY SOURCE, 2021-2031 ($MILLION)
- TABLE 40. ITALY FEED MYCOTOXIN BINDERS MARKET, BY FORM, 2021-2031 ($MILLION)
- TABLE 41. FRANCE FEED MYCOTOXIN BINDERS MARKET, BY LIVESTOCK, 2021-2031 ($MILLION)
- TABLE 42. FRANCE FEED MYCOTOXIN BINDERS MARKET, BY SOURCE, 2021-2031 ($MILLION)
- TABLE 43. FRANCE FEED MYCOTOXIN BINDERS MARKET, BY FORM, 2021-2031 ($MILLION)
- TABLE 44. SPAIN FEED MYCOTOXIN BINDERS MARKET, BY LIVESTOCK, 2021-2031 ($MILLION)
- TABLE 45. SPAIN FEED MYCOTOXIN BINDERS MARKET, BY SOURCE, 2021-2031 ($MILLION)
- TABLE 46. SPAIN FEED MYCOTOXIN BINDERS MARKET, BY FORM, 2021-2031 ($MILLION)
- TABLE 47. RUSSIA FEED MYCOTOXIN BINDERS MARKET, BY LIVESTOCK, 2021-2031 ($MILLION)
- TABLE 48. RUSSIA FEED MYCOTOXIN BINDERS MARKET, BY SOURCE, 2021-2031 ($MILLION)
- TABLE 49. RUSSIA FEED MYCOTOXIN BINDERS MARKET, BY FORM, 2021-2031 ($MILLION)
- TABLE 50. REST OF EUROPE FEED MYCOTOXIN BINDERS MARKET, BY LIVESTOCK, 2021-2031 ($MILLION)
- TABLE 51. REST OF EUROPE FEED MYCOTOXIN BINDERS MARKET, BY SOURCE, 2021-2031 ($MILLION)
- TABLE 52. REST OF EUROPE FEED MYCOTOXIN BINDERS MARKET, BY FORM, 2021-2031 ($MILLION)
- TABLE 53. ASIA-PACIFIC FEED MYCOTOXIN BINDERS MARKET, BY LIVESTOCK, 2021-2031 ($MILLION)
- TABLE 54. ASIA-PACIFIC FEED MYCOTOXIN BINDERS MARKET, BY SOURCE, 2021-2031 ($MILLION)
- TABLE 55. ASIA-PACIFIC FEED MYCOTOXIN BINDERS MARKET, BY FORM, 2021-2031 ($MILLION)
- TABLE 56. ASIA-PACIFIC FEED MYCOTOXIN BINDERS MARKET, BY COUNTRY, 2021-2031 ($MILLION)
- TABLE 57. CHINA FEED MYCOTOXIN BINDERS MARKET, BY LIVESTOCK, 2021-2031 ($MILLION)
- TABLE 58. CHINA FEED MYCOTOXIN BINDERS MARKET, BY SOURCE, 2021-2031 ($MILLION)
- TABLE 59. CHINA FEED MYCOTOXIN BINDERS MARKET, BY FORM, 2021-2031 ($MILLION)
- TABLE 60. JAPAN FEED MYCOTOXIN BINDERS MARKET, BY LIVESTOCK, 2021-2031 ($MILLION)
- TABLE 61. JAPAN FEED MYCOTOXIN BINDERS MARKET, BY SOURCE, 2021-2031 ($MILLION)
- TABLE 62. JAPAN FEED MYCOTOXIN BINDERS MARKET, BY FORM, 2021-2031 ($MILLION)
- TABLE 63. INDIA FEED MYCOTOXIN BINDERS MARKET, BY LIVESTOCK, 2021-2031 ($MILLION)
- TABLE 64. INDIA FEED MYCOTOXIN BINDERS MARKET, BY SOURCE, 2021-2031 ($MILLION)
- TABLE 65. INDIA FEED MYCOTOXIN BINDERS MARKET, BY FORM, 2021-2031 ($MILLION)
- TABLE 66. SOUTH KOREA FEED MYCOTOXIN BINDERS MARKET, BY LIVESTOCK, 2021-2031 ($MILLION)
- TABLE 67. SOUTH KOREA FEED MYCOTOXIN BINDERS MARKET, BY SOURCE, 2021-2031 ($MILLION)
- TABLE 68. SOUTH KOREA FEED MYCOTOXIN BINDERS MARKET, BY FORM, 2021-2031 ($MILLION)
- TABLE 69. AUSTRALIA FEED MYCOTOXIN BINDERS MARKET, BY LIVESTOCK, 2021-2031 ($MILLION)
- TABLE 70. AUSTRALIA FEED MYCOTOXIN BINDERS MARKET, BY SOURCE, 2021-2031 ($MILLION)
- TABLE 71. AUSTRALIA FEED MYCOTOXIN BINDERS MARKET, BY FORM, 2021-2031 ($MILLION)
- TABLE 72. SINGAPORE FEED MYCOTOXIN BINDERS MARKET, BY LIVESTOCK, 2021-2031 ($MILLION)
- TABLE 73. SINGAPORE FEED MYCOTOXIN BINDERS MARKET, BY SOURCE, 2021-2031 ($MILLION)
- TABLE 74. SINGAPORE FEED MYCOTOXIN BINDERS MARKET, BY FORM, 2021-2031 ($MILLION)
- TABLE 75. NEW ZEALAND FEED MYCOTOXIN BINDERS MARKET, BY LIVESTOCK, 2021-2031 ($MILLION)
- TABLE 76. NEW ZEALAND FEED MYCOTOXIN BINDERS MARKET, BY SOURCE, 2021-2031 ($MILLION)
- TABLE 77. NEW ZEALAND FEED MYCOTOXIN BINDERS MARKET, BY FORM, 2021-2031 ($MILLION)
- TABLE 78. REST OF ASIA-PACIFIC FEED MYCOTOXIN BINDERS MARKET, BY LIVESTOCK, 2021-2031 ($MILLION)
- TABLE 79. REST OF ASIA-PACIFIC FEED MYCOTOXIN BINDERS MARKET, BY SOURCE, 2021-2031 ($MILLION)
- TABLE 80. REST OF ASIA-PACIFIC FEED MYCOTOXIN BINDERS MARKET, BY FORM, 2021-2031 ($MILLION)
- TABLE 81. LAMEA FEED MYCOTOXIN BINDERS MARKET, BY LIVESTOCK, 2021-2031 ($MILLION)
- TABLE 82. LAMEA FEED MYCOTOXIN BINDERS MARKET, BY SOURCE, 2021-2031 ($MILLION)
- TABLE 83. LAMEA FEED MYCOTOXIN BINDERS MARKET, BY FORM, 2021-2031 ($MILLION)
- TABLE 84. LAMEA FEED MYCOTOXIN BINDERS MARKET, BY COUNTRY, 2021-2031 ($MILLION)
- TABLE 85. BRAZIL FEED MYCOTOXIN BINDERS MARKET, BY LIVESTOCK, 2021-2031 ($MILLION)
- TABLE 86. BRAZIL FEED MYCOTOXIN BINDERS MARKET, BY SOURCE, 2021-2031 ($MILLION)
- TABLE 87. BRAZIL FEED MYCOTOXIN BINDERS MARKET, BY FORM, 2021-2031 ($MILLION)
- TABLE 88. ARGENTINA FEED MYCOTOXIN BINDERS MARKET, BY LIVESTOCK, 2021-2031 ($MILLION)
- TABLE 89. ARGENTINA FEED MYCOTOXIN BINDERS MARKET, BY SOURCE, 2021-2031 ($MILLION)
- TABLE 90. ARGENTINA FEED MYCOTOXIN BINDERS MARKET, BY FORM, 2021-2031 ($MILLION)
- TABLE 91. SOUTH AFRICA FEED MYCOTOXIN BINDERS MARKET, BY LIVESTOCK, 2021-2031 ($MILLION)
- TABLE 92. SOUTH AFRICA FEED MYCOTOXIN BINDERS MARKET, BY SOURCE, 2021-2031 ($MILLION)
- TABLE 93. SOUTH AFRICA FEED MYCOTOXIN BINDERS MARKET, BY FORM, 2021-2031 ($MILLION)
- TABLE 94. UNITED ARAB EMIRATES FEED MYCOTOXIN BINDERS MARKET, BY LIVESTOCK, 2021-2031 ($MILLION)
- TABLE 95. UNITED ARAB EMIRATES FEED MYCOTOXIN BINDERS MARKET, BY SOURCE, 2021-2031 ($MILLION)
- TABLE 96. UNITED ARAB EMIRATES FEED MYCOTOXIN BINDERS MARKET, BY FORM, 2021-2031 ($MILLION)
- TABLE 97. REST OF LAMEA FEED MYCOTOXIN BINDERS MARKET, BY LIVESTOCK, 2021-2031 ($MILLION)
- TABLE 98. REST OF LAMEA FEED MYCOTOXIN BINDERS MARKET, BY SOURCE, 2021-2031 ($MILLION)
- TABLE 99. REST OF LAMEA FEED MYCOTOXIN BINDERS MARKET, BY FORM, 2021-2031 ($MILLION)
- TABLE 100. ALLTECH, INC.: KEY EXECUTIVES
- TABLE 101. ALLTECH, INC.: COMPANY SNAPSHOT
- TABLE 102. ALLTECH, INC.: PRODUCT SEGMENTS
- TABLE 103. ALLTECH, INC.: PRODUCT PORTFOLIO
- TABLE 104. BASF SE: KEY EXECUTIVES
- TABLE 105. BASF SE: COMPANY SNAPSHOT
- TABLE 106. BASF SE: PRODUCT SEGMENTS
- TABLE 107. BASF SE: PRODUCT PORTFOLIO
- TABLE 108. BASF SE: KEY STRATERGIES
- TABLE 109. BENTOLI, INC.: KEY EXECUTIVES
- TABLE 110. BENTOLI, INC.: COMPANY SNAPSHOT
- TABLE 111. BENTOLI, INC.: PRODUCT SEGMENTS
- TABLE 112. BENTOLI, INC.: PRODUCT PORTFOLIO
- TABLE 113. BERTOL COMPANY S.R.O.: KEY EXECUTIVES
- TABLE 114. BERTOL COMPANY S.R.O.: COMPANY SNAPSHOT
- TABLE 115. BERTOL COMPANY S.R.O.: PRODUCT SEGMENTS
- TABLE 116. BERTOL COMPANY S.R.O.: PRODUCT PORTFOLIO
- TABLE 117. CARGILL, INCORPORATED: KEY EXECUTIVES
- TABLE 118. CARGILL, INCORPORATED: COMPANY SNAPSHOT
- TABLE 119. CARGILL, INCORPORATED: PRODUCT SEGMENTS
- TABLE 120. CARGILL, INCORPORATED: PRODUCT PORTFOLIO
- TABLE 121. CARGILL, INCORPORATED: KEY STRATERGIES
- TABLE 122. CLARIANT LTD.: KEY EXECUTIVES
- TABLE 123. CLARIANT LTD.: COMPANY SNAPSHOT
- TABLE 124. CLARIANT LTD.: PRODUCT SEGMENTS
- TABLE 125. CLARIANT LTD.: PRODUCT PORTFOLIO
- TABLE 126. KONINKLIJKE DSM N.V.: KEY EXECUTIVES
- TABLE 127. KONINKLIJKE DSM N.V.: COMPANY SNAPSHOT
- TABLE 128. KONINKLIJKE DSM N.V.: PRODUCT SEGMENTS
- TABLE 129. KONINKLIJKE DSM N.V.: PRODUCT PORTFOLIO
- TABLE 130. KONINKLIJKE DSM N.V.: KEY STRATERGIES
- TABLE 131. EW NUTRITION GMBH: KEY EXECUTIVES
- TABLE 132. EW NUTRITION GMBH: COMPANY SNAPSHOT
- TABLE 133. EW NUTRITION GMBH: PRODUCT SEGMENTS
- TABLE 134. EW NUTRITION GMBH: PRODUCT PORTFOLIO
- TABLE 135. EW NUTRITION GMBH: KEY STRATERGIES
- TABLE 136. GLOBAL NUTRITECH: KEY EXECUTIVES
- TABLE 137. GLOBAL NUTRITECH: COMPANY SNAPSHOT
- TABLE 138. GLOBAL NUTRITECH: PRODUCT SEGMENTS
- TABLE 139. GLOBAL NUTRITECH: PRODUCT PORTFOLIO
- TABLE 140. IMPEXTRACO N.V.: KEY EXECUTIVES
- TABLE 141. IMPEXTRACO N.V.: COMPANY SNAPSHOT
- TABLE 142. IMPEXTRACO N.V.: PRODUCT SEGMENTS
- TABLE 143. IMPEXTRACO N.V.: PRODUCT PORTFOLIO
- TABLE 144. IMPEXTRACO N.V.: KEY STRATERGIES
- TABLE 145. KEMIN INDUSTRIES, INC. : KEY EXECUTIVES
- TABLE 146. KEMIN INDUSTRIES, INC. : COMPANY SNAPSHOT
- TABLE 147. KEMIN INDUSTRIES, INC. : PRODUCT SEGMENTS
- TABLE 148. KEMIN INDUSTRIES, INC. : PRODUCT PORTFOLIO
- TABLE 149. KEMIN INDUSTRIES, INC. : KEY STRATERGIES
- TABLE 150. NOREL, S.A: KEY EXECUTIVES
- TABLE 151. NOREL, S.A: COMPANY SNAPSHOT
- TABLE 152. NOREL, S.A: PRODUCT SEGMENTS
- TABLE 153. NOREL, S.A: PRODUCT PORTFOLIO
- TABLE 154. SVH HOLDING N.V.: KEY EXECUTIVES
- TABLE 155. SVH HOLDING N.V.: COMPANY SNAPSHOT
- TABLE 156. SVH HOLDING N.V.: PRODUCT SEGMENTS
- TABLE 157. SVH HOLDING N.V.: SERVICE SEGMENTS
- TABLE 158. SVH HOLDING N.V.: PRODUCT PORTFOLIO
- TABLE 159. SVH HOLDING N.V.: KEY STRATERGIES
- TABLE 160. OLMIX S.A.: KEY EXECUTIVES
- TABLE 161. OLMIX S.A.: COMPANY SNAPSHOT
- TABLE 162. OLMIX S.A.: PRODUCT SEGMENTS
- TABLE 163. OLMIX S.A.: PRODUCT PORTFOLIO
- TABLE 164. OLMIX S.A.: KEY STRATERGIES
- TABLE 165. PERSTORP HOLDING AB: KEY EXECUTIVES
- TABLE 166. PERSTORP HOLDING AB: COMPANY SNAPSHOT
- TABLE 167. PERSTORP HOLDING AB: PRODUCT SEGMENTS
- TABLE 168. PERSTORP HOLDING AB: PRODUCT PORTFOLIO
- TABLE 169. PERSTORP HOLDING AB: KEY STRATERGIES
- TABLE 170. SIMFA LABS PVT. LTD.: KEY EXECUTIVES
- TABLE 171. SIMFA LABS PVT. LTD.: COMPANY SNAPSHOT
- TABLE 172. SIMFA LABS PVT. LTD.: PRODUCT SEGMENTS
- TABLE 173. SIMFA LABS PVT. LTD.: PRODUCT PORTFOLIO
- TABLE 174. VIRBAC S.A.: KEY EXECUTIVES
- TABLE 175. VIRBAC S.A.: COMPANY SNAPSHOT
- TABLE 176. VIRBAC S.A.: PRODUCT SEGMENTS
- TABLE 177. VIRBAC S.A.: PRODUCT PORTFOLIO
LIST OF FIGURES
- FIGURE 01. FEED MYCOTOXIN BINDERS MARKET, 2021-2031
- FIGURE 02. SEGMENTATION OF FEED MYCOTOXIN BINDERS MARKET, 2021-2031
- FIGURE 03. TOP INVESTMENT POCKETS IN FEED MYCOTOXIN BINDERS MARKET (2022-2031)
- FIGURE 04. LOW BARGAINING POWER OF SUPPLIERS
- FIGURE 05. LOW BARGAINING POWER OF BUYERS
- FIGURE 06. LOW THREAT OF SUBSTITUTES
- FIGURE 07. LOW THREAT OF NEW ENTRANTS
- FIGURE 08. LOW INTENSITY OF RIVALRY
- FIGURE 09. DRIVERS, RESTRAINTS AND OPPORTUNITIES: GLOBALFEED MYCOTOXIN BINDERS MARKET
- FIGURE 10. FEED MYCOTOXIN BINDERS MARKET, BY LIVESTOCK, 2021(%)
- FIGURE 11. COMPARATIVE SHARE ANALYSIS OF FEED MYCOTOXIN BINDERS MARKET FOR SWINE, BY COUNTRY 2021 AND 2031(%)
- FIGURE 12. COMPARATIVE SHARE ANALYSIS OF FEED MYCOTOXIN BINDERS MARKET FOR RUMINANTS, BY COUNTRY 2021 AND 2031(%)
- FIGURE 13. COMPARATIVE SHARE ANALYSIS OF FEED MYCOTOXIN BINDERS MARKET FOR POULTRY, BY COUNTRY 2021 AND 2031(%)
- FIGURE 14. COMPARATIVE SHARE ANALYSIS OF FEED MYCOTOXIN BINDERS MARKET FOR AQUATIC ANIMALS, BY COUNTRY 2021 AND 2031(%)
- FIGURE 15. COMPARATIVE SHARE ANALYSIS OF FEED MYCOTOXIN BINDERS MARKET FOR OTHERS, BY COUNTRY 2021 AND 2031(%)
- FIGURE 16. FEED MYCOTOXIN BINDERS MARKET, BY SOURCE, 2021(%)
- FIGURE 17. COMPARATIVE SHARE ANALYSIS OF FEED MYCOTOXIN BINDERS MARKET FOR ORGANIC, BY COUNTRY 2021 AND 2031(%)
- FIGURE 18. COMPARATIVE SHARE ANALYSIS OF FEED MYCOTOXIN BINDERS MARKET FOR CONVENTIONAL, BY COUNTRY 2021 AND 2031(%)
- FIGURE 19. FEED MYCOTOXIN BINDERS MARKET, BY FORM, 2021(%)
- FIGURE 20. COMPARATIVE SHARE ANALYSIS OF FEED MYCOTOXIN BINDERS MARKET FOR DRY, BY COUNTRY 2021 AND 2031(%)
- FIGURE 21. COMPARATIVE SHARE ANALYSIS OF FEED MYCOTOXIN BINDERS MARKET FOR LIQUID, BY COUNTRY 2021 AND 2031(%)
- FIGURE 22. COMPARATIVE SHARE ANALYSIS OF FEED MYCOTOXIN BINDERS MARKET FOR OTHERS, BY COUNTRY 2021 AND 2031(%)
- FIGURE 23. FEED MYCOTOXIN BINDERS MARKET BY REGION, 2021
- FIGURE 24. U.S. FEED MYCOTOXIN BINDERS MARKET, 2021-2031 ($MILLION)
- FIGURE 25. CANADA FEED MYCOTOXIN BINDERS MARKET, 2021-2031 ($MILLION)
- FIGURE 26. MEXICO FEED MYCOTOXIN BINDERS MARKET, 2021-2031 ($MILLION)
- FIGURE 27. GERMANY FEED MYCOTOXIN BINDERS MARKET, 2021-2031 ($MILLION)
- FIGURE 28. UK FEED MYCOTOXIN BINDERS MARKET, 2021-2031 ($MILLION)
- FIGURE 29. ITALY FEED MYCOTOXIN BINDERS MARKET, 2021-2031 ($MILLION)
- FIGURE 30. FRANCE FEED MYCOTOXIN BINDERS MARKET, 2021-2031 ($MILLION)
- FIGURE 31. SPAIN FEED MYCOTOXIN BINDERS MARKET, 2021-2031 ($MILLION)
- FIGURE 32. RUSSIA FEED MYCOTOXIN BINDERS MARKET, 2021-2031 ($MILLION)
- FIGURE 33. REST OF EUROPE FEED MYCOTOXIN BINDERS MARKET, 2021-2031 ($MILLION)
- FIGURE 34. CHINA FEED MYCOTOXIN BINDERS MARKET, 2021-2031 ($MILLION)
- FIGURE 35. JAPAN FEED MYCOTOXIN BINDERS MARKET, 2021-2031 ($MILLION)
- FIGURE 36. INDIA FEED MYCOTOXIN BINDERS MARKET, 2021-2031 ($MILLION)
- FIGURE 37. SOUTH KOREA FEED MYCOTOXIN BINDERS MARKET, 2021-2031 ($MILLION)
- FIGURE 38. AUSTRALIA FEED MYCOTOXIN BINDERS MARKET, 2021-2031 ($MILLION)
- FIGURE 39. SINGAPORE FEED MYCOTOXIN BINDERS MARKET, 2021-2031 ($MILLION)
- FIGURE 40. NEW ZEALAND FEED MYCOTOXIN BINDERS MARKET, 2021-2031 ($MILLION)
- FIGURE 41. REST OF ASIA-PACIFIC FEED MYCOTOXIN BINDERS MARKET, 2021-2031 ($MILLION)
- FIGURE 42. BRAZIL FEED MYCOTOXIN BINDERS MARKET, 2021-2031 ($MILLION)
- FIGURE 43. ARGENTINA FEED MYCOTOXIN BINDERS MARKET, 2021-2031 ($MILLION)
- FIGURE 44. SOUTH AFRICA FEED MYCOTOXIN BINDERS MARKET, 2021-2031 ($MILLION)
- FIGURE 45. UNITED ARAB EMIRATES FEED MYCOTOXIN BINDERS MARKET, 2021-2031 ($MILLION)
- FIGURE 46. REST OF LAMEA FEED MYCOTOXIN BINDERS MARKET, 2021-2031 ($MILLION)
- FIGURE 47. TOP WINNING STRATEGIES, BY YEAR
- FIGURE 48. TOP WINNING STRATEGIES, BY DEVELOPMENT
- FIGURE 49. TOP WINNING STRATEGIES, BY COMPANY
- FIGURE 50. PRODUCT MAPPING OF TOP 10 PLAYERS
- FIGURE 51. COMPETITIVE DASHBOARD
- FIGURE 52. COMPETITIVE HEATMAP: FEED MYCOTOXIN BINDERS MARKET
- FIGURE 53. TOP PLAYER POSITIONING, 2021
- FIGURE 54. BASF SE: NET SALES, 2020-2022 ($MILLION)
- FIGURE 55. BASF SE: REVENUE SHARE BY SEGMENT, 2022 (%)
- FIGURE 56. BASF SE: REVENUE SHARE BY REGION, 2022 (%)
- FIGURE 57. CARGILL, INCORPORATED: NET SALES, 2019-2021 ($MILLION)
- FIGURE 58. CLARIANT LTD.: NET SALES, 2019-2021 ($MILLION)
- FIGURE 59. CLARIANT LTD.: RESEARCH & DEVELOPMENT EXPENDITURE, 2019-2021
- FIGURE 60. CLARIANT LTD.: REVENUE SHARE BY SEGMENT, 2021 (%)
- FIGURE 61. KONINKLIJKE DSM N.V.: NET SALES, 2019-2021 ($MILLION)
- FIGURE 62. KONINKLIJKE DSM N.V.: RESEARCH & DEVELOPMENT EXPENDITURE, 2019-2021
- FIGURE 63. KONINKLIJKE DSM N.V.: REVENUE SHARE BY SEGMENT, 2021 (%)
- FIGURE 64. SVH HOLDING N.V.: NET SALES, 2019-2021 ($MILLION)
- FIGURE 65. PERSTORP HOLDING AB: NET SALES, 2019-2021 ($MILLION)
- FIGURE 66. PERSTORP HOLDING AB: RESEARCH & DEVELOPMENT EXPENDITURE, 2019-2021
- FIGURE 67. PERSTORP HOLDING AB: REVENUE SHARE BY REGION, 2021 (%)
- FIGURE 68. VIRBAC S.A.: NET SALES, 2019-2021 ($MILLION)
According to a new report published by Allied Market Research, titled, "Feed Mycotoxin Binders Market," The feed mycotoxin binders market was valued at $144.60 million in 2021, and is estimated to reach $393.9 million by 2031, growing at a CAGR of 10.2% from 2022 to 2031.
Mycotoxins are secondary metabolites produced by molds and fungi in fields and during storage of grains, feeds and forages. Mycotoxins are considered to be soil-borne pathogens. Not all molds and fungi will produce mycotoxins. Mycotoxins majorly occurs in isolation. Given the fact that one mold is capable of producing several mycotoxins, several molds can contaminate one feed ingredient. With several ingredients included in an animal feed, it's very common to find multiple mycotoxins in finished feeds. This allows for interactions among mycotoxins, resulting in synergistic or additive effects on the animal.
The feed mycotoxin binders industry is currently driven by increasing demand for dairy products, increasing demand for meat and meat products, rising population, and growth of the livestock industry. Furthermore, increasing demand for organically grown livestock will propel the demand for feed mycotoxin binders market. Feed mycotoxin binders are used in animal feed to reduce the effects associated with mycotoxins. Some major type of mycotoxins found in feed are aflatoxins (B1, B2, G1, G2 and M1), ochratoxin A, patulin toxins produced by Fusarium moulds, including fumonisins (B1, B2 and B3), trichothecenes (principally nivalenol, deoxynivalenol, T-2 and HT-2 toxin), zearalenone, ergot alkaloids, citrinin, sterigmatocystin and alternaria toxins. Among these, aflatoxins are most harmful type of mycotoxins and can cause different health realated concerns including gastrointestinal disturbances, reproductive disorders or suppression of the immune system. Asia-Pacific market is estimated to witness steady growth owing to the presence of major market players.
Poultry industry is under constant threat due to presence of mycotoxins in poultry feed. Feed ingredients that are used in the poultry feed manufacturin9eg can be contaminated by harmful mycotoxins that can be indigested by poultry birds which can lead to serious damage. Some fungi produce mycotoxins during agriculture harvesting, while other fungi produce mycotoxins during the storage of grains. The most common poultry feed ingredients damaged by mycotoxins consists of soymeal, barley, corn & corn by products, and wheat & wheat by products, among others. Poultry birds are very sensitive to mycotoxins. It can cause increased organ size, liver damage, neurological effects, decreased fertility, feed refusal, among others. It can be prevented by the introduction of mycotoxin binders in feed. Thus, propelling the demand for feed mycotoxin binders in poultry feed.
However, stringent government regulations associated with product approval are likely to hamper the market growth. For instance, in European Union (EU) substances for reduction of the contamination of feed by mycotoxins are classified within the technological feed additives category. This group of products must be registered following the rules described in Regulation EC 1831/2003, which lays out the procedure for the registration of feed additives.
The demand for organic feed among growers will create an opportunity among feed mycotoxin binders manufacturers. The growing demand for organic food products owing to the rising consumer awareness regarding the consumption of these food products along with the availability of healthy food options from various manufacturers is encouraging the livestock growers to adopt the use of organic ingredients in animal feed.
The global feed mycotoxin binders market is segmented into livestock, source, form, and region. On the basis of livestock, the market is categorized into swine, ruminants, poultry, aquatic animals, and others. By source, it is fragmented into conventional and organic. Depending on form, it is segregated into dry, liquid, and others. Region wise, it is analyzed across North America (the U.S., Canada, and Mexico), Europe (Germany, France, UK, Italy, Spain, Russia, and rest of Europe), Asia-Pacific (China, Japan, India, South Korea, Australia, Singapore, New Zealand, and rest of Asia-Pacific), and LAMEA (Brazil, Argentina, Saudi Arabia, South Africa, UAE, and rest of LAMEA).
The key market players included in the feed mycotoxin binders market analysis are Alltech, Inc., BASF SE, Bentoli, Inc., BERTOL COMPANY s.r.o, Cargill, Incorporated, Clariant Ltd, Koninklijke DSM N.V., EW Nutrition GmbH, GLOBAL NUTRITECH, Impextraco N.V., Norel, S.A, SVH Holding N.V., Olmix S.A., Perstorp Holding AB, Simfa Labs Pvt. Ltd., Virbac S.A., and Kemin Industries, Inc.
Key Benefits For Stakeholders
- This report provides a quantitative analysis of the market segments, current trends, estimations, and dynamics of the feed mycotoxin binders market analysis from 2021 to 2031 to identify the prevailing feed mycotoxin binders market opportunities.
- The market research is offered along with information related to key drivers, restraints, and opportunities.
- Porter's five forces analysis highlights the potency of buyers and suppliers to enable stakeholders make profit-oriented business decisions and strengthen their supplier-buyer network.
- In-depth analysis of the feed mycotoxin binders market segmentation assists to determine the prevailing market opportunities.
- Major countries in each region are mapped according to their revenue contribution to the global market.
- Market player positioning facilitates benchmarking and provides a clear understanding of the present position of the market players.
- The report includes the analysis of the regional as well as global feed mycotoxin binders market trends, key players, market segments, application areas, and market growth strategies.
Key Market Segments
By Livestock
- Swine
- Ruminants
- Poultry
- Aquatic animals
- Others
By Source
- Organic
- Conventional
By Form
- Dry
- Liquid
- Others
By Region
- North America
- U.S.
- Canada
- Mexico
- Europe
- Germany
- UK
- Italy
- France
- Spain
- Russia
- Rest Of Europe
- Asia-Pacific
- China
- Japan
- India
- South Korea
- Australia
- Singapore
- New Zealand
- Rest Of Asia-Pacific
- LAMEA
- Brazil
- Argentina
- South Africa
- United Arab Emirates
- Rest Of LAMEA
Key Market Players:
- Bertol Company s.r.o.
- Norel, S.A
- BASF SE
- Cargill, Incorporated
- Perstorp Holding AB
- Clariant Ltd.
- Alltech, Inc.
- EW Nutrition GmbH
- GLOBAL NUTRITECH
- Olmix S.A.
- Simfa Labs Pvt. Ltd.
- Impextraco N.V.
- Kemin Industries, Inc.
- Virbac S.A.
- Koninklijke DSM N.V.
- SVH Holding N.V.
- Bentoli, Inc.
TABLE OF CONTENTS
CHAPTER 1: INTRODUCTION
- 1.1. Report description
- 1.2. Key market segments
- 1.3. Key benefits to the stakeholders
- 1.4. Research Methodology
- 1.4.1. Primary research
- 1.4.2. Secondary research
- 1.4.3. Analyst tools and models
CHAPTER 2: EXECUTIVE SUMMARY
- 2.1. CXO Perspective
CHAPTER 3: MARKET OVERVIEW
- 3.1. Market definition and scope
- 3.2. Key findings
- 3.2.1. Top impacting factors
- 3.2.2. Top investment pockets
- 3.3. Porter's five forces analysis
- 3.3.1. Bargaining power of suppliers
- 3.3.2. Bargaining power of buyers
- 3.3.3. Threat of substitutes
- 3.3.4. Threat of new entrants
- 3.3.5. Intensity of rivalry
- 3.4. Market dynamics
- 3.4.1. Drivers
- 3.4.1.1. Increase In Meat Production And Consumption
- 3.4.1.2. Standardization Of Meat Products Due To Disease Outbreaks
- 3.4.1.3. Rise In Effect Of Mycotoxin Over Animal Health
- 3.4.1. Drivers
- 3.4.2. Restraints
- 3.4.2.1. Rise In Raw Material Cost
- 3.4.2.2. Stringent Regulations And International Quality Standards
- 3.4.3. Opportunities
- 3.4.3.1. Rise In Demand For Organic
- 3.4.3.2. Expansion Of E-Commerce
- 3.5. COVID-19 Impact Analysis on the market
CHAPTER 4: FEED MYCOTOXIN BINDERS MARKET, BY LIVESTOCK
- 4.1. Overview
- 4.1.1. Market size and forecast
- 4.2. Swine
- 4.2.1. Key market trends, growth factors and opportunities
- 4.2.2. Market size and forecast, by region
- 4.2.3. Market share analysis by country
- 4.3. Ruminants
- 4.3.1. Key market trends, growth factors and opportunities
- 4.3.2. Market size and forecast, by region
- 4.3.3. Market share analysis by country
- 4.4. Poultry
- 4.4.1. Key market trends, growth factors and opportunities
- 4.4.2. Market size and forecast, by region
- 4.4.3. Market share analysis by country
- 4.5. Aquatic animals
- 4.5.1. Key market trends, growth factors and opportunities
- 4.5.2. Market size and forecast, by region
- 4.5.3. Market share analysis by country
- 4.6. Others
- 4.6.1. Key market trends, growth factors and opportunities
- 4.6.2. Market size and forecast, by region
- 4.6.3. Market share analysis by country
CHAPTER 5: FEED MYCOTOXIN BINDERS MARKET, BY SOURCE
- 5.1. Overview
- 5.1.1. Market size and forecast
- 5.2. Organic
- 5.2.1. Key market trends, growth factors and opportunities
- 5.2.2. Market size and forecast, by region
- 5.2.3. Market share analysis by country
- 5.3. Conventional
- 5.3.1. Key market trends, growth factors and opportunities
- 5.3.2. Market size and forecast, by region
- 5.3.3. Market share analysis by country
CHAPTER 6: FEED MYCOTOXIN BINDERS MARKET, BY FORM
- 6.1. Overview
- 6.1.1. Market size and forecast
- 6.2. Dry
- 6.2.1. Key market trends, growth factors and opportunities
- 6.2.2. Market size and forecast, by region
- 6.2.3. Market share analysis by country
- 6.3. Liquid
- 6.3.1. Key market trends, growth factors and opportunities
- 6.3.2. Market size and forecast, by region
- 6.3.3. Market share analysis by country
- 6.4. Others
- 6.4.1. Key market trends, growth factors and opportunities
- 6.4.2. Market size and forecast, by region
- 6.4.3. Market share analysis by country
CHAPTER 7: FEED MYCOTOXIN BINDERS MARKET, BY REGION
- 7.1. Overview
- 7.1.1. Market size and forecast By Region
- 7.2. North America
- 7.2.1. Key trends and opportunities
- 7.2.2. Market size and forecast, by Livestock
- 7.2.3. Market size and forecast, by Source
- 7.2.4. Market size and forecast, by Form
- 7.2.5. Market size and forecast, by country
- 7.2.5.1. U.S.
- 7.2.5.1.1. Key market trends, growth factors and opportunities
- 7.2.5.1.2. Market size and forecast, by Livestock
- 7.2.5.1.3. Market size and forecast, by Source
- 7.2.5.1.4. Market size and forecast, by Form
- 7.2.5.2. Canada
- 7.2.5.2.1. Key market trends, growth factors and opportunities
- 7.2.5.2.2. Market size and forecast, by Livestock
- 7.2.5.2.3. Market size and forecast, by Source
- 7.2.5.2.4. Market size and forecast, by Form
- 7.2.5.3. Mexico
- 7.2.5.3.1. Key market trends, growth factors and opportunities
- 7.2.5.3.2. Market size and forecast, by Livestock
- 7.2.5.3.3. Market size and forecast, by Source
- 7.2.5.3.4. Market size and forecast, by Form
- 7.3. Europe
- 7.3.1. Key trends and opportunities
- 7.3.2. Market size and forecast, by Livestock
- 7.3.3. Market size and forecast, by Source
- 7.3.4. Market size and forecast, by Form
- 7.3.5. Market size and forecast, by country
- 7.3.5.1. Germany
- 7.3.5.1.1. Key market trends, growth factors and opportunities
- 7.3.5.1.2. Market size and forecast, by Livestock
- 7.3.5.1.3. Market size and forecast, by Source
- 7.3.5.1.4. Market size and forecast, by Form
- 7.3.5.2. UK
- 7.3.5.2.1. Key market trends, growth factors and opportunities
- 7.3.5.2.2. Market size and forecast, by Livestock
- 7.3.5.2.3. Market size and forecast, by Source
- 7.3.5.2.4. Market size and forecast, by Form
- 7.3.5.3. Italy
- 7.3.5.3.1. Key market trends, growth factors and opportunities
- 7.3.5.3.2. Market size and forecast, by Livestock
- 7.3.5.3.3. Market size and forecast, by Source
- 7.3.5.3.4. Market size and forecast, by Form
- 7.3.5.4. France
- 7.3.5.4.1. Key market trends, growth factors and opportunities
- 7.3.5.4.2. Market size and forecast, by Livestock
- 7.3.5.4.3. Market size and forecast, by Source
- 7.3.5.4.4. Market size and forecast, by Form
- 7.3.5.5. Spain
- 7.3.5.5.1. Key market trends, growth factors and opportunities
- 7.3.5.5.2. Market size and forecast, by Livestock
- 7.3.5.5.3. Market size and forecast, by Source
- 7.3.5.5.4. Market size and forecast, by Form
- 7.3.5.6. Russia
- 7.3.5.6.1. Key market trends, growth factors and opportunities
- 7.3.5.6.2. Market size and forecast, by Livestock
- 7.3.5.6.3. Market size and forecast, by Source
- 7.3.5.6.4. Market size and forecast, by Form
- 7.3.5.7. Rest of Europe
- 7.3.5.7.1. Key market trends, growth factors and opportunities
- 7.3.5.7.2. Market size and forecast, by Livestock
- 7.3.5.7.3. Market size and forecast, by Source
- 7.3.5.7.4. Market size and forecast, by Form
- 7.4. Asia-Pacific
- 7.4.1. Key trends and opportunities
- 7.4.2. Market size and forecast, by Livestock
- 7.4.3. Market size and forecast, by Source
- 7.4.4. Market size and forecast, by Form
- 7.4.5. Market size and forecast, by country
- 7.4.5.1. China
- 7.4.5.1.1. Key market trends, growth factors and opportunities
- 7.4.5.1.2. Market size and forecast, by Livestock
- 7.4.5.1.3. Market size and forecast, by Source
- 7.4.5.1.4. Market size and forecast, by Form
- 7.4.5.2. Japan
- 7.4.5.2.1. Key market trends, growth factors and opportunities
- 7.4.5.2.2. Market size and forecast, by Livestock
- 7.4.5.2.3. Market size and forecast, by Source
- 7.4.5.2.4. Market size and forecast, by Form
- 7.4.5.3. India
- 7.4.5.3.1. Key market trends, growth factors and opportunities
- 7.4.5.3.2. Market size and forecast, by Livestock
- 7.4.5.3.3. Market size and forecast, by Source
- 7.4.5.3.4. Market size and forecast, by Form
- 7.4.5.4. South Korea
- 7.4.5.4.1. Key market trends, growth factors and opportunities
- 7.4.5.4.2. Market size and forecast, by Livestock
- 7.4.5.4.3. Market size and forecast, by Source
- 7.4.5.4.4. Market size and forecast, by Form
- 7.4.5.5. Australia
- 7.4.5.5.1. Key market trends, growth factors and opportunities
- 7.4.5.5.2. Market size and forecast, by Livestock
- 7.4.5.5.3. Market size and forecast, by Source
- 7.4.5.5.4. Market size and forecast, by Form
- 7.4.5.6. Singapore
- 7.4.5.6.1. Key market trends, growth factors and opportunities
- 7.4.5.6.2. Market size and forecast, by Livestock
- 7.4.5.6.3. Market size and forecast, by Source
- 7.4.5.6.4. Market size and forecast, by Form
- 7.4.5.7. New Zealand
- 7.4.5.7.1. Key market trends, growth factors and opportunities
- 7.4.5.7.2. Market size and forecast, by Livestock
- 7.4.5.7.3. Market size and forecast, by Source
- 7.4.5.7.4. Market size and forecast, by Form
- 7.4.5.8. Rest of Asia-Pacific
- 7.4.5.8.1. Key market trends, growth factors and opportunities
- 7.4.5.8.2. Market size and forecast, by Livestock
- 7.4.5.8.3. Market size and forecast, by Source
- 7.4.5.8.4. Market size and forecast, by Form
- 7.5. LAMEA
- 7.5.1. Key trends and opportunities
- 7.5.2. Market size and forecast, by Livestock
- 7.5.3. Market size and forecast, by Source
- 7.5.4. Market size and forecast, by Form
- 7.5.5. Market size and forecast, by country
- 7.5.5.1. Brazil
- 7.5.5.1.1. Key market trends, growth factors and opportunities
- 7.5.5.1.2. Market size and forecast, by Livestock
- 7.5.5.1.3. Market size and forecast, by Source
- 7.5.5.1.4. Market size and forecast, by Form
- 7.5.5.2. Argentina
- 7.5.5.2.1. Key market trends, growth factors and opportunities
- 7.5.5.2.2. Market size and forecast, by Livestock
- 7.5.5.2.3. Market size and forecast, by Source
- 7.5.5.2.4. Market size and forecast, by Form
- 7.5.5.3. South Africa
- 7.5.5.3.1. Key market trends, growth factors and opportunities
- 7.5.5.3.2. Market size and forecast, by Livestock
- 7.5.5.3.3. Market size and forecast, by Source
- 7.5.5.3.4. Market size and forecast, by Form
- 7.5.5.4. United Arab Emirates
- 7.5.5.4.1. Key market trends, growth factors and opportunities
- 7.5.5.4.2. Market size and forecast, by Livestock
- 7.5.5.4.3. Market size and forecast, by Source
- 7.5.5.4.4. Market size and forecast, by Form
- 7.5.5.5. Rest of LAMEA
- 7.5.5.5.1. Key market trends, growth factors and opportunities
- 7.5.5.5.2. Market size and forecast, by Livestock
- 7.5.5.5.3. Market size and forecast, by Source
- 7.5.5.5.4. Market size and forecast, by Form
CHAPTER 8: COMPETITIVE LANDSCAPE
- 8.1. Introduction
- 8.2. Top winning strategies
- 8.3. Product Mapping of Top 10 Player
- 8.4. Competitive Dashboard
- 8.5. Competitive Heatmap
- 8.6. Top player positioning, 2021
CHAPTER 9: COMPANY PROFILES
- 9.1. Alltech, Inc.
- 9.1.1. Company overview
- 9.1.2. Key Executives
- 9.1.3. Company snapshot
- 9.1.4. Operating business segments
- 9.1.5. Product portfolio
- 9.2. BASF SE
- 9.2.1. Company overview
- 9.2.2. Key Executives
- 9.2.3. Company snapshot
- 9.2.4. Operating business segments
- 9.2.5. Product portfolio
- 9.2.6. Business performance
- 9.2.7. Key strategic moves and developments
- 9.3. Bentoli, Inc.
- 9.3.1. Company overview
- 9.3.2. Key Executives
- 9.3.3. Company snapshot
- 9.3.4. Operating business segments
- 9.3.5. Product portfolio
- 9.4. Bertol Company s.r.o.
- 9.4.1. Company overview
- 9.4.2. Key Executives
- 9.4.3. Company snapshot
- 9.4.4. Operating business segments
- 9.4.5. Product portfolio
- 9.5. Cargill, Incorporated
- 9.5.1. Company overview
- 9.5.2. Key Executives
- 9.5.3. Company snapshot
- 9.5.4. Operating business segments
- 9.5.5. Product portfolio
- 9.5.6. Business performance
- 9.5.7. Key strategic moves and developments
- 9.6. Clariant Ltd.
- 9.6.1. Company overview
- 9.6.2. Key Executives
- 9.6.3. Company snapshot
- 9.6.4. Operating business segments
- 9.6.5. Product portfolio
- 9.6.6. Business performance
- 9.7. Koninklijke DSM N.V.
- 9.7.1. Company overview
- 9.7.2. Key Executives
- 9.7.3. Company snapshot
- 9.7.4. Operating business segments
- 9.7.5. Product portfolio
- 9.7.6. Business performance
- 9.7.7. Key strategic moves and developments
- 9.8. EW Nutrition GmbH
- 9.8.1. Company overview
- 9.8.2. Key Executives
- 9.8.3. Company snapshot
- 9.8.4. Operating business segments
- 9.8.5. Product portfolio
- 9.8.6. Key strategic moves and developments
- 9.9. GLOBAL NUTRITECH
- 9.9.1. Company overview
- 9.9.2. Key Executives
- 9.9.3. Company snapshot
- 9.9.4. Operating business segments
- 9.9.5. Product portfolio
- 9.10. Impextraco N.V.
- 9.10.1. Company overview
- 9.10.2. Key Executives
- 9.10.3. Company snapshot
- 9.10.4. Operating business segments
- 9.10.5. Product portfolio
- 9.10.6. Key strategic moves and developments
- 9.11. Kemin Industries, Inc.
- 9.11.1. Company overview
- 9.11.2. Key Executives
- 9.11.3. Company snapshot
- 9.11.4. Operating business segments
- 9.11.5. Product portfolio
- 9.11.6. Key strategic moves and developments
- 9.12. Norel, S.A
- 9.12.1. Company overview
- 9.12.2. Key Executives
- 9.12.3. Company snapshot
- 9.12.4. Operating business segments
- 9.12.5. Product portfolio
- 9.13. SVH Holding N.V.
- 9.13.1. Company overview
- 9.13.2. Key Executives
- 9.13.3. Company snapshot
- 9.13.4. Operating business segments
- 9.13.5. Product portfolio
- 9.13.6. Business performance
- 9.13.7. Key strategic moves and developments
- 9.14. Olmix S.A.
- 9.14.1. Company overview
- 9.14.2. Key Executives
- 9.14.3. Company snapshot
- 9.14.4. Operating business segments
- 9.14.5. Product portfolio
- 9.14.6. Key strategic moves and developments
- 9.15. Perstorp Holding AB
- 9.15.1. Company overview
- 9.15.2. Key Executives
- 9.15.3. Company snapshot
- 9.15.4. Operating business segments
- 9.15.5. Product portfolio
- 9.15.6. Business performance
- 9.15.7. Key strategic moves and developments
- 9.16. Simfa Labs Pvt. Ltd.
- 9.16.1. Company overview
- 9.16.2. Key Executives
- 9.16.3. Company snapshot
- 9.16.4. Operating business segments
- 9.16.5. Product portfolio
- 9.17. Virbac S.A.
- 9.17.1. Company overview
- 9.17.2. Key Executives
- 9.17.3. Company snapshot
- 9.17.4. Operating business segments
- 9.17.5. Product portfolio
- 9.17.6. Business performance