
|
市場調査レポート
商品コード
1344380
皮むきトマト缶(ピールトマト缶)市場:タイプ別、エンドユーザー別、販売チャネル別:世界の機会分析と産業予測、2023-2032年Canned Peeled Tomatoes Market By Type, By End User, By Sales Channel : Global Opportunity Analysis and Industry Forecast, 2023-2032 |
||||||
|
|||||||

| 皮むきトマト缶(ピールトマト缶)市場:タイプ別、エンドユーザー別、販売チャネル別:世界の機会分析と産業予測、2023-2032年 |
|
出版日: 2023年06月01日
発行: Allied Market Research
ページ情報: 英文 320 Pages
納期: 2~3営業日
|

- 全表示
- 概要
- 図表
- 目次
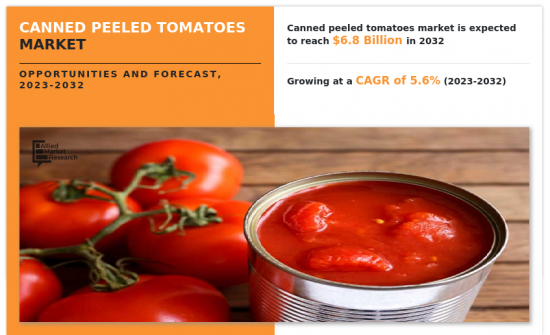
皮むきトマト缶(ピールトマト缶)市場は2022年に40億米ドルと評価され、2023年から2032年までのCAGRは5.6%で成長し、2032年には68億米ドルに達すると推定されます。
皮むきトマト缶は、風味、栄養、彩りを加えるために様々なレシピに使用できる万能食材です。トマト缶は、スープやシチューからキャセロールやパスタソースに至るまで、様々なレシピに使用でき、風味、栄養、彩りを加える万能食材です。トマト缶は、ビタミンA、C、カリウム、食物繊維の優れた供給源でもあり、どんな食事にもヘルシーに加わります。
皮むきトマト缶は、パスタソース、スープ、シチュー、カレーなど、さまざまなレシピの下ごしらえ時間を大幅に短縮します。トマト缶を使うことで、消費者は生のトマトの皮をむいたり、種を取ったりする手間を省くことができます。この時間節約要素は、特に調理時間が限られている平日に、効率的に食事を準備したい消費者にアピールします。メーカーは、トマト缶のさまざまな料理への応用を紹介する新しい革新的なレシピを開発することで、この汎用性を活用することができます。同時に、シェフや料理の専門家と協力して、消費者がさまざまな料理や調理法を試してみたくなるようなレシピのアイデアや料理のチュートリアルを作成することもできます。さらに、トマト缶メーカーは、エスニック料理や郷土料理の増加傾向に対応するため、これらの料理向けに特別に調合されたトマト缶を提供することができます。これには、さまざまな地域の消費者のさまざまな料理嗜好に合うよう、スパイスや味付けをした製品も含まれます。
食品廃棄は世界の関心事となっており、消費者は廃棄物を最小限に抑え、持続可能な選択をすることをますます意識するようになっています。皮むきトマト缶は、生のトマトに比べて保存期間が長いため、腐敗の可能性が低く、その結果、食品廃棄が減少します。この点が、環境意識の高い消費者の間でトマト缶の需要を押し上げています。さらにメーカー各社は、賞味期限の延長と食品廃棄の削減を強調することで、トマト缶の持続可能性の側面を強調しています。さらに、環境に優しい包装材料を組み込んで、持続可能な実践への取り組みを伝え、環境への責任を優先する消費者にアピールすることができます。
目次
第1章 イントロダクション
第2章 エグゼクティブサマリー
第3章 市場概要
- 市場の定義と範囲
- 主な調査結果
- 影響要因
- 主な投資機会
- ポーターのファイブフォース分析
- 供給企業の交渉力
- 買い手の交渉力
- 代替品の脅威
- 新規参入業者の脅威
- 競合の激しさ
- 市場力学
- 促進要因
- RTE製品の人気上昇
- 皮むきトマト缶の汎用性
- 加工食品需要の増加
- 抑制要因
- トマトの価格変動
- 競合課題
- 機会
- 製品提供の革新
- 促進要因
- COVID-19:市場への影響分析
第4章 皮むきトマト缶市場:タイプ別
- 概要
- ホールトマト
- ダイストマト
- クラッシュトマト
- ピューレトマト
- その他
第5章 皮むきトマト缶市場:エンドユーザー別
- 概要
- 住宅
- 商業
第6章 皮むきトマト缶市場:販売チャネル別
- 概要
- オンライン
- オフライン
第7章 皮むきトマト缶市場:地域別
- 概要
- 北米
- 米国
- カナダ
- メキシコ
- 欧州
- ドイツ
- フランス
- イタリア
- スペイン
- 英国
- ロシア
- その他欧州
- アジア太平洋
- 中国
- 日本
- インド
- 韓国
- オーストラリア
- タイ
- マレーシア
- インドネシア
- その他アジア太平洋地域
- ラテンアメリカ・中東・アフリカ
- ブラジル
- 南アフリカ
- サウジアラビア
- アラブ首長国連邦
- アルゼンチン
- その他ラテンアメリカ・中東・アフリカ
第8章 競合情勢
- イントロダクション
- 主要成功戦略
- 主要10社の製品マッピング
- 競合ダッシュボード
- 競合ヒートマップ
- 主要企業のポジショニング、2022年
第9章 企業プロファイル
- Del Monte Pacific Limited
- La Doria S.p.A.
- The Kraft Heinz Company
- Cento Fine Foods, Inc.
- B&G Foods, Inc.
- The Pastene Companies, Ltd.
- Bianco DiNapoli
- Conagra Brands, Inc.
- General Mills, Inc.
- Mutti S.p.A.
LIST OF TABLES
- TABLE 01. GLOBAL CANNED PEELED TOMATOES MARKET, BY TYPE, 2022-2032 ($MILLION)
- TABLE 02. CANNED PEELED TOMATOES MARKET FOR WHOLE PEELED TOMATOES, BY REGION, 2022-2032 ($MILLION)
- TABLE 03. CANNED PEELED TOMATOES MARKET FOR DICED TOMATOES, BY REGION, 2022-2032 ($MILLION)
- TABLE 04. CANNED PEELED TOMATOES MARKET FOR CRUSHED TOMATOES, BY REGION, 2022-2032 ($MILLION)
- TABLE 05. CANNED PEELED TOMATOES MARKET FOR PUREED TOMATOES, BY REGION, 2022-2032 ($MILLION)
- TABLE 06. CANNED PEELED TOMATOES MARKET FOR OTHERS, BY REGION, 2022-2032 ($MILLION)
- TABLE 07. GLOBAL CANNED PEELED TOMATOES MARKET, BY END USER, 2022-2032 ($MILLION)
- TABLE 08. CANNED PEELED TOMATOES MARKET FOR RESIDENTIAL, BY REGION, 2022-2032 ($MILLION)
- TABLE 09. CANNED PEELED TOMATOES MARKET FOR COMMERCIAL, BY REGION, 2022-2032 ($MILLION)
- TABLE 10. GLOBAL CANNED PEELED TOMATOES MARKET, BY SALES CHANNEL, 2022-2032 ($MILLION)
- TABLE 11. CANNED PEELED TOMATOES MARKET FOR ONLINE, BY REGION, 2022-2032 ($MILLION)
- TABLE 12. CANNED PEELED TOMATOES MARKET FOR OFFLINE, BY REGION, 2022-2032 ($MILLION)
- TABLE 13. CANNED PEELED TOMATOES MARKET, BY REGION, 2022-2032 ($MILLION)
- TABLE 14. NORTH AMERICA CANNED PEELED TOMATOES MARKET, BY TYPE, 2022-2032 ($MILLION)
- TABLE 15. NORTH AMERICA CANNED PEELED TOMATOES MARKET, BY END USER, 2022-2032 ($MILLION)
- TABLE 16. NORTH AMERICA CANNED PEELED TOMATOES MARKET, BY SALES CHANNEL, 2022-2032 ($MILLION)
- TABLE 17. NORTH AMERICA CANNED PEELED TOMATOES MARKET, BY COUNTRY, 2022-2032 ($MILLION)
- TABLE 18. U.S. CANNED PEELED TOMATOES MARKET, BY TYPE, 2022-2032 ($MILLION)
- TABLE 19. U.S. CANNED PEELED TOMATOES MARKET, BY END USER, 2022-2032 ($MILLION)
- TABLE 20. U.S. CANNED PEELED TOMATOES MARKET, BY SALES CHANNEL, 2022-2032 ($MILLION)
- TABLE 21. CANADA CANNED PEELED TOMATOES MARKET, BY TYPE, 2022-2032 ($MILLION)
- TABLE 22. CANADA CANNED PEELED TOMATOES MARKET, BY END USER, 2022-2032 ($MILLION)
- TABLE 23. CANADA CANNED PEELED TOMATOES MARKET, BY SALES CHANNEL, 2022-2032 ($MILLION)
- TABLE 24. MEXICO CANNED PEELED TOMATOES MARKET, BY TYPE, 2022-2032 ($MILLION)
- TABLE 25. MEXICO CANNED PEELED TOMATOES MARKET, BY END USER, 2022-2032 ($MILLION)
- TABLE 26. MEXICO CANNED PEELED TOMATOES MARKET, BY SALES CHANNEL, 2022-2032 ($MILLION)
- TABLE 27. EUROPE CANNED PEELED TOMATOES MARKET, BY TYPE, 2022-2032 ($MILLION)
- TABLE 28. EUROPE CANNED PEELED TOMATOES MARKET, BY END USER, 2022-2032 ($MILLION)
- TABLE 29. EUROPE CANNED PEELED TOMATOES MARKET, BY SALES CHANNEL, 2022-2032 ($MILLION)
- TABLE 30. EUROPE CANNED PEELED TOMATOES MARKET, BY COUNTRY, 2022-2032 ($MILLION)
- TABLE 31. GERMANY CANNED PEELED TOMATOES MARKET, BY TYPE, 2022-2032 ($MILLION)
- TABLE 32. GERMANY CANNED PEELED TOMATOES MARKET, BY END USER, 2022-2032 ($MILLION)
- TABLE 33. GERMANY CANNED PEELED TOMATOES MARKET, BY SALES CHANNEL, 2022-2032 ($MILLION)
- TABLE 34. FRANCE CANNED PEELED TOMATOES MARKET, BY TYPE, 2022-2032 ($MILLION)
- TABLE 35. FRANCE CANNED PEELED TOMATOES MARKET, BY END USER, 2022-2032 ($MILLION)
- TABLE 36. FRANCE CANNED PEELED TOMATOES MARKET, BY SALES CHANNEL, 2022-2032 ($MILLION)
- TABLE 37. ITALY CANNED PEELED TOMATOES MARKET, BY TYPE, 2022-2032 ($MILLION)
- TABLE 38. ITALY CANNED PEELED TOMATOES MARKET, BY END USER, 2022-2032 ($MILLION)
- TABLE 39. ITALY CANNED PEELED TOMATOES MARKET, BY SALES CHANNEL, 2022-2032 ($MILLION)
- TABLE 40. SPAIN CANNED PEELED TOMATOES MARKET, BY TYPE, 2022-2032 ($MILLION)
- TABLE 41. SPAIN CANNED PEELED TOMATOES MARKET, BY END USER, 2022-2032 ($MILLION)
- TABLE 42. SPAIN CANNED PEELED TOMATOES MARKET, BY SALES CHANNEL, 2022-2032 ($MILLION)
- TABLE 43. UK CANNED PEELED TOMATOES MARKET, BY TYPE, 2022-2032 ($MILLION)
- TABLE 44. UK CANNED PEELED TOMATOES MARKET, BY END USER, 2022-2032 ($MILLION)
- TABLE 45. UK CANNED PEELED TOMATOES MARKET, BY SALES CHANNEL, 2022-2032 ($MILLION)
- TABLE 46. RUSSIA CANNED PEELED TOMATOES MARKET, BY TYPE, 2022-2032 ($MILLION)
- TABLE 47. RUSSIA CANNED PEELED TOMATOES MARKET, BY END USER, 2022-2032 ($MILLION)
- TABLE 48. RUSSIA CANNED PEELED TOMATOES MARKET, BY SALES CHANNEL, 2022-2032 ($MILLION)
- TABLE 49. REST OF EUROPE CANNED PEELED TOMATOES MARKET, BY TYPE, 2022-2032 ($MILLION)
- TABLE 50. REST OF EUROPE CANNED PEELED TOMATOES MARKET, BY END USER, 2022-2032 ($MILLION)
- TABLE 51. REST OF EUROPE CANNED PEELED TOMATOES MARKET, BY SALES CHANNEL, 2022-2032 ($MILLION)
- TABLE 52. ASIA-PACIFIC CANNED PEELED TOMATOES MARKET, BY TYPE, 2022-2032 ($MILLION)
- TABLE 53. ASIA-PACIFIC CANNED PEELED TOMATOES MARKET, BY END USER, 2022-2032 ($MILLION)
- TABLE 54. ASIA-PACIFIC CANNED PEELED TOMATOES MARKET, BY SALES CHANNEL, 2022-2032 ($MILLION)
- TABLE 55. ASIA-PACIFIC CANNED PEELED TOMATOES MARKET, BY COUNTRY, 2022-2032 ($MILLION)
- TABLE 56. CHINA CANNED PEELED TOMATOES MARKET, BY TYPE, 2022-2032 ($MILLION)
- TABLE 57. CHINA CANNED PEELED TOMATOES MARKET, BY END USER, 2022-2032 ($MILLION)
- TABLE 58. CHINA CANNED PEELED TOMATOES MARKET, BY SALES CHANNEL, 2022-2032 ($MILLION)
- TABLE 59. JAPAN CANNED PEELED TOMATOES MARKET, BY TYPE, 2022-2032 ($MILLION)
- TABLE 60. JAPAN CANNED PEELED TOMATOES MARKET, BY END USER, 2022-2032 ($MILLION)
- TABLE 61. JAPAN CANNED PEELED TOMATOES MARKET, BY SALES CHANNEL, 2022-2032 ($MILLION)
- TABLE 62. INDIA CANNED PEELED TOMATOES MARKET, BY TYPE, 2022-2032 ($MILLION)
- TABLE 63. INDIA CANNED PEELED TOMATOES MARKET, BY END USER, 2022-2032 ($MILLION)
- TABLE 64. INDIA CANNED PEELED TOMATOES MARKET, BY SALES CHANNEL, 2022-2032 ($MILLION)
- TABLE 65. SOUTH KOREA CANNED PEELED TOMATOES MARKET, BY TYPE, 2022-2032 ($MILLION)
- TABLE 66. SOUTH KOREA CANNED PEELED TOMATOES MARKET, BY END USER, 2022-2032 ($MILLION)
- TABLE 67. SOUTH KOREA CANNED PEELED TOMATOES MARKET, BY SALES CHANNEL, 2022-2032 ($MILLION)
- TABLE 68. AUSTRALIA CANNED PEELED TOMATOES MARKET, BY TYPE, 2022-2032 ($MILLION)
- TABLE 69. AUSTRALIA CANNED PEELED TOMATOES MARKET, BY END USER, 2022-2032 ($MILLION)
- TABLE 70. AUSTRALIA CANNED PEELED TOMATOES MARKET, BY SALES CHANNEL, 2022-2032 ($MILLION)
- TABLE 71. THAILAND CANNED PEELED TOMATOES MARKET, BY TYPE, 2022-2032 ($MILLION)
- TABLE 72. THAILAND CANNED PEELED TOMATOES MARKET, BY END USER, 2022-2032 ($MILLION)
- TABLE 73. THAILAND CANNED PEELED TOMATOES MARKET, BY SALES CHANNEL, 2022-2032 ($MILLION)
- TABLE 74. MALAYSIA CANNED PEELED TOMATOES MARKET, BY TYPE, 2022-2032 ($MILLION)
- TABLE 75. MALAYSIA CANNED PEELED TOMATOES MARKET, BY END USER, 2022-2032 ($MILLION)
- TABLE 76. MALAYSIA CANNED PEELED TOMATOES MARKET, BY SALES CHANNEL, 2022-2032 ($MILLION)
- TABLE 77. INDONESIA CANNED PEELED TOMATOES MARKET, BY TYPE, 2022-2032 ($MILLION)
- TABLE 78. INDONESIA CANNED PEELED TOMATOES MARKET, BY END USER, 2022-2032 ($MILLION)
- TABLE 79. INDONESIA CANNED PEELED TOMATOES MARKET, BY SALES CHANNEL, 2022-2032 ($MILLION)
- TABLE 80. REST OF ASIA-PACIFIC CANNED PEELED TOMATOES MARKET, BY TYPE, 2022-2032 ($MILLION)
- TABLE 81. REST OF ASIA-PACIFIC CANNED PEELED TOMATOES MARKET, BY END USER, 2022-2032 ($MILLION)
- TABLE 82. REST OF ASIA-PACIFIC CANNED PEELED TOMATOES MARKET, BY SALES CHANNEL, 2022-2032 ($MILLION)
- TABLE 83. LAMEA CANNED PEELED TOMATOES MARKET, BY TYPE, 2022-2032 ($MILLION)
- TABLE 84. LAMEA CANNED PEELED TOMATOES MARKET, BY END USER, 2022-2032 ($MILLION)
- TABLE 85. LAMEA CANNED PEELED TOMATOES MARKET, BY SALES CHANNEL, 2022-2032 ($MILLION)
- TABLE 86. LAMEA CANNED PEELED TOMATOES MARKET, BY COUNTRY, 2022-2032 ($MILLION)
- TABLE 87. BRAZIL CANNED PEELED TOMATOES MARKET, BY TYPE, 2022-2032 ($MILLION)
- TABLE 88. BRAZIL CANNED PEELED TOMATOES MARKET, BY END USER, 2022-2032 ($MILLION)
- TABLE 89. BRAZIL CANNED PEELED TOMATOES MARKET, BY SALES CHANNEL, 2022-2032 ($MILLION)
- TABLE 90. SOUTH AFRICA, CANNED PEELED TOMATOES MARKET, BY TYPE, 2022-2032 ($MILLION)
- TABLE 91. SOUTH AFRICA, CANNED PEELED TOMATOES MARKET, BY END USER, 2022-2032 ($MILLION)
- TABLE 92. SOUTH AFRICA, CANNED PEELED TOMATOES MARKET, BY SALES CHANNEL, 2022-2032 ($MILLION)
- TABLE 93. SAUDI ARABIA CANNED PEELED TOMATOES MARKET, BY TYPE, 2022-2032 ($MILLION)
- TABLE 94. SAUDI ARABIA CANNED PEELED TOMATOES MARKET, BY END USER, 2022-2032 ($MILLION)
- TABLE 95. SAUDI ARABIA CANNED PEELED TOMATOES MARKET, BY SALES CHANNEL, 2022-2032 ($MILLION)
- TABLE 96. UAE CANNED PEELED TOMATOES MARKET, BY TYPE, 2022-2032 ($MILLION)
- TABLE 97. UAE CANNED PEELED TOMATOES MARKET, BY END USER, 2022-2032 ($MILLION)
- TABLE 98. UAE CANNED PEELED TOMATOES MARKET, BY SALES CHANNEL, 2022-2032 ($MILLION)
- TABLE 99. ARGENTINA CANNED PEELED TOMATOES MARKET, BY TYPE, 2022-2032 ($MILLION)
- TABLE 100. ARGENTINA CANNED PEELED TOMATOES MARKET, BY END USER, 2022-2032 ($MILLION)
- TABLE 101. ARGENTINA CANNED PEELED TOMATOES MARKET, BY SALES CHANNEL, 2022-2032 ($MILLION)
- TABLE 102. REST OF LAMEA CANNED PEELED TOMATOES MARKET, BY TYPE, 2022-2032 ($MILLION)
- TABLE 103. REST OF LAMEA CANNED PEELED TOMATOES MARKET, BY END USER, 2022-2032 ($MILLION)
- TABLE 104. REST OF LAMEA CANNED PEELED TOMATOES MARKET, BY SALES CHANNEL, 2022-2032 ($MILLION)
- TABLE 105. DEL MONTE PACIFIC LIMITED: KEY EXECUTIVES
- TABLE 106. DEL MONTE PACIFIC LIMITED: COMPANY SNAPSHOT
- TABLE 107. DEL MONTE PACIFIC LIMITED: PRODUCT SEGMENTS
- TABLE 108. DEL MONTE PACIFIC LIMITED: PRODUCT PORTFOLIO
- TABLE 109. DEL MONTE PACIFIC LIMITED: KEY STRATERGIES
- TABLE 110. LA DORIA S.P.A.: KEY EXECUTIVES
- TABLE 111. LA DORIA S.P.A.: COMPANY SNAPSHOT
- TABLE 112. LA DORIA S.P.A.: PRODUCT SEGMENTS
- TABLE 113. LA DORIA S.P.A.: PRODUCT PORTFOLIO
- TABLE 114. THE KRAFT HEINZ COMPANY: KEY EXECUTIVES
- TABLE 115. THE KRAFT HEINZ COMPANY: COMPANY SNAPSHOT
- TABLE 116. THE KRAFT HEINZ COMPANY: PRODUCT SEGMENTS
- TABLE 117. THE KRAFT HEINZ COMPANY: PRODUCT PORTFOLIO
- TABLE 118. THE KRAFT HEINZ COMPANY: KEY STRATERGIES
- TABLE 119. CENTO FINE FOODS, INC.: KEY EXECUTIVES
- TABLE 120. CENTO FINE FOODS, INC.: COMPANY SNAPSHOT
- TABLE 121. CENTO FINE FOODS, INC.: PRODUCT SEGMENTS
- TABLE 122. CENTO FINE FOODS, INC.: PRODUCT PORTFOLIO
- TABLE 123. B&G FOODS, INC.: KEY EXECUTIVES
- TABLE 124. B&G FOODS, INC.: COMPANY SNAPSHOT
- TABLE 125. B&G FOODS, INC.: PRODUCT SEGMENTS
- TABLE 126. B&G FOODS, INC.: PRODUCT PORTFOLIO
- TABLE 127. THE PASTENE COMPANIES, LTD.: KEY EXECUTIVES
- TABLE 128. THE PASTENE COMPANIES, LTD.: COMPANY SNAPSHOT
- TABLE 129. THE PASTENE COMPANIES, LTD.: PRODUCT SEGMENTS
- TABLE 130. THE PASTENE COMPANIES, LTD.: PRODUCT PORTFOLIO
- TABLE 131. THE PASTENE COMPANIES, LTD.: KEY STRATERGIES
- TABLE 132. BIANCO DINAPOLI: KEY EXECUTIVES
- TABLE 133. BIANCO DINAPOLI: COMPANY SNAPSHOT
- TABLE 134. BIANCO DINAPOLI: PRODUCT SEGMENTS
- TABLE 135. BIANCO DINAPOLI: PRODUCT PORTFOLIO
- TABLE 136. CONAGRA BRANDS, INC.: KEY EXECUTIVES
- TABLE 137. CONAGRA BRANDS, INC.: COMPANY SNAPSHOT
- TABLE 138. CONAGRA BRANDS, INC.: PRODUCT SEGMENTS
- TABLE 139. CONAGRA BRANDS, INC.: PRODUCT PORTFOLIO
- TABLE 140. CONAGRA BRANDS, INC.: KEY STRATERGIES
- TABLE 141. GENERAL MILLS, INC.: KEY EXECUTIVES
- TABLE 142. GENERAL MILLS, INC.: COMPANY SNAPSHOT
- TABLE 143. GENERAL MILLS, INC.: PRODUCT SEGMENTS
- TABLE 144. GENERAL MILLS, INC.: PRODUCT PORTFOLIO
- TABLE 145. MUTTI S.P.A.: KEY EXECUTIVES
- TABLE 146. MUTTI S.P.A.: COMPANY SNAPSHOT
- TABLE 147. MUTTI S.P.A.: PRODUCT SEGMENTS
- TABLE 148. MUTTI S.P.A.: PRODUCT PORTFOLIO
- TABLE 149. MUTTI S.P.A.: KEY STRATERGIES
LIST OF FIGURES
- FIGURE 01. CANNED PEELED TOMATOES MARKET, 2022-2032
- FIGURE 02. SEGMENTATION OF CANNED PEELED TOMATOES MARKET, 2022-2032
- FIGURE 03. TOP INVESTMENT POCKETS IN CANNED PEELED TOMATOES MARKET (2023-2032)
- FIGURE 04. MODERATE BARGAINING POWER OF SUPPLIERS
- FIGURE 05. MODERATE BARGAINING POWER OF BUYERS
- FIGURE 06. MODERATE THREAT OF SUBSTITUTES
- FIGURE 07. HIGH THREAT OF NEW ENTRANTS
- FIGURE 08. HIGH INTENSITY OF RIVALRY
- FIGURE 09. DRIVERS, RESTRAINTS AND OPPORTUNITIES: GLOBALCANNED PEELED TOMATOES MARKET
- FIGURE 10. CANNED PEELED TOMATOES MARKET, BY TYPE, 2022(%)
- FIGURE 11. COMPARATIVE SHARE ANALYSIS OF CANNED PEELED TOMATOES MARKET FOR WHOLE PEELED TOMATOES, BY COUNTRY 2022 AND 2032(%)
- FIGURE 12. COMPARATIVE SHARE ANALYSIS OF CANNED PEELED TOMATOES MARKET FOR DICED TOMATOES, BY COUNTRY 2022 AND 2032(%)
- FIGURE 13. COMPARATIVE SHARE ANALYSIS OF CANNED PEELED TOMATOES MARKET FOR CRUSHED TOMATOES, BY COUNTRY 2022 AND 2032(%)
- FIGURE 14. COMPARATIVE SHARE ANALYSIS OF CANNED PEELED TOMATOES MARKET FOR PUREED TOMATOES, BY COUNTRY 2022 AND 2032(%)
- FIGURE 15. COMPARATIVE SHARE ANALYSIS OF CANNED PEELED TOMATOES MARKET FOR OTHERS, BY COUNTRY 2022 AND 2032(%)
- FIGURE 16. CANNED PEELED TOMATOES MARKET, BY END USER, 2022(%)
- FIGURE 17. COMPARATIVE SHARE ANALYSIS OF CANNED PEELED TOMATOES MARKET FOR RESIDENTIAL, BY COUNTRY 2022 AND 2032(%)
- FIGURE 18. COMPARATIVE SHARE ANALYSIS OF CANNED PEELED TOMATOES MARKET FOR COMMERCIAL, BY COUNTRY 2022 AND 2032(%)
- FIGURE 19. CANNED PEELED TOMATOES MARKET, BY SALES CHANNEL, 2022(%)
- FIGURE 20. COMPARATIVE SHARE ANALYSIS OF CANNED PEELED TOMATOES MARKET FOR ONLINE, BY COUNTRY 2022 AND 2032(%)
- FIGURE 21. COMPARATIVE SHARE ANALYSIS OF CANNED PEELED TOMATOES MARKET FOR OFFLINE, BY COUNTRY 2022 AND 2032(%)
- FIGURE 22. CANNED PEELED TOMATOES MARKET BY REGION, 2022
- FIGURE 23. U.S. CANNED PEELED TOMATOES MARKET, 2022-2032 ($MILLION)
- FIGURE 24. CANADA CANNED PEELED TOMATOES MARKET, 2022-2032 ($MILLION)
- FIGURE 25. MEXICO CANNED PEELED TOMATOES MARKET, 2022-2032 ($MILLION)
- FIGURE 26. GERMANY CANNED PEELED TOMATOES MARKET, 2022-2032 ($MILLION)
- FIGURE 27. FRANCE CANNED PEELED TOMATOES MARKET, 2022-2032 ($MILLION)
- FIGURE 28. ITALY CANNED PEELED TOMATOES MARKET, 2022-2032 ($MILLION)
- FIGURE 29. SPAIN CANNED PEELED TOMATOES MARKET, 2022-2032 ($MILLION)
- FIGURE 30. UK CANNED PEELED TOMATOES MARKET, 2022-2032 ($MILLION)
- FIGURE 31. RUSSIA CANNED PEELED TOMATOES MARKET, 2022-2032 ($MILLION)
- FIGURE 32. REST OF EUROPE CANNED PEELED TOMATOES MARKET, 2022-2032 ($MILLION)
- FIGURE 33. CHINA CANNED PEELED TOMATOES MARKET, 2022-2032 ($MILLION)
- FIGURE 34. JAPAN CANNED PEELED TOMATOES MARKET, 2022-2032 ($MILLION)
- FIGURE 35. INDIA CANNED PEELED TOMATOES MARKET, 2022-2032 ($MILLION)
- FIGURE 36. SOUTH KOREA CANNED PEELED TOMATOES MARKET, 2022-2032 ($MILLION)
- FIGURE 37. AUSTRALIA CANNED PEELED TOMATOES MARKET, 2022-2032 ($MILLION)
- FIGURE 38. THAILAND CANNED PEELED TOMATOES MARKET, 2022-2032 ($MILLION)
- FIGURE 39. MALAYSIA CANNED PEELED TOMATOES MARKET, 2022-2032 ($MILLION)
- FIGURE 40. INDONESIA CANNED PEELED TOMATOES MARKET, 2022-2032 ($MILLION)
- FIGURE 41. REST OF ASIA-PACIFIC CANNED PEELED TOMATOES MARKET, 2022-2032 ($MILLION)
- FIGURE 42. BRAZIL CANNED PEELED TOMATOES MARKET, 2022-2032 ($MILLION)
- FIGURE 43. SOUTH AFRICA, CANNED PEELED TOMATOES MARKET, 2022-2032 ($MILLION)
- FIGURE 44. SAUDI ARABIA CANNED PEELED TOMATOES MARKET, 2022-2032 ($MILLION)
- FIGURE 45. UAE CANNED PEELED TOMATOES MARKET, 2022-2032 ($MILLION)
- FIGURE 46. ARGENTINA CANNED PEELED TOMATOES MARKET, 2022-2032 ($MILLION)
- FIGURE 47. REST OF LAMEA CANNED PEELED TOMATOES MARKET, 2022-2032 ($MILLION)
- FIGURE 48. TOP WINNING STRATEGIES, BY YEAR
- FIGURE 49. TOP WINNING STRATEGIES, BY DEVELOPMENT
- FIGURE 50. TOP WINNING STRATEGIES, BY COMPANY
- FIGURE 51. PRODUCT MAPPING OF TOP 10 PLAYERS
- FIGURE 52. COMPETITIVE DASHBOARD
- FIGURE 53. COMPETITIVE HEATMAP: CANNED PEELED TOMATOES MARKET
- FIGURE 54. TOP PLAYER POSITIONING, 2022
- FIGURE 55. DEL MONTE PACIFIC LIMITED: NET REVENUE, 2019-2021 ($MILLION)
- FIGURE 56. DEL MONTE PACIFIC LIMITED: RESEARCH & DEVELOPMENT EXPENDITURE, 2019-2021 ($MILLION)
- FIGURE 57. DEL MONTE PACIFIC LIMITED: REVENUE SHARE BY SEGMENT, 2021 (%)
- FIGURE 58. LA DORIA S.P.A.: NET REVENUE, 2020-2022 ($MILLION)
- FIGURE 59. LA DORIA S.P.A.: REVENUE SHARE BY REGION, 2022 (%)
- FIGURE 60. THE KRAFT HEINZ COMPANY: NET SALES, 2020-2022 ($MILLION)
- FIGURE 61. THE KRAFT HEINZ COMPANY: RESEARCH & DEVELOPMENT EXPENDITURE, 2020-2022 ($MILLION)
- FIGURE 62. THE KRAFT HEINZ COMPANY: REVENUE SHARE BY SEGMENT, 2022 (%)
- FIGURE 63. THE KRAFT HEINZ COMPANY: REVENUE SHARE BY REGION, 2022 (%)
- FIGURE 64. B&G FOODS, INC.: NET SALES, 2020-2022 ($MILLION)
- FIGURE 65. CONAGRA BRANDS, INC.: NET SALES, 2019-2021 ($MILLION)
- FIGURE 66. CONAGRA BRANDS, INC.: RESEARCH & DEVELOPMENT EXPENDITURE, 2019-2021 ($MILLION)
- FIGURE 67. CONAGRA BRANDS, INC.: REVENUE SHARE BY SEGMENT, 2021 (%)
- FIGURE 68. GENERAL MILLS, INC.: NET SALES, 2020-2022 ($MILLION)
- FIGURE 69. GENERAL MILLS, INC.: RESEARCH & DEVELOPMENT EXPENDITURE, 2020-2022 ($MILLION)
- FIGURE 70. GENERAL MILLS, INC.: REVENUE SHARE BY SEGMENT, 2022 (%)
- FIGURE 71. GENERAL MILLS, INC.: REVENUE SHARE BY REGION, 2022 (%)
According to a new report published by Allied Market Research, titled, "Canned Peeled Tomatoes Market," The canned peeled tomatoes market was valued at $4 billion in 2022, and is estimated to reach $6.8 billion by 2032, growing at a CAGR of 5.6% from 2023 to 2032.
Canned peeled tomatoes are a versatile ingredient that can be used in a wide variety of recipes to add flavor, nutrition, and color. They are a versatile ingredient that can be used in a wide variety of recipes from soups and stews to casseroles and pasta sauces, to add flavor, nutrition, and color. Canned tomatoes are also an excellent source of vitamins A and C, potassium, and fiber, making them a healthy addition to any diet.
Canned peeled tomatoes significantly reduce the preparation time required for various recipes, including pasta sauces, soups, stews, and curries. By using canned tomatoes, consumers skip the process of peeling and deseeding fresh tomatoes, which can be exhausting and time-consuming. This time-saving factor appeals to consumers who want to prepare meals efficiently, especially during weekdays when they have limited time for cooking. Manufacturers can leverage this versatility by developing new & innovative recipes that showcase the different culinary applications of canned peeled tomatoes. They can simultaneously work with chefs and culinary experts to create recipe ideas and cooking tutorials that inspire consumers to experiment with different cuisines and culinary techniques. Moreover, canned peeled tomato manufacturers can cater to the growing trend of ethnic and regional cuisines by offering canned peeled tomato products that are specifically formulated for these cuisines. This can include products that are spiced or flavored to suit the different culinary preferences of consumers in different regions.
Food waste has become a global concern, and consumers are increasingly conscious of minimizing waste and making sustainable choices. Canned peeled tomatoes offer a longer shelf life compared to fresh tomatoes, reducing the likelihood of spoilage and thus, food waste. This aspect has driven the demand for canned peeled tomatoes among environmentally conscious consumers. Moreover, manufacturers emphasize the sustainability aspect of their canned peeled tomato by highlighting their extended shelf life and the reduction of food waste. Further, they can incorporate eco-friendly packaging materials and communicate their commitment to sustainable practices, appealing to consumers who prioritize environmental responsibility.
Hypermarkets & supermarkets are the primary and the most important sales channel for canned peeled tomatoes, owing to their higher penetration. There are other retail channels such as specialty stores and online stores that serve as popular retail channels for canned peeled tomatoes. Further, top players are investing in improving their digital presence across the online channels and are rapidly gaining popularity. The rapid emergence of the modern online retail sales channel is expected to propel the growth of the canned peeled tomatoes market in the upcoming years.
There is a growing trend toward healthy & organic food products, which presents an opportunity for canned peeled tomato manufacturers to tap into organic segment. Consumers are becoming more health-conscious and are looking for food products that are free from harmful additives and preservatives. Manufacturers can leverage this opportunity by offering organic & natural canned peeled tomato products. This can include products that are certified organic, non-GMO, and free from artificial preservatives, colors, and flavors. Further, manufacturers can promote the health benefits of tomatoes, such as their high nutrient content and antioxidant properties, to attract health-conscious consumers
The canned peeled tomatoes market has seen significant growth in recent years, and rise in preference for private label products is one of the key factors driving this trend. One of the main reasons is that private label products are typically priced lower than branded products. This is due to the fact that the retailer does not have to pay for advertising or marketing costs associated with promoting a branded product. As a result, private label products are often seen as a more affordable option for consumers, particularly in times of economic uncertainty. In addition, private label products offer retailers greater control over the products they sell. By developing their own private label products, retailers can ensure that the products meet the needs and preferences of their customers, such as packaging, taste, and nutritional content. By offering products that are tailored to their customers' needs, retailers can build stronger relationships with their customers and increase customer loyalty.
The global canned peeled tomatoes market is segmented on the basis of type, end user, sales channel, and region. By type, it is divided into whole peeled tomatoes, diced tomatoes, crushed tomatoes, pureed tomatoes, and others. Depending on end user, it is divided into residential and commercial. As per sales channel, it is divided into online and offline. Region wise, it is analyzed across North America (the U.S., Canada, and Mexico), Europe (Germany, France, Italy, Spain, the UK, Russia, and rest of Europe), Asia-Pacific (China, Japan, India, South Korea, Australia, Thailand, Malaysia, Indonesia, and rest of Asia-Pacific), and LAMEA (Brazil, South Africa, Saudi Arabia, UAE, Argentina, and rest of LAMEA).
The players in the canned peeled tomatoes market have adopted acquisition, business expansion, partnership, collaboration, and product launch as their key development strategies to increase profitability and improve their position in the market.
Some of the key players profiled in the canned peeled tomatoes market analysis include: B&G Foods, Bianco DiNapoli, Cento Fine Foods, Conagra Brands, Inc., Del Monte Pacific Limited, General Mills, Inc., La Doria S.p.A., Mutti S.p.A., The Kraft Heinz Company, and The Pastene Companies, Ltd.
Key Benefits For Stakeholders
- This report provides a quantitative analysis of the market segments, current trends, estimations, and dynamics of the canned peeled tomatoes market analysis from 2022 to 2032 to identify the prevailing canned peeled tomatoes market opportunities.
- The market research is offered along with information related to key drivers, restraints, and opportunities.
- Porter's five forces analysis highlights the potency of buyers and suppliers to enable stakeholders make profit-oriented business decisions and strengthen their supplier-buyer network.
- In-depth analysis of the canned peeled tomatoes market segmentation assists to determine the prevailing market opportunities.
- Major countries in each region are mapped according to their revenue contribution to the global market.
- Market player positioning facilitates benchmarking and provides a clear understanding of the present position of the market players.
- The report includes the analysis of the regional as well as global canned peeled tomatoes market trends, key players, market segments, application areas, and market growth strategies.
Key Market Segments
By Type
- Whole peeled tomatoes
- Diced tomatoes
- Crushed tomatoes
- Pureed tomatoes
- Others
By End User
- Residential
- Commercial
By Sales Channel
- Online
- Offline
By Region
- North America
- U.S.
- Canada
- Mexico
- Europe
- Germany
- France
- Italy
- Spain
- UK
- Russia
- Rest of Europe
- Asia-Pacific
- China
- Japan
- India
- South Korea
- Australia
- Thailand
- Malaysia
- Indonesia
- Rest of Asia-Pacific
- LAMEA
- Brazil
- South Africa,
- Saudi Arabia
- UAE
- Argentina
- Rest of LAMEA
Key Market Players:
- B&G Foods, Inc.
- Bianco DiNapoli
- Cento Fine Foods, Inc.
- Conagra Brands, Inc.
- Del Monte Pacific Limited
- General Mills, Inc.
- La Doria S.p.A.
- Mutti S.p.A.
- The Kraft Heinz Company
- The Pastene Companies, Ltd.
TABLE OF CONTENTS
CHAPTER 1: INTRODUCTION
- 1.1. Report description
- 1.2. Key market segments
- 1.3. Key benefits to the stakeholders
- 1.4. Research Methodology
- 1.4.1. Primary research
- 1.4.2. Secondary research
- 1.4.3. Analyst tools and models
CHAPTER 2: EXECUTIVE SUMMARY
- 2.1. CXO Perspective
CHAPTER 3: MARKET OVERVIEW
- 3.1. Market definition and scope
- 3.2. Key findings
- 3.2.1. Top impacting factors
- 3.2.2. Top investment pockets
- 3.3. Porter's five forces analysis
- 3.3.1. Bargaining power of suppliers
- 3.3.2. Bargaining power of buyers
- 3.3.3. Threat of substitutes
- 3.3.4. Threat of new entrants
- 3.3.5. Intensity of rivalry
- 3.4. Market dynamics
- 3.4.1. Drivers
- 3.4.1.1. Rise in the popularity of ready-to-eat products
- 3.4.1.2. Versatility of Canned Peeled Tomatoes
- 3.4.1.3. Increase in Demand for Processed Food Products
- 3.4.1. Drivers
- 3.4.2. Restraints
- 3.4.2.1. Volatile prices of tomatoes
- 3.4.2.2. Competitive Challenges
- 3.4.3. Opportunities
- 3.4.3.1. Innovation in product offerings
- 3.5. COVID-19 Impact Analysis on the market
CHAPTER 4: CANNED PEELED TOMATOES MARKET, BY TYPE
- 4.1. Overview
- 4.1.1. Market size and forecast
- 4.2. Whole peeled tomatoes
- 4.2.1. Key market trends, growth factors and opportunities
- 4.2.2. Market size and forecast, by region
- 4.2.3. Market share analysis by country
- 4.3. Diced tomatoes
- 4.3.1. Key market trends, growth factors and opportunities
- 4.3.2. Market size and forecast, by region
- 4.3.3. Market share analysis by country
- 4.4. Crushed tomatoes
- 4.4.1. Key market trends, growth factors and opportunities
- 4.4.2. Market size and forecast, by region
- 4.4.3. Market share analysis by country
- 4.5. Pureed tomatoes
- 4.5.1. Key market trends, growth factors and opportunities
- 4.5.2. Market size and forecast, by region
- 4.5.3. Market share analysis by country
- 4.6. Others
- 4.6.1. Key market trends, growth factors and opportunities
- 4.6.2. Market size and forecast, by region
- 4.6.3. Market share analysis by country
CHAPTER 5: CANNED PEELED TOMATOES MARKET, BY END USER
- 5.1. Overview
- 5.1.1. Market size and forecast
- 5.2. Residential
- 5.2.1. Key market trends, growth factors and opportunities
- 5.2.2. Market size and forecast, by region
- 5.2.3. Market share analysis by country
- 5.3. Commercial
- 5.3.1. Key market trends, growth factors and opportunities
- 5.3.2. Market size and forecast, by region
- 5.3.3. Market share analysis by country
CHAPTER 6: CANNED PEELED TOMATOES MARKET, BY SALES CHANNEL
- 6.1. Overview
- 6.1.1. Market size and forecast
- 6.2. Online
- 6.2.1. Key market trends, growth factors and opportunities
- 6.2.2. Market size and forecast, by region
- 6.2.3. Market share analysis by country
- 6.3. Offline
- 6.3.1. Key market trends, growth factors and opportunities
- 6.3.2. Market size and forecast, by region
- 6.3.3. Market share analysis by country
CHAPTER 7: CANNED PEELED TOMATOES MARKET, BY REGION
- 7.1. Overview
- 7.1.1. Market size and forecast By Region
- 7.2. North America
- 7.2.1. Key trends and opportunities
- 7.2.2. Market size and forecast, by Type
- 7.2.3. Market size and forecast, by End User
- 7.2.4. Market size and forecast, by Sales Channel
- 7.2.5. Market size and forecast, by country
- 7.2.5.1. U.S.
- 7.2.5.1.1. Key market trends, growth factors and opportunities
- 7.2.5.1.2. Market size and forecast, by Type
- 7.2.5.1.3. Market size and forecast, by End User
- 7.2.5.1.4. Market size and forecast, by Sales Channel
- 7.2.5.2. Canada
- 7.2.5.2.1. Key market trends, growth factors and opportunities
- 7.2.5.2.2. Market size and forecast, by Type
- 7.2.5.2.3. Market size and forecast, by End User
- 7.2.5.2.4. Market size and forecast, by Sales Channel
- 7.2.5.3. Mexico
- 7.2.5.3.1. Key market trends, growth factors and opportunities
- 7.2.5.3.2. Market size and forecast, by Type
- 7.2.5.3.3. Market size and forecast, by End User
- 7.2.5.3.4. Market size and forecast, by Sales Channel
- 7.3. Europe
- 7.3.1. Key trends and opportunities
- 7.3.2. Market size and forecast, by Type
- 7.3.3. Market size and forecast, by End User
- 7.3.4. Market size and forecast, by Sales Channel
- 7.3.5. Market size and forecast, by country
- 7.3.5.1. Germany
- 7.3.5.1.1. Key market trends, growth factors and opportunities
- 7.3.5.1.2. Market size and forecast, by Type
- 7.3.5.1.3. Market size and forecast, by End User
- 7.3.5.1.4. Market size and forecast, by Sales Channel
- 7.3.5.2. France
- 7.3.5.2.1. Key market trends, growth factors and opportunities
- 7.3.5.2.2. Market size and forecast, by Type
- 7.3.5.2.3. Market size and forecast, by End User
- 7.3.5.2.4. Market size and forecast, by Sales Channel
- 7.3.5.3. Italy
- 7.3.5.3.1. Key market trends, growth factors and opportunities
- 7.3.5.3.2. Market size and forecast, by Type
- 7.3.5.3.3. Market size and forecast, by End User
- 7.3.5.3.4. Market size and forecast, by Sales Channel
- 7.3.5.4. Spain
- 7.3.5.4.1. Key market trends, growth factors and opportunities
- 7.3.5.4.2. Market size and forecast, by Type
- 7.3.5.4.3. Market size and forecast, by End User
- 7.3.5.4.4. Market size and forecast, by Sales Channel
- 7.3.5.5. UK
- 7.3.5.5.1. Key market trends, growth factors and opportunities
- 7.3.5.5.2. Market size and forecast, by Type
- 7.3.5.5.3. Market size and forecast, by End User
- 7.3.5.5.4. Market size and forecast, by Sales Channel
- 7.3.5.6. Russia
- 7.3.5.6.1. Key market trends, growth factors and opportunities
- 7.3.5.6.2. Market size and forecast, by Type
- 7.3.5.6.3. Market size and forecast, by End User
- 7.3.5.6.4. Market size and forecast, by Sales Channel
- 7.3.5.7. Rest of Europe
- 7.3.5.7.1. Key market trends, growth factors and opportunities
- 7.3.5.7.2. Market size and forecast, by Type
- 7.3.5.7.3. Market size and forecast, by End User
- 7.3.5.7.4. Market size and forecast, by Sales Channel
- 7.4. Asia-Pacific
- 7.4.1. Key trends and opportunities
- 7.4.2. Market size and forecast, by Type
- 7.4.3. Market size and forecast, by End User
- 7.4.4. Market size and forecast, by Sales Channel
- 7.4.5. Market size and forecast, by country
- 7.4.5.1. China
- 7.4.5.1.1. Key market trends, growth factors and opportunities
- 7.4.5.1.2. Market size and forecast, by Type
- 7.4.5.1.3. Market size and forecast, by End User
- 7.4.5.1.4. Market size and forecast, by Sales Channel
- 7.4.5.2. Japan
- 7.4.5.2.1. Key market trends, growth factors and opportunities
- 7.4.5.2.2. Market size and forecast, by Type
- 7.4.5.2.3. Market size and forecast, by End User
- 7.4.5.2.4. Market size and forecast, by Sales Channel
- 7.4.5.3. India
- 7.4.5.3.1. Key market trends, growth factors and opportunities
- 7.4.5.3.2. Market size and forecast, by Type
- 7.4.5.3.3. Market size and forecast, by End User
- 7.4.5.3.4. Market size and forecast, by Sales Channel
- 7.4.5.4. South Korea
- 7.4.5.4.1. Key market trends, growth factors and opportunities
- 7.4.5.4.2. Market size and forecast, by Type
- 7.4.5.4.3. Market size and forecast, by End User
- 7.4.5.4.4. Market size and forecast, by Sales Channel
- 7.4.5.5. Australia
- 7.4.5.5.1. Key market trends, growth factors and opportunities
- 7.4.5.5.2. Market size and forecast, by Type
- 7.4.5.5.3. Market size and forecast, by End User
- 7.4.5.5.4. Market size and forecast, by Sales Channel
- 7.4.5.6. Thailand
- 7.4.5.6.1. Key market trends, growth factors and opportunities
- 7.4.5.6.2. Market size and forecast, by Type
- 7.4.5.6.3. Market size and forecast, by End User
- 7.4.5.6.4. Market size and forecast, by Sales Channel
- 7.4.5.7. Malaysia
- 7.4.5.7.1. Key market trends, growth factors and opportunities
- 7.4.5.7.2. Market size and forecast, by Type
- 7.4.5.7.3. Market size and forecast, by End User
- 7.4.5.7.4. Market size and forecast, by Sales Channel
- 7.4.5.8. Indonesia
- 7.4.5.8.1. Key market trends, growth factors and opportunities
- 7.4.5.8.2. Market size and forecast, by Type
- 7.4.5.8.3. Market size and forecast, by End User
- 7.4.5.8.4. Market size and forecast, by Sales Channel
- 7.4.5.9. Rest of Asia-Pacific
- 7.4.5.9.1. Key market trends, growth factors and opportunities
- 7.4.5.9.2. Market size and forecast, by Type
- 7.4.5.9.3. Market size and forecast, by End User
- 7.4.5.9.4. Market size and forecast, by Sales Channel
- 7.5. LAMEA
- 7.5.1. Key trends and opportunities
- 7.5.2. Market size and forecast, by Type
- 7.5.3. Market size and forecast, by End User
- 7.5.4. Market size and forecast, by Sales Channel
- 7.5.5. Market size and forecast, by country
- 7.5.5.1. Brazil
- 7.5.5.1.1. Key market trends, growth factors and opportunities
- 7.5.5.1.2. Market size and forecast, by Type
- 7.5.5.1.3. Market size and forecast, by End User
- 7.5.5.1.4. Market size and forecast, by Sales Channel
- 7.5.5.2. South Africa,
- 7.5.5.2.1. Key market trends, growth factors and opportunities
- 7.5.5.2.2. Market size and forecast, by Type
- 7.5.5.2.3. Market size and forecast, by End User
- 7.5.5.2.4. Market size and forecast, by Sales Channel
- 7.5.5.3. Saudi Arabia
- 7.5.5.3.1. Key market trends, growth factors and opportunities
- 7.5.5.3.2. Market size and forecast, by Type
- 7.5.5.3.3. Market size and forecast, by End User
- 7.5.5.3.4. Market size and forecast, by Sales Channel
- 7.5.5.4. UAE
- 7.5.5.4.1. Key market trends, growth factors and opportunities
- 7.5.5.4.2. Market size and forecast, by Type
- 7.5.5.4.3. Market size and forecast, by End User
- 7.5.5.4.4. Market size and forecast, by Sales Channel
- 7.5.5.5. Argentina
- 7.5.5.5.1. Key market trends, growth factors and opportunities
- 7.5.5.5.2. Market size and forecast, by Type
- 7.5.5.5.3. Market size and forecast, by End User
- 7.5.5.5.4. Market size and forecast, by Sales Channel
- 7.5.5.6. Rest of LAMEA
- 7.5.5.6.1. Key market trends, growth factors and opportunities
- 7.5.5.6.2. Market size and forecast, by Type
- 7.5.5.6.3. Market size and forecast, by End User
- 7.5.5.6.4. Market size and forecast, by Sales Channel
CHAPTER 8: COMPETITIVE LANDSCAPE
- 8.1. Introduction
- 8.2. Top winning strategies
- 8.3. Product Mapping of Top 10 Player
- 8.4. Competitive Dashboard
- 8.5. Competitive Heatmap
- 8.6. Top player positioning, 2022
CHAPTER 9: COMPANY PROFILES
- 9.1. Del Monte Pacific Limited
- 9.1.1. Company overview
- 9.1.2. Key Executives
- 9.1.3. Company snapshot
- 9.1.4. Operating business segments
- 9.1.5. Product portfolio
- 9.1.6. Business performance
- 9.1.7. Key strategic moves and developments
- 9.2. La Doria S.p.A.
- 9.2.1. Company overview
- 9.2.2. Key Executives
- 9.2.3. Company snapshot
- 9.2.4. Operating business segments
- 9.2.5. Product portfolio
- 9.2.6. Business performance
- 9.3. The Kraft Heinz Company
- 9.3.1. Company overview
- 9.3.2. Key Executives
- 9.3.3. Company snapshot
- 9.3.4. Operating business segments
- 9.3.5. Product portfolio
- 9.3.6. Business performance
- 9.3.7. Key strategic moves and developments
- 9.4. Cento Fine Foods, Inc.
- 9.4.1. Company overview
- 9.4.2. Key Executives
- 9.4.3. Company snapshot
- 9.4.4. Operating business segments
- 9.4.5. Product portfolio
- 9.5. B&G Foods, Inc.
- 9.5.1. Company overview
- 9.5.2. Key Executives
- 9.5.3. Company snapshot
- 9.5.4. Operating business segments
- 9.5.5. Product portfolio
- 9.5.6. Business performance
- 9.6. The Pastene Companies, Ltd.
- 9.6.1. Company overview
- 9.6.2. Key Executives
- 9.6.3. Company snapshot
- 9.6.4. Operating business segments
- 9.6.5. Product portfolio
- 9.6.6. Key strategic moves and developments
- 9.7. Bianco DiNapoli
- 9.7.1. Company overview
- 9.7.2. Key Executives
- 9.7.3. Company snapshot
- 9.7.4. Operating business segments
- 9.7.5. Product portfolio
- 9.8. Conagra Brands, Inc.
- 9.8.1. Company overview
- 9.8.2. Key Executives
- 9.8.3. Company snapshot
- 9.8.4. Operating business segments
- 9.8.5. Product portfolio
- 9.8.6. Business performance
- 9.8.7. Key strategic moves and developments
- 9.9. General Mills, Inc.
- 9.9.1. Company overview
- 9.9.2. Key Executives
- 9.9.3. Company snapshot
- 9.9.4. Operating business segments
- 9.9.5. Product portfolio
- 9.9.6. Business performance
- 9.10. Mutti S.p.A.
- 9.10.1. Company overview
- 9.10.2. Key Executives
- 9.10.3. Company snapshot
- 9.10.4. Operating business segments
- 9.10.5. Product portfolio
- 9.10.6. Key strategic moves and developments