 |
市場調査レポート
商品コード
1344363
AIoTプラットフォーム市場:オファリング別、ソリューションタイプ別、業界別:世界の機会分析と産業予測、2023年~2032年AIoT Platform Market By Offering, By Solution Type, By Industry Vertical : Global Opportunity Analysis and Industry Forecast, 2023-2032 |
||||||

| AIoTプラットフォーム市場:オファリング別、ソリューションタイプ別、業界別:世界の機会分析と産業予測、2023年~2032年 |
|
出版日: 2023年06月01日
発行: Allied Market Research
ページ情報: 英文 427 Pages
納期: 2~3営業日
|
- 全表示
- 概要
- 図表
- 目次
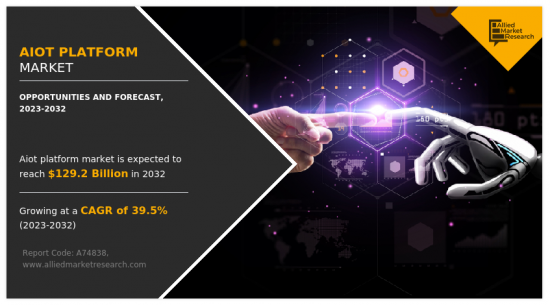
Allied Market Researchが発行した最新レポート「AIoTプラットフォーム市場」によると、アイオットプラットフォーム市場は2022年に47億米ドルと評価され、2032年には1,292億米ドルに達し、2023年から2032年までのCAGRは39.5%で成長すると推定されています。
AIとIoTの組み合わせは、企業にも消費者にもいくつかのメリットを生み出す可能性を秘めています。AIoTプラットフォームは、企業の効率性と生産性を向上させ、コストを削減するのに役立ちます。さらに、消費者には利便性の向上とより良いユーザー体験を提供できます。さらに、IoTと組み合わせてAIを使用することで、データ管理と分析を改善し、企業が自社製品をより深く理解するのに役立ちます。このような強化された要素は、予測期間中に市場成長のための有利な機会を提供すると予想されます。
デジタル化の進展、インテリジェント交通システムのニーズの高まり、先端技術の採用増加などの要因は、市場の成長にプラスの影響を与えます。また、IoTデバイスの採用の増加、AI技術の進歩、自動化需要の増加は、予測期間中の市場の成長を促進すると予想されます。さらに、ヘルスケア、農業、小売業など様々な産業におけるAIoTアプリケーションの拡大は、今後数年間、市場に有利な成長機会を提供すると期待されています。さらに、データのリアルタイム処理を可能にし、待ち時間を短縮するエッジコンピューティング技術の開発や、AIoTシステムのスケーラビリティ、柔軟性、コスト効率を可能にするクラウドコンピューティングの採用は、市場成長に有利な機会を創出すると予測されます。しかし、データプライバシーとセキュリティの懸念、データフォーマット、通信プロトコル、ネットワークの標準化の欠如が市場成長の妨げになると予想されます。
サービス別では、2022年のAIoTプラットフォームの世界市場シェアはソリューションセグメントが独占しており、今後数年間もその優位性を維持すると予想されます。技術の進歩により、AIoTプラットフォームは、BFSIから製造業、ヘルスケア、その他に至るまで、世界の産業の変革を可能にしています。しかし、AIoTプラットフォームサービスは、展開の初期段階におけるシステムの最適化に関連する時間とコストを削減するため、サービスセグメントが最も高い成長を示すと予想されます。
地域別では、北米がAIoTプラットフォーム市場の2022年の市場シェアを独占しました。クラウドベースのサービス、AI、ML、ビジネスアナリティクスソリューション、IoTなど、ビジネスと顧客体験を改善するための先進技術への投資が増加していることが、AIoTプラットフォーム市場の成長を促進すると予測されています。しかし、予測期間中はアジア太平洋地域が最も高い成長を示すと予想されています。これは、デジタル化の浸透が進み、先端技術の採用が進んでいるためで、この地域の市場に有利な成長機会がもたらされると期待されています。
- 主な影響要因
- 自動化需要の急増:
- モノの人工知能(AIoT)における自動化需要の急増は、人間の介入なしに独立して動作し意思決定できるインテリジェントシステムの必要性によってもたらされます。これはさらに、AIアルゴリズムをセンサー、ロボット、その他のデバイスと統合することで、製造などの産業プロセスを自動化するために使用されているAIoTプラットフォームとサービスに起因しています。その結果、機械が自律的に動作することが可能になり、人間の介入の必要性が減り、効率が向上します。
- さらに、AIoTにおける自動化は効率を高め、コストを削減し、精度を向上させる。したがって、データ収集や分析などの定型作業を自動化することで、企業は貴重な時間とリソースを確保し、より複雑な作業に集中することができます。また、AIoTによる自動化は、ヒューマンエラーのリスクを低減し、データ分析の信頼性を向上させる。そのため、より多くのデバイスがインターネットに接続され、生成されるデータ量が増加し続けるにつれて、AIoTにおける自動化の需要は高まっています。その結果、市場の主要プレーヤーは、市場での地位を強化するために提携や協力などの戦略を採用しました。例えば、2022年5月、アドバンテックはモノの人工知能(AIoT)開発を継続するためにHivecell社と提携しました。アドバンテックとハイブセルのパートナーシップは、IoTデータをより入手しやすく、スケーラブルで管理しやすくすることで、デジタルトランスフォーメーションにおける一般的な顧客の課題を簡素化します。このような提携や協力関係は、AIoT市場の成長を後押しします。
- 予知保全に対する需要の高まり:
- 予知保全サービスにおけるAIoTの需要が増加しています。これは、データと分析を使用して機器の故障の可能性が高い時期を予測することで、企業がダウンタイムを防止し、保守コストを削減するための事前対策を講じることが可能になるためです。また、AIoTにおける予知保全の活用は、製造業や運輸業など、設備や機械に大きく依存する組織にとって特に重要です。このように、IoTデバイスからのデータを活用し、機械学習アルゴリズムを適用することで、企業は機器の健全性と性能に関する洞察をリアルタイムで得ることができ、潜在的な問題を事前に特定することができます。
- さらに、機器が故障しそうなタイミングを予測できるようになることで、企業はダウンタイムやオフピーク時にメンテナンスのスケジュールを立てることができ、生産への影響を減らし、事故のリスクを最小限に抑えることができます。その結果、市場の主なプレーヤーは、AIoT市場でのサービスを強化するために、製品開発、パートナーシップ、コラボレーションなどの戦略を採用しました。例えば、2023年2月、超低消費電力、完全デジタル、イベントベース、ニューロモルフィックAI IPを製造するBrainChip Holdings Ltdは、AIoTによる予知保全を提供し、Minsky AI Engineを活用した次世代アプリケーション開発で協業するため、AI Labsと提携しました。こうした提携や開発は、AIoT市場の成長を促進してきました。
目次
第1章 イントロダクション
第2章 エグゼクティブサマリー
第3章 市場概要
- 市場の定義と範囲
- 主な調査結果
- 影響要因
- 主な投資機会
- ポーターのファイブフォース分析
- 供給企業の交渉力
- 買い手の交渉力
- 代替品の脅威
- 新規参入業者の脅威
- 競合の激しさ
- 市場力学
- 促進要因
- 自動化需要の急増
- 予知保全需要の増加
- インテリジェント輸送システムに対するニーズの高まり
- 抑制要因
- データのプライバシーとセキュリティに関する懸念
- AIoTソリューションの導入とメンテナンスの高コスト
- 機会
- ヘルスケア、農業、小売など様々な産業におけるAIoTアプリケーションの拡大
- 促進要因
- COVID-19による市場への影響分析
第4章 AIoTプラットフォーム市場:オファリング別
- ソリューション
- サービス
第5章 AIOTプラットフォーム市場:ソリューションタイプ別
- デバイス管理
- アプリケーション管理
- コネクティビティ管理
第6章 AIOTプラットフォーム市場:業界別
- 製造業
- BFSI
- ヘルスケア
- 小売
- エネルギー・公益事業
- 運輸・物流
- その他
第7章 AIOTプラットフォーム市場:地域別
- 北米
- 米国
- カナダ
- 欧州
- 英国
- ドイツ
- フランス
- イタリア
- スペイン
- その他欧州
- アジア太平洋
- 中国
- 日本
- インド
- オーストラリア
- 韓国
- その他アジア太平洋地域
- ラテンアメリカ
- ラテンアメリカ
- 中東
- アフリカ
第8章 競合情勢
- イントロダクション
- 主要成功戦略
- 主要10社の製品マッピング
- 競合ダッシュボード
- 競合ヒートマップ
- 主要企業のポジショニング、2022年
第9章 企業プロファイル
- International Business Machines Corporation
- Google LLC
- Microsoft Corporation
- Oracle Corporation
- Hewlett Packard Enterprise Development LP
- Cisco Systems Inc.
- Intel Corporation
- tencent cloud
- SAS Institute Inc.
- SAP SE
LIST OF TABLES
- TABLE 01. GLOBAL AIOT PLATFORM MARKET, BY OFFERING, 2022-2032 ($MILLION)
- TABLE 02. AIOT PLATFORM MARKET FOR SOLUTION, BY REGION, 2022-2032 ($MILLION)
- TABLE 03. AIOT PLATFORM MARKET FOR SERVICES, BY REGION, 2022-2032 ($MILLION)
- TABLE 04. GLOBAL AIOT PLATFORM MARKET, BY SOLUTION TYPE, 2022-2032 ($MILLION)
- TABLE 05. AIOT PLATFORM MARKET FOR DEVICE MANAGEMENT, BY REGION, 2022-2032 ($MILLION)
- TABLE 06. AIOT PLATFORM MARKET FOR APPLICATION MANAGEMENT, BY REGION, 2022-2032 ($MILLION)
- TABLE 07. AIOT PLATFORM MARKET FOR CONNECTIVITY MANAGEMENT, BY REGION, 2022-2032 ($MILLION)
- TABLE 08. GLOBAL AIOT PLATFORM MARKET, BY INDUSTRY VERTICAL, 2022-2032 ($MILLION)
- TABLE 09. AIOT PLATFORM MARKET FOR MANUFACTURING, BY REGION, 2022-2032 ($MILLION)
- TABLE 10. AIOT PLATFORM MARKET FOR BFSI, BY REGION, 2022-2032 ($MILLION)
- TABLE 11. AIOT PLATFORM MARKET FOR HEALTHCARE, BY REGION, 2022-2032 ($MILLION)
- TABLE 12. AIOT PLATFORM MARKET FOR RETAIL, BY REGION, 2022-2032 ($MILLION)
- TABLE 13. AIOT PLATFORM MARKET FOR ENERGY AND UTILITIES, BY REGION, 2022-2032 ($MILLION)
- TABLE 14. AIOT PLATFORM MARKET FOR TRANSPORTATION AND LOGISTICS, BY REGION, 2022-2032 ($MILLION)
- TABLE 15. AIOT PLATFORM MARKET FOR OTHERS, BY REGION, 2022-2032 ($MILLION)
- TABLE 16. AIOT PLATFORM MARKET, BY REGION, 2022-2032 ($MILLION)
- TABLE 17. NORTH AMERICA AIOT PLATFORM MARKET, BY OFFERING, 2022-2032 ($MILLION)
- TABLE 18. NORTH AMERICA AIOT PLATFORM MARKET, BY SOLUTION TYPE, 2022-2032 ($MILLION)
- TABLE 19. NORTH AMERICA AIOT PLATFORM MARKET, BY INDUSTRY VERTICAL, 2022-2032 ($MILLION)
- TABLE 20. NORTH AMERICA AIOT PLATFORM MARKET, BY COUNTRY, 2022-2032 ($MILLION)
- TABLE 21. U.S. AIOT PLATFORM MARKET, BY OFFERING, 2022-2032 ($MILLION)
- TABLE 22. U.S. AIOT PLATFORM MARKET, BY SOLUTION TYPE, 2022-2032 ($MILLION)
- TABLE 23. U.S. AIOT PLATFORM MARKET, BY INDUSTRY VERTICAL, 2022-2032 ($MILLION)
- TABLE 24. CANADA AIOT PLATFORM MARKET, BY OFFERING, 2022-2032 ($MILLION)
- TABLE 25. CANADA AIOT PLATFORM MARKET, BY SOLUTION TYPE, 2022-2032 ($MILLION)
- TABLE 26. CANADA AIOT PLATFORM MARKET, BY INDUSTRY VERTICAL, 2022-2032 ($MILLION)
- TABLE 27. EUROPE AIOT PLATFORM MARKET, BY OFFERING, 2022-2032 ($MILLION)
- TABLE 28. EUROPE AIOT PLATFORM MARKET, BY SOLUTION TYPE, 2022-2032 ($MILLION)
- TABLE 29. EUROPE AIOT PLATFORM MARKET, BY INDUSTRY VERTICAL, 2022-2032 ($MILLION)
- TABLE 30. EUROPE AIOT PLATFORM MARKET, BY COUNTRY, 2022-2032 ($MILLION)
- TABLE 31. UK AIOT PLATFORM MARKET, BY OFFERING, 2022-2032 ($MILLION)
- TABLE 32. UK AIOT PLATFORM MARKET, BY SOLUTION TYPE, 2022-2032 ($MILLION)
- TABLE 33. UK AIOT PLATFORM MARKET, BY INDUSTRY VERTICAL, 2022-2032 ($MILLION)
- TABLE 34. GERMANY AIOT PLATFORM MARKET, BY OFFERING, 2022-2032 ($MILLION)
- TABLE 35. GERMANY AIOT PLATFORM MARKET, BY SOLUTION TYPE, 2022-2032 ($MILLION)
- TABLE 36. GERMANY AIOT PLATFORM MARKET, BY INDUSTRY VERTICAL, 2022-2032 ($MILLION)
- TABLE 37. FRANCE AIOT PLATFORM MARKET, BY OFFERING, 2022-2032 ($MILLION)
- TABLE 38. FRANCE AIOT PLATFORM MARKET, BY SOLUTION TYPE, 2022-2032 ($MILLION)
- TABLE 39. FRANCE AIOT PLATFORM MARKET, BY INDUSTRY VERTICAL, 2022-2032 ($MILLION)
- TABLE 40. ITALY AIOT PLATFORM MARKET, BY OFFERING, 2022-2032 ($MILLION)
- TABLE 41. ITALY AIOT PLATFORM MARKET, BY SOLUTION TYPE, 2022-2032 ($MILLION)
- TABLE 42. ITALY AIOT PLATFORM MARKET, BY INDUSTRY VERTICAL, 2022-2032 ($MILLION)
- TABLE 43. SPAIN AIOT PLATFORM MARKET, BY OFFERING, 2022-2032 ($MILLION)
- TABLE 44. SPAIN AIOT PLATFORM MARKET, BY SOLUTION TYPE, 2022-2032 ($MILLION)
- TABLE 45. SPAIN AIOT PLATFORM MARKET, BY INDUSTRY VERTICAL, 2022-2032 ($MILLION)
- TABLE 46. REST OF EUROPE AIOT PLATFORM MARKET, BY OFFERING, 2022-2032 ($MILLION)
- TABLE 47. REST OF EUROPE AIOT PLATFORM MARKET, BY SOLUTION TYPE, 2022-2032 ($MILLION)
- TABLE 48. REST OF EUROPE AIOT PLATFORM MARKET, BY INDUSTRY VERTICAL, 2022-2032 ($MILLION)
- TABLE 49. ASIA-PACIFIC AIOT PLATFORM MARKET, BY OFFERING, 2022-2032 ($MILLION)
- TABLE 50. ASIA-PACIFIC AIOT PLATFORM MARKET, BY SOLUTION TYPE, 2022-2032 ($MILLION)
- TABLE 51. ASIA-PACIFIC AIOT PLATFORM MARKET, BY INDUSTRY VERTICAL, 2022-2032 ($MILLION)
- TABLE 52. ASIA-PACIFIC AIOT PLATFORM MARKET, BY COUNTRY, 2022-2032 ($MILLION)
- TABLE 53. CHINA AIOT PLATFORM MARKET, BY OFFERING, 2022-2032 ($MILLION)
- TABLE 54. CHINA AIOT PLATFORM MARKET, BY SOLUTION TYPE, 2022-2032 ($MILLION)
- TABLE 55. CHINA AIOT PLATFORM MARKET, BY INDUSTRY VERTICAL, 2022-2032 ($MILLION)
- TABLE 56. JAPAN AIOT PLATFORM MARKET, BY OFFERING, 2022-2032 ($MILLION)
- TABLE 57. JAPAN AIOT PLATFORM MARKET, BY SOLUTION TYPE, 2022-2032 ($MILLION)
- TABLE 58. JAPAN AIOT PLATFORM MARKET, BY INDUSTRY VERTICAL, 2022-2032 ($MILLION)
- TABLE 59. INDIA AIOT PLATFORM MARKET, BY OFFERING, 2022-2032 ($MILLION)
- TABLE 60. INDIA AIOT PLATFORM MARKET, BY SOLUTION TYPE, 2022-2032 ($MILLION)
- TABLE 61. INDIA AIOT PLATFORM MARKET, BY INDUSTRY VERTICAL, 2022-2032 ($MILLION)
- TABLE 62. AUSTRALIA AIOT PLATFORM MARKET, BY OFFERING, 2022-2032 ($MILLION)
- TABLE 63. AUSTRALIA AIOT PLATFORM MARKET, BY SOLUTION TYPE, 2022-2032 ($MILLION)
- TABLE 64. AUSTRALIA AIOT PLATFORM MARKET, BY INDUSTRY VERTICAL, 2022-2032 ($MILLION)
- TABLE 65. SOUTH KOREA AIOT PLATFORM MARKET, BY OFFERING, 2022-2032 ($MILLION)
- TABLE 66. SOUTH KOREA AIOT PLATFORM MARKET, BY SOLUTION TYPE, 2022-2032 ($MILLION)
- TABLE 67. SOUTH KOREA AIOT PLATFORM MARKET, BY INDUSTRY VERTICAL, 2022-2032 ($MILLION)
- TABLE 68. REST OF ASIA-PACIFIC AIOT PLATFORM MARKET, BY OFFERING, 2022-2032 ($MILLION)
- TABLE 69. REST OF ASIA-PACIFIC AIOT PLATFORM MARKET, BY SOLUTION TYPE, 2022-2032 ($MILLION)
- TABLE 70. REST OF ASIA-PACIFIC AIOT PLATFORM MARKET, BY INDUSTRY VERTICAL, 2022-2032 ($MILLION)
- TABLE 71. LAMEA AIOT PLATFORM MARKET, BY OFFERING, 2022-2032 ($MILLION)
- TABLE 72. LAMEA AIOT PLATFORM MARKET, BY SOLUTION TYPE, 2022-2032 ($MILLION)
- TABLE 73. LAMEA AIOT PLATFORM MARKET, BY INDUSTRY VERTICAL, 2022-2032 ($MILLION)
- TABLE 74. LAMEA AIOT PLATFORM MARKET, BY COUNTRY, 2022-2032 ($MILLION)
- TABLE 75. LATIN AMERICA AIOT PLATFORM MARKET, BY OFFERING, 2022-2032 ($MILLION)
- TABLE 76. LATIN AMERICA AIOT PLATFORM MARKET, BY SOLUTION TYPE, 2022-2032 ($MILLION)
- TABLE 77. LATIN AMERICA AIOT PLATFORM MARKET, BY INDUSTRY VERTICAL, 2022-2032 ($MILLION)
- TABLE 78. MIDDLE EAST AIOT PLATFORM MARKET, BY OFFERING, 2022-2032 ($MILLION)
- TABLE 79. MIDDLE EAST AIOT PLATFORM MARKET, BY SOLUTION TYPE, 2022-2032 ($MILLION)
- TABLE 80. MIDDLE EAST AIOT PLATFORM MARKET, BY INDUSTRY VERTICAL, 2022-2032 ($MILLION)
- TABLE 81. AFRICA AIOT PLATFORM MARKET, BY OFFERING, 2022-2032 ($MILLION)
- TABLE 82. AFRICA AIOT PLATFORM MARKET, BY SOLUTION TYPE, 2022-2032 ($MILLION)
- TABLE 83. AFRICA AIOT PLATFORM MARKET, BY INDUSTRY VERTICAL, 2022-2032 ($MILLION)
- TABLE 84. INTERNATIONAL BUSINESS MACHINES CORPORATION: KEY EXECUTIVES
- TABLE 85. INTERNATIONAL BUSINESS MACHINES CORPORATION: COMPANY SNAPSHOT
- TABLE 86. INTERNATIONAL BUSINESS MACHINES CORPORATION: PRODUCT SEGMENTS
- TABLE 87. INTERNATIONAL BUSINESS MACHINES CORPORATION: PRODUCT PORTFOLIO
- TABLE 88. INTERNATIONAL BUSINESS MACHINES CORPORATION: KEY STRATERGIES
- TABLE 89. GOOGLE LLC: KEY EXECUTIVES
- TABLE 90. GOOGLE LLC: COMPANY SNAPSHOT
- TABLE 91. GOOGLE LLC: SERVICE SEGMENTS
- TABLE 92. GOOGLE LLC: PRODUCT PORTFOLIO
- TABLE 93. GOOGLE LLC: KEY STRATERGIES
- TABLE 94. MICROSOFT CORPORATION: KEY EXECUTIVES
- TABLE 95. MICROSOFT CORPORATION: COMPANY SNAPSHOT
- TABLE 96. MICROSOFT CORPORATION: SERVICE SEGMENTS
- TABLE 97. MICROSOFT CORPORATION: PRODUCT PORTFOLIO
- TABLE 98. MICROSOFT CORPORATION: KEY STRATERGIES
- TABLE 99. ORACLE CORPORATION: KEY EXECUTIVES
- TABLE 100. ORACLE CORPORATION: COMPANY SNAPSHOT
- TABLE 101. ORACLE CORPORATION: SERVICE SEGMENTS
- TABLE 102. ORACLE CORPORATION: PRODUCT PORTFOLIO
- TABLE 103. ORACLE CORPORATION: KEY STRATERGIES
- TABLE 104. HEWLETT PACKARD ENTERPRISE DEVELOPMENT LP: KEY EXECUTIVES
- TABLE 105. HEWLETT PACKARD ENTERPRISE DEVELOPMENT LP: COMPANY SNAPSHOT
- TABLE 106. HEWLETT PACKARD ENTERPRISE DEVELOPMENT LP: SERVICE SEGMENTS
- TABLE 107. HEWLETT PACKARD ENTERPRISE DEVELOPMENT LP: PRODUCT PORTFOLIO
- TABLE 108. HEWLETT PACKARD ENTERPRISE DEVELOPMENT LP: KEY STRATERGIES
- TABLE 109. CISCO SYSTEMS INC.: KEY EXECUTIVES
- TABLE 110. CISCO SYSTEMS INC.: COMPANY SNAPSHOT
- TABLE 111. CISCO SYSTEMS INC.: SERVICE SEGMENTS
- TABLE 112. CISCO SYSTEMS INC.: PRODUCT PORTFOLIO
- TABLE 113. CISCO SYSTEMS INC.: KEY STRATERGIES
- TABLE 114. INTEL CORPORATION: KEY EXECUTIVES
- TABLE 115. INTEL CORPORATION: COMPANY SNAPSHOT
- TABLE 116. INTEL CORPORATION: SERVICE SEGMENTS
- TABLE 117. INTEL CORPORATION: PRODUCT PORTFOLIO
- TABLE 118. INTEL CORPORATION: KEY STRATERGIES
- TABLE 119. TENCENT CLOUD: KEY EXECUTIVES
- TABLE 120. TENCENT CLOUD: COMPANY SNAPSHOT
- TABLE 121. TENCENT CLOUD: SERVICE SEGMENTS
- TABLE 122. TENCENT CLOUD: PRODUCT PORTFOLIO
- TABLE 123. TENCENT CLOUD: KEY STRATERGIES
- TABLE 124. SAS INSTITUTE INC.: KEY EXECUTIVES
- TABLE 125. SAS INSTITUTE INC.: COMPANY SNAPSHOT
- TABLE 126. SAS INSTITUTE INC.: SERVICE SEGMENTS
- TABLE 127. SAS INSTITUTE INC.: PRODUCT PORTFOLIO
- TABLE 128. SAS INSTITUTE INC.: KEY STRATERGIES
- TABLE 129. SAP SE: KEY EXECUTIVES
- TABLE 130. SAP SE: COMPANY SNAPSHOT
- TABLE 131. SAP SE: SERVICE SEGMENTS
- TABLE 132. SAP SE: PRODUCT PORTFOLIO
- TABLE 133. SAP SE: KEY STRATERGIES
LIST OF FIGURES
- FIGURE 01. AIOT PLATFORM MARKET, 2022-2032
- FIGURE 02. SEGMENTATION OF AIOT PLATFORM MARKET, 2022-2032
- FIGURE 03. TOP INVESTMENT POCKETS IN AIOT PLATFORM MARKET (2023-2032)
- FIGURE 04. LOW BARGAINING POWER OF SUPPLIERS
- FIGURE 05. LOW BARGAINING POWER OF BUYERS
- FIGURE 06. LOW THREAT OF SUBSTITUTES
- FIGURE 07. LOW THREAT OF NEW ENTRANTS
- FIGURE 08. LOW INTENSITY OF RIVALRY
- FIGURE 09. DRIVERS, RESTRAINTS AND OPPORTUNITIES: GLOBALAIOT PLATFORM MARKET
- FIGURE 10. AIOT PLATFORM MARKET, BY OFFERING, 2022(%)
- FIGURE 11. COMPARATIVE SHARE ANALYSIS OF AIOT PLATFORM MARKET FOR SOLUTION, BY COUNTRY 2022 AND 2032(%)
- FIGURE 12. COMPARATIVE SHARE ANALYSIS OF AIOT PLATFORM MARKET FOR SERVICES, BY COUNTRY 2022 AND 2032(%)
- FIGURE 13. AIOT PLATFORM MARKET, BY SOLUTION TYPE, 2022(%)
- FIGURE 14. COMPARATIVE SHARE ANALYSIS OF AIOT PLATFORM MARKET FOR DEVICE MANAGEMENT, BY COUNTRY 2022 AND 2032(%)
- FIGURE 15. COMPARATIVE SHARE ANALYSIS OF AIOT PLATFORM MARKET FOR APPLICATION MANAGEMENT, BY COUNTRY 2022 AND 2032(%)
- FIGURE 16. COMPARATIVE SHARE ANALYSIS OF AIOT PLATFORM MARKET FOR CONNECTIVITY MANAGEMENT, BY COUNTRY 2022 AND 2032(%)
- FIGURE 17. AIOT PLATFORM MARKET, BY INDUSTRY VERTICAL, 2022(%)
- FIGURE 18. COMPARATIVE SHARE ANALYSIS OF AIOT PLATFORM MARKET FOR MANUFACTURING, BY COUNTRY 2022 AND 2032(%)
- FIGURE 19. COMPARATIVE SHARE ANALYSIS OF AIOT PLATFORM MARKET FOR BFSI, BY COUNTRY 2022 AND 2032(%)
- FIGURE 20. COMPARATIVE SHARE ANALYSIS OF AIOT PLATFORM MARKET FOR HEALTHCARE, BY COUNTRY 2022 AND 2032(%)
- FIGURE 21. COMPARATIVE SHARE ANALYSIS OF AIOT PLATFORM MARKET FOR RETAIL, BY COUNTRY 2022 AND 2032(%)
- FIGURE 22. COMPARATIVE SHARE ANALYSIS OF AIOT PLATFORM MARKET FOR ENERGY AND UTILITIES, BY COUNTRY 2022 AND 2032(%)
- FIGURE 23. COMPARATIVE SHARE ANALYSIS OF AIOT PLATFORM MARKET FOR TRANSPORTATION AND LOGISTICS, BY COUNTRY 2022 AND 2032(%)
- FIGURE 24. COMPARATIVE SHARE ANALYSIS OF AIOT PLATFORM MARKET FOR OTHERS, BY COUNTRY 2022 AND 2032(%)
- FIGURE 25. AIOT PLATFORM MARKET BY REGION, 2022
- FIGURE 26. U.S. AIOT PLATFORM MARKET, 2022-2032 ($MILLION)
- FIGURE 27. CANADA AIOT PLATFORM MARKET, 2022-2032 ($MILLION)
- FIGURE 28. UK AIOT PLATFORM MARKET, 2022-2032 ($MILLION)
- FIGURE 29. GERMANY AIOT PLATFORM MARKET, 2022-2032 ($MILLION)
- FIGURE 30. FRANCE AIOT PLATFORM MARKET, 2022-2032 ($MILLION)
- FIGURE 31. ITALY AIOT PLATFORM MARKET, 2022-2032 ($MILLION)
- FIGURE 32. SPAIN AIOT PLATFORM MARKET, 2022-2032 ($MILLION)
- FIGURE 33. REST OF EUROPE AIOT PLATFORM MARKET, 2022-2032 ($MILLION)
- FIGURE 34. CHINA AIOT PLATFORM MARKET, 2022-2032 ($MILLION)
- FIGURE 35. JAPAN AIOT PLATFORM MARKET, 2022-2032 ($MILLION)
- FIGURE 36. INDIA AIOT PLATFORM MARKET, 2022-2032 ($MILLION)
- FIGURE 37. AUSTRALIA AIOT PLATFORM MARKET, 2022-2032 ($MILLION)
- FIGURE 38. SOUTH KOREA AIOT PLATFORM MARKET, 2022-2032 ($MILLION)
- FIGURE 39. REST OF ASIA-PACIFIC AIOT PLATFORM MARKET, 2022-2032 ($MILLION)
- FIGURE 40. LATIN AMERICA AIOT PLATFORM MARKET, 2022-2032 ($MILLION)
- FIGURE 41. MIDDLE EAST AIOT PLATFORM MARKET, 2022-2032 ($MILLION)
- FIGURE 42. AFRICA AIOT PLATFORM MARKET, 2022-2032 ($MILLION)
- FIGURE 43. TOP WINNING STRATEGIES, BY YEAR
- FIGURE 44. TOP WINNING STRATEGIES, BY DEVELOPMENT
- FIGURE 45. TOP WINNING STRATEGIES, BY COMPANY
- FIGURE 46. PRODUCT MAPPING OF TOP 10 PLAYERS
- FIGURE 47. COMPETITIVE DASHBOARD
- FIGURE 48. COMPETITIVE HEATMAP: AIOT PLATFORM MARKET
- FIGURE 49. TOP PLAYER POSITIONING, 2022
- FIGURE 50. INTERNATIONAL BUSINESS MACHINES CORPORATION: NET REVENUE, 2019-2021 ($MILLION)
- FIGURE 51. INTERNATIONAL BUSINESS MACHINES CORPORATION: RESEARCH & DEVELOPMENT EXPENDITURE, 2019-2021 ($MILLION
- FIGURE 52. INTERNATIONAL BUSINESS MACHINES CORPORATION: REVENUE SHARE BY SEGMENT, 2021 (%)
- FIGURE 53. INTERNATIONAL BUSINESS MACHINES CORPORATION: REVENUE SHARE BY REGION, 2021 (%)
- FIGURE 54. GOOGLE LLC: RESEARCH & DEVELOPMENT EXPENDITURE, 2019-2021 ($MILLION)
- FIGURE 55. GOOGLE LLC: NET REVENUE, 2019-2021 ($MILLION)
- FIGURE 56. GOOGLE LLC: REVENUE SHARE BY SEGMENT, 2021 (%)
- FIGURE 57. GOOGLE LLC: REVENUE SHARE BY REGION, 2021 (%)
- FIGURE 58. MICROSOFT CORPORATION.: NET REVENUE, 2019-2021 ($MILLION)
- FIGURE 59. MICROSOFT CORPORATION.: RESEARCH & DEVELOPMENT EXPENDITURE, 2019-2021 ($MILLION)
- FIGURE 60. MICROSOFT CORPORATION.: REVENUE SHARE BY SEGMENT, 2021 (%)
- FIGURE 61. MICROSOFT CORPORATION.: REVENUE SHARE BY REGION, 2021 (%)
- FIGURE 62. ORACLE CORPORATION.: RESEARCH & DEVELOPMENT EXPENDITURE, 2020-2022 ($MILLION)
- FIGURE 63. ORACLE CORPORATION.: NET REVENUE, 2020-2022 ($MILLION)
- FIGURE 64. ORACLE CORPORATION.: REVENUE SHARE BY SEGMENT, 2022 (%)
- FIGURE 65. ORACLE CORPORATION.: REVENUE SHARE BY REGION, 2022 (%)
- FIGURE 66. HEWLETT PACKARD ENTERPRISE DEVELOPMENT LP: NET REVENUE, 2019-2021 ($MILLION)
- FIGURE 67. HEWLETT PACKARD ENTERPRISE DEVELOPMENT LP: REVENUE SHARE BY SEGMENT, 2021 (%)
- FIGURE 68. HEWLETT PACKARD ENTERPRISE DEVELOPMENT LP: REVENUE SHARE BY REGION, 2021 (%)
- FIGURE 69. CISCO SYSTEMS INC.: NET REVENUE, 2019-2021 ($MILLION)
- FIGURE 70. CISCO SYSTEMS INC.: RESEARCH & DEVELOPMENT EXPENDITURE, 2019-2021 ($MILLION)
- FIGURE 71. CISCO SYSTEMS INC.: REVENUE SHARE BY SEGMENT, 2021 (%)
- FIGURE 72. CISCO SYSTEMS INC.: REVENUE SHARE BY REGION, 2021 (%)
- FIGURE 73. INTEL CORPORATION: RESEARCH & DEVELOPMENT EXPENDITURE, 2019-2021 ($MILLION)
- FIGURE 74. INTEL CORPORATION: NET REVENUE, 2019-2021 ($MILLION)
- FIGURE 75. INTEL CORPORATION: REVENUE SHARE BY SEGMENT, 2021 (%)
- FIGURE 76. INTEL CORPORATION: REVENUE SHARE BY REGION, 2021 (%)
- FIGURE 77. SAP SE: NET REVENUE, 2020-2022 ($MILLION)
- FIGURE 78. SAP SE: RESEARCH & DEVELOPMENT EXPENDITURE, 2020-2022 ($MILLION)
- FIGURE 79. SAP SE: REVENUE SHARE BY SEGMENT, 2022 (%)
- FIGURE 80. SAP SE: REVENUE SHARE BY REGION, 2022 (%)
According to a new report published by Allied Market Research, titled, "AIoT Platform Market," The aiot platform market was valued at $4.7 billion in 2022, and is estimated to reach $129.2 billion by 2032, growing at a CAGR of 39.5% from 2023 to 2032.
The combination of AI and IoT has the potential to create several benefits for businesses and consumers alike. An AIoT platform can help to improve efficiency and productivity for businesses, as well as reduce costs. Moreover, it can provide enhanced convenience and a better user experience for consumers. In addition, the use of AI in conjunction with the IoT can help to improve data management and analytics, as well as providing businesses with a better understanding of their products. Such an enhanced factors are expected to provide lucrative opportunities for market growth during the forecast period.
Factors such as growth in digitalization, rise in need for intelligent transportation systems, and increase in adoption of advanced technologies positively impact the growth of the market. In addition, rise in adoption of IoT devices, advancements in AI technology, and growth in demand for automation are expected to fuel the growth of the market during the forecast period. Furthermore, expansion of AIoT applications in various industries such as healthcare, agriculture, and retail, are expected to provide lucrative growth opportunities for the market in the upcoming years. Moreover, development of edge computing technology to enable real-time processing of data and reduce latency and adoption of cloud computing to enable scalability, flexibility, and cost-effectiveness of AIoT systems are anticipated to create lucrative opportunities for the market growth. However, data privacy & security concerns and lack of standardization in data formats, communication protocols, & network are expected to hamper the market growth.
On the basis of offering, the global AIoT platform market share was dominated by the solution segment in 2022 and is expected to maintain its dominance in the upcoming years. Owing to advances in technologies enabling AIoT platform to transform industries globally, from BFSI, to manufacturing, healthcare, and others. However, the services segment is expected to witness the highest growth, as AIoT platform services reduce the time and costs associated with optimizing systems in the initial phase of deployment.
By region, North America dominated the market share in 2022 for the AIoT platform market. The increasing investment in advanced technologies such as cloud-based services, AI, ML, business analytics solution and IoT to improve businesses and the customer experience are anticipated to propel the growth of the AIoT platform market. However, Asia-Pacific is expected to exhibit the highest growth during the forecast period. This is attributed to the increase in penetration of digitalization and higher adoption of advanced technology are expected to provide lucrative growth opportunities for the market in this region.
- Top Impacting Factors
- Surge in demand for automation.:
- The surge in demand for automation in artificial intelligence of things (AIoT) is driven by the need for intelligent systems that can operate and make decisions independently without human intervention. This is further attributed to AIoT platform and services that are being used to automate industrial processes, such as manufacturing, by integrating AI algorithms with sensors, robots, and other devices. As a result, this enables machines to operate autonomously, reducing the need for human intervention and improving efficiency.
- Moreover, automation in AIoT increases efficiency, reduces costs, and improves accuracy. Thus, by automating routine tasks, such as data collection and analysis, companies can free up valuable time and resources to focus on more complex tasks. Automation with AIoT also helps to reduce the risk of human error and improves the reliability of data analysis. Therefore, demand for automation in AIoT increases as more devices become connected to the internet and the amount of data generated continues to increase. As a result, key players in the market adopted strategies such as partnership and collaboration to strengthen their market position. For instance, in May 2022, Advantech partnered with Hivecell for continued artificial intelligence of things (AIoT) development. The partnership of Advantech and Hivecell simplifies common customer challenges in digital transformation by making IoT data more attainable, scalable and manageable. Such collaborations and partnership boost the growth of AIoT market.
- Rise in demand for predictive maintenance:
- Rise in demand for AIoT in predictive maintenance service has increased. This is attributed to the use of data and analytics to predict when a piece of equipment is likely to fail, allowing companies to take proactive measures to prevent downtime and reduce maintenance costs. In addition, the use of predictive maintenance in AIoT is particularly important for organizations that rely heavily on equipment or machinery, such as manufacturing or transportation companies. Thus, by leveraging data from IoT devices and applying machine learning algorithms, companies gain insights into the health and performance of their equipment in real-time, allowing them to identify potential issues before they occur.
- Moreover, by being able to predict when equipment is likely to fail, companies can schedule maintenance during downtime or off-peak hours, reducing the impact on production and minimizing the risk of accidents. As a result, key players in the market adopted strategies such as product development, partnership and collaboration to enhance their services in AIoT market. For instance, in February 2023, BrainChip Holdings Ltd producer of ultra-low power, fully digital, event-based, neuromorphic AI IP, partnered with AI Labs to provide predictive maintenance through AIoT and to collaborate on next-generation application development leveraging the Minsky AI Engine. Such partnerships and developments have fueled the growth of AIoT market.
Key Benefits For Stakeholders
- This report provides a quantitative analysis of the market segments, current trends, estimations, and dynamics of the aiot platform market analysis from 2022 to 2032 to identify the prevailing aiot platform market opportunities.
- The market research is offered along with information related to key drivers, restraints, and opportunities.
- Porter's five forces analysis highlights the potency of buyers and suppliers to enable stakeholders make profit-oriented business decisions and strengthen their supplier-buyer network.
- In-depth analysis of the aiot platform market segmentation assists to determine the prevailing market opportunities.
- Major countries in each region are mapped according to their revenue contribution to the global market.
- Market player positioning facilitates benchmarking and provides a clear understanding of the present position of the market players.
- The report includes the analysis of the regional as well as global aiot platform market trends, key players, market segments, application areas, and market growth strategies.
Key Market Segments
By Solution Type
- Connectivity Management
- Device Management
- Application Management
By Offering
- Solution
- Services
By Industry Vertical
- Manufacturing
- BFSI
- Healthcare
- Retail
- Energy and Utilities
- Transportation and Logistics
- Others
By Region
- North America
- U.S.
- Canada
- Europe
- UK
- Germany
- France
- Italy
- Spain
- Rest of Europe
- Asia-Pacific
- China
- Japan
- India
- Australia
- South Korea
- Rest of Asia-Pacific
- LAMEA
- Latin America
- Middle East
- Africa
Key Market Players:
- Cisco Systems Inc.
- SAS Institute Inc.
- International Business Machines Corporation
- tencent cloud
- Google LLC
- Intel Corporation
- SAP SE
- Microsoft Corporation
- Hewlett Packard Enterprise Development LP
- Oracle Corporation
TABLE OF CONTENTS
CHAPTER 1: INTRODUCTION
- 1.1. Report description
- 1.2. Key market segments
- 1.3. Key benefits to the stakeholders
- 1.4. Research Methodology
- 1.4.1. Primary research
- 1.4.2. Secondary research
- 1.4.3. Analyst tools and models
CHAPTER 2: EXECUTIVE SUMMARY
- 2.1. CXO Perspective
CHAPTER 3: MARKET OVERVIEW
- 3.1. Market definition and scope
- 3.2. Key findings
- 3.2.1. Top impacting factors
- 3.2.2. Top investment pockets
- 3.3. Porter's five forces analysis
- 3.3.1. Bargaining power of suppliers
- 3.3.2. Bargaining power of buyers
- 3.3.3. Threat of substitutes
- 3.3.4. Threat of new entrants
- 3.3.5. Intensity of rivalry
- 3.4. Market dynamics
- 3.4.1. Drivers
- 3.4.1.1. Surge in demand for automation
- 3.4.1.2. Increase in demand for predictive maintenance
- 3.4.1.3. Growing need for intelligent transportation systems driver
- 3.4.1. Drivers
- 3.4.2. Restraints
- 3.4.2.1. Data privacy and security concerns
- 3.4.2.2. High cost of implementation and maintenance of AIoT solutions
- 3.4.3. Opportunities
- 3.4.3.1. Expansion of AIoT applications in various industries such as healthcare, agriculture, and retail
- 3.5. COVID-19 Impact Analysis on the market
CHAPTER 4: AIOT PLATFORM MARKET, BY OFFERING
- 4.1. Overview
- 4.1.1. Market size and forecast
- 4.2. Solution
- 4.2.1. Key market trends, growth factors and opportunities
- 4.2.2. Market size and forecast, by region
- 4.2.3. Market share analysis by country
- 4.3. Services
- 4.3.1. Key market trends, growth factors and opportunities
- 4.3.2. Market size and forecast, by region
- 4.3.3. Market share analysis by country
CHAPTER 5: AIOT PLATFORM MARKET, BY SOLUTION TYPE
- 5.1. Overview
- 5.1.1. Market size and forecast
- 5.2. Device Management
- 5.2.1. Key market trends, growth factors and opportunities
- 5.2.2. Market size and forecast, by region
- 5.2.3. Market share analysis by country
- 5.3. Application Management
- 5.3.1. Key market trends, growth factors and opportunities
- 5.3.2. Market size and forecast, by region
- 5.3.3. Market share analysis by country
- 5.4. Connectivity Management
- 5.4.1. Key market trends, growth factors and opportunities
- 5.4.2. Market size and forecast, by region
- 5.4.3. Market share analysis by country
CHAPTER 6: AIOT PLATFORM MARKET, BY INDUSTRY VERTICAL
- 6.1. Overview
- 6.1.1. Market size and forecast
- 6.2. Manufacturing
- 6.2.1. Key market trends, growth factors and opportunities
- 6.2.2. Market size and forecast, by region
- 6.2.3. Market share analysis by country
- 6.3. BFSI
- 6.3.1. Key market trends, growth factors and opportunities
- 6.3.2. Market size and forecast, by region
- 6.3.3. Market share analysis by country
- 6.4. Healthcare
- 6.4.1. Key market trends, growth factors and opportunities
- 6.4.2. Market size and forecast, by region
- 6.4.3. Market share analysis by country
- 6.5. Retail
- 6.5.1. Key market trends, growth factors and opportunities
- 6.5.2. Market size and forecast, by region
- 6.5.3. Market share analysis by country
- 6.6. Energy and Utilities
- 6.6.1. Key market trends, growth factors and opportunities
- 6.6.2. Market size and forecast, by region
- 6.6.3. Market share analysis by country
- 6.7. Transportation and Logistics
- 6.7.1. Key market trends, growth factors and opportunities
- 6.7.2. Market size and forecast, by region
- 6.7.3. Market share analysis by country
- 6.8. Others
- 6.8.1. Key market trends, growth factors and opportunities
- 6.8.2. Market size and forecast, by region
- 6.8.3. Market share analysis by country
CHAPTER 7: AIOT PLATFORM MARKET, BY REGION
- 7.1. Overview
- 7.1.1. Market size and forecast By Region
- 7.2. North America
- 7.2.1. Key trends and opportunities
- 7.2.2. Market size and forecast, by Offering
- 7.2.3. Market size and forecast, by Solution Type
- 7.2.4. Market size and forecast, by Industry Vertical
- 7.2.5. Market size and forecast, by country
- 7.2.5.1. U.S.
- 7.2.5.1.1. Key market trends, growth factors and opportunities
- 7.2.5.1.2. Market size and forecast, by Offering
- 7.2.5.1.3. Market size and forecast, by Solution Type
- 7.2.5.1.4. Market size and forecast, by Industry Vertical
- 7.2.5.2. Canada
- 7.2.5.2.1. Key market trends, growth factors and opportunities
- 7.2.5.2.2. Market size and forecast, by Offering
- 7.2.5.2.3. Market size and forecast, by Solution Type
- 7.2.5.2.4. Market size and forecast, by Industry Vertical
- 7.3. Europe
- 7.3.1. Key trends and opportunities
- 7.3.2. Market size and forecast, by Offering
- 7.3.3. Market size and forecast, by Solution Type
- 7.3.4. Market size and forecast, by Industry Vertical
- 7.3.5. Market size and forecast, by country
- 7.3.5.1. UK
- 7.3.5.1.1. Key market trends, growth factors and opportunities
- 7.3.5.1.2. Market size and forecast, by Offering
- 7.3.5.1.3. Market size and forecast, by Solution Type
- 7.3.5.1.4. Market size and forecast, by Industry Vertical
- 7.3.5.2. Germany
- 7.3.5.2.1. Key market trends, growth factors and opportunities
- 7.3.5.2.2. Market size and forecast, by Offering
- 7.3.5.2.3. Market size and forecast, by Solution Type
- 7.3.5.2.4. Market size and forecast, by Industry Vertical
- 7.3.5.3. France
- 7.3.5.3.1. Key market trends, growth factors and opportunities
- 7.3.5.3.2. Market size and forecast, by Offering
- 7.3.5.3.3. Market size and forecast, by Solution Type
- 7.3.5.3.4. Market size and forecast, by Industry Vertical
- 7.3.5.4. Italy
- 7.3.5.4.1. Key market trends, growth factors and opportunities
- 7.3.5.4.2. Market size and forecast, by Offering
- 7.3.5.4.3. Market size and forecast, by Solution Type
- 7.3.5.4.4. Market size and forecast, by Industry Vertical
- 7.3.5.5. Spain
- 7.3.5.5.1. Key market trends, growth factors and opportunities
- 7.3.5.5.2. Market size and forecast, by Offering
- 7.3.5.5.3. Market size and forecast, by Solution Type
- 7.3.5.5.4. Market size and forecast, by Industry Vertical
- 7.3.5.6. Rest of Europe
- 7.3.5.6.1. Key market trends, growth factors and opportunities
- 7.3.5.6.2. Market size and forecast, by Offering
- 7.3.5.6.3. Market size and forecast, by Solution Type
- 7.3.5.6.4. Market size and forecast, by Industry Vertical
- 7.4. Asia-Pacific
- 7.4.1. Key trends and opportunities
- 7.4.2. Market size and forecast, by Offering
- 7.4.3. Market size and forecast, by Solution Type
- 7.4.4. Market size and forecast, by Industry Vertical
- 7.4.5. Market size and forecast, by country
- 7.4.5.1. China
- 7.4.5.1.1. Key market trends, growth factors and opportunities
- 7.4.5.1.2. Market size and forecast, by Offering
- 7.4.5.1.3. Market size and forecast, by Solution Type
- 7.4.5.1.4. Market size and forecast, by Industry Vertical
- 7.4.5.2. Japan
- 7.4.5.2.1. Key market trends, growth factors and opportunities
- 7.4.5.2.2. Market size and forecast, by Offering
- 7.4.5.2.3. Market size and forecast, by Solution Type
- 7.4.5.2.4. Market size and forecast, by Industry Vertical
- 7.4.5.3. India
- 7.4.5.3.1. Key market trends, growth factors and opportunities
- 7.4.5.3.2. Market size and forecast, by Offering
- 7.4.5.3.3. Market size and forecast, by Solution Type
- 7.4.5.3.4. Market size and forecast, by Industry Vertical
- 7.4.5.4. Australia
- 7.4.5.4.1. Key market trends, growth factors and opportunities
- 7.4.5.4.2. Market size and forecast, by Offering
- 7.4.5.4.3. Market size and forecast, by Solution Type
- 7.4.5.4.4. Market size and forecast, by Industry Vertical
- 7.4.5.5. South Korea
- 7.4.5.5.1. Key market trends, growth factors and opportunities
- 7.4.5.5.2. Market size and forecast, by Offering
- 7.4.5.5.3. Market size and forecast, by Solution Type
- 7.4.5.5.4. Market size and forecast, by Industry Vertical
- 7.4.5.6. Rest of Asia-Pacific
- 7.4.5.6.1. Key market trends, growth factors and opportunities
- 7.4.5.6.2. Market size and forecast, by Offering
- 7.4.5.6.3. Market size and forecast, by Solution Type
- 7.4.5.6.4. Market size and forecast, by Industry Vertical
- 7.5. LAMEA
- 7.5.1. Key trends and opportunities
- 7.5.2. Market size and forecast, by Offering
- 7.5.3. Market size and forecast, by Solution Type
- 7.5.4. Market size and forecast, by Industry Vertical
- 7.5.5. Market size and forecast, by country
- 7.5.5.1. Latin America
- 7.5.5.1.1. Key market trends, growth factors and opportunities
- 7.5.5.1.2. Market size and forecast, by Offering
- 7.5.5.1.3. Market size and forecast, by Solution Type
- 7.5.5.1.4. Market size and forecast, by Industry Vertical
- 7.5.5.2. Middle East
- 7.5.5.2.1. Key market trends, growth factors and opportunities
- 7.5.5.2.2. Market size and forecast, by Offering
- 7.5.5.2.3. Market size and forecast, by Solution Type
- 7.5.5.2.4. Market size and forecast, by Industry Vertical
- 7.5.5.3. Africa
- 7.5.5.3.1. Key market trends, growth factors and opportunities
- 7.5.5.3.2. Market size and forecast, by Offering
- 7.5.5.3.3. Market size and forecast, by Solution Type
- 7.5.5.3.4. Market size and forecast, by Industry Vertical
CHAPTER 8: COMPETITIVE LANDSCAPE
- 8.1. Introduction
- 8.2. Top winning strategies
- 8.3. Product Mapping of Top 10 Player
- 8.4. Competitive Dashboard
- 8.5. Competitive Heatmap
- 8.6. Top player positioning, 2022
CHAPTER 9: COMPANY PROFILES
- 9.1. International Business Machines Corporation
- 9.1.1. Company overview
- 9.1.2. Key Executives
- 9.1.3. Company snapshot
- 9.1.4. Operating business segments
- 9.1.5. Product portfolio
- 9.1.6. Business performance
- 9.1.7. Key strategic moves and developments
- 9.2. Google LLC
- 9.2.1. Company overview
- 9.2.2. Key Executives
- 9.2.3. Company snapshot
- 9.2.4. Operating business segments
- 9.2.5. Product portfolio
- 9.2.6. Business performance
- 9.2.7. Key strategic moves and developments
- 9.3. Microsoft Corporation
- 9.3.1. Company overview
- 9.3.2. Key Executives
- 9.3.3. Company snapshot
- 9.3.4. Operating business segments
- 9.3.5. Product portfolio
- 9.3.6. Business performance
- 9.3.7. Key strategic moves and developments
- 9.4. Oracle Corporation
- 9.4.1. Company overview
- 9.4.2. Key Executives
- 9.4.3. Company snapshot
- 9.4.4. Operating business segments
- 9.4.5. Product portfolio
- 9.4.6. Business performance
- 9.4.7. Key strategic moves and developments
- 9.5. Hewlett Packard Enterprise Development LP
- 9.5.1. Company overview
- 9.5.2. Key Executives
- 9.5.3. Company snapshot
- 9.5.4. Operating business segments
- 9.5.5. Product portfolio
- 9.5.6. Business performance
- 9.5.7. Key strategic moves and developments
- 9.6. Cisco Systems Inc.
- 9.6.1. Company overview
- 9.6.2. Key Executives
- 9.6.3. Company snapshot
- 9.6.4. Operating business segments
- 9.6.5. Product portfolio
- 9.6.6. Business performance
- 9.6.7. Key strategic moves and developments
- 9.7. Intel Corporation
- 9.7.1. Company overview
- 9.7.2. Key Executives
- 9.7.3. Company snapshot
- 9.7.4. Operating business segments
- 9.7.5. Product portfolio
- 9.7.6. Business performance
- 9.7.7. Key strategic moves and developments
- 9.8. tencent cloud
- 9.8.1. Company overview
- 9.8.2. Key Executives
- 9.8.3. Company snapshot
- 9.8.4. Operating business segments
- 9.8.5. Product portfolio
- 9.8.6. Key strategic moves and developments
- 9.9. SAS Institute Inc.
- 9.9.1. Company overview
- 9.9.2. Key Executives
- 9.9.3. Company snapshot
- 9.9.4. Operating business segments
- 9.9.5. Product portfolio
- 9.9.6. Key strategic moves and developments
- 9.10. SAP SE
- 9.10.1. Company overview
- 9.10.2. Key Executives
- 9.10.3. Company snapshot
- 9.10.4. Operating business segments
- 9.10.5. Product portfolio
- 9.10.6. Business performance
- 9.10.7. Key strategic moves and developments