
|
市場調査レポート
商品コード
1344340
電子仲介市場:サービスプロバイダー別、所有者別、エンドユーザー別:世界の機会分析と産業予測、2023-2032年E-Brokerage Market By Service Provider (Full Time Broker, Discounted Broker), By Ownership (Privately Held, Publicly Held), By End User (Retail Investor, Institutional Investor): Global Opportunity Analysis and Industry Forecast, 2023-2032 |
||||||
|
|||||||

| 電子仲介市場:サービスプロバイダー別、所有者別、エンドユーザー別:世界の機会分析と産業予測、2023-2032年 |
|
出版日: 2023年06月01日
発行: Allied Market Research
ページ情報: 英文 214 Pages
納期: 2~3営業日
|

- 全表示
- 概要
- 図表
- 目次
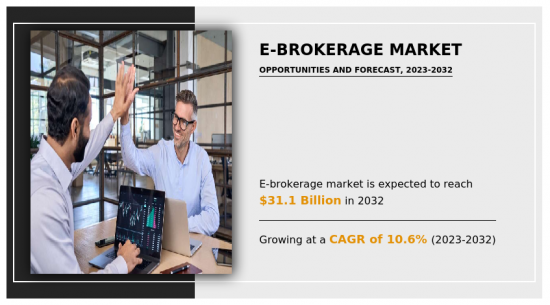
Allied Market Research発行の最新レポート「電子仲介市場」によると、電子仲介市場の2022年の市場規模は117億米ドルで、2032年には311億米ドルに達し、2023年から2032年までのCAGRは10.6%で成長すると推定されています。
電子仲介市場の主な促進要因の1つは、オンライン取引プラットフォームが提供する利便性です。電子仲介を利用すれば、投資家はブローカーのオフィスに出向くことなく、自宅やオフィスから簡単に証券を売買できます。この利便性により、従来は伝統的なブローカー・サービスを利用できなかった個人投資家にとっても、オンライン取引がより身近なものとなっています。さらに、インターネットの普及率が高まっていることも、電子仲介市場を大きく牽引しています。加えて、デジタル化とインターネット利用の拡大に伴い、オンライン証券業界は大きな成長を遂げてきました。しかし、セキュリティ上の懸念、規制上の問題、投資家の意識の低さなどが市場成長を妨げる要因となっています。それとは逆に、モバイル取引プラットフォームの採用増加や、人工知能、機械学習、ビッグデータ分析といった新技術の開発は、今後数年間、電子仲介市場の成長に新たな機会をもたらすと予想されます。これらのテクノロジーは、電子仲介会社が顧客にパーソナライズされた投資推奨、リスク管理の改善、取引処理の高速化など、より優れたサービスを提供するのに役立ちます。
目次
第1章 イントロダクション
第2章 エグゼクティブサマリー
第3章 市場概要
- 市場の定義と範囲
- 主な調査結果
- 影響要因
- 主な投資機会
- ポーターのファイブフォース分析
- 供給企業の交渉力
- 買い手の交渉力
- 代替品の脅威
- 新規参入業者の脅威
- 競合の激しさ
- 市場力学
- 促進要因
- 電子仲介・プラットフォームの利便性と費用対効果
- デジタル化の急速な進展
- 顧客の嗜好の変化
- インターネット普及率の増加
- 抑制要因
- セキュリティ上の懸念と規制上の問題
- 投資家の意識の低下
- 機会
- モバイル取引プラットフォームの採用増加
- 技術の進歩
- 促進要因
- COVID-19による市場への影響分析
第4章 電子仲介市場:サービスプロバイダー別
- フルタイム・ブローカー
- 割引ブローカー
第5章 電子仲介市場:所有者別
- 個人所有
- 株式公開
第6章 電子仲介市場:エンドユーザー別
- 個人投資家
- 機関投資家
第7章 電子仲介市場:地域別
- 北米
- 米国
- カナダ
- 欧州
- 英国
- ドイツ
- フランス
- イタリア
- スペイン
- その他欧州
- アジア太平洋
- 中国
- 日本
- インド
- オーストラリア
- 韓国
- その他アジア太平洋地域
- ラテンアメリカ
- ラテンアメリカ
- 中東
- アフリカ
第8章 競合情勢
- イントロダクション
- 主要成功戦略
- 主要10社の製品マッピング
- 競合ダッシュボード
- 競合ヒートマップ
- 主要企業のポジショニング、2022年
第9章 企業プロファイル
- Charles Schwab and Co.
- FMR LLC
- E-trade
- Interactive Brokers LLC.
- eToro
- FP Markets
- eOption
- TastyTrade, Inc.
- XTB
- TD Ameritrade
LIST OF TABLES
- TABLE 01. GLOBAL E-BROKERAGE MARKET, BY SERVICE PROVIDER, 2022-2032 ($MILLION)
- TABLE 02. E-BROKERAGE MARKET FOR FULL TIME BROKER, BY REGION, 2022-2032 ($MILLION)
- TABLE 03. E-BROKERAGE MARKET FOR DISCOUNTED BROKER, BY REGION, 2022-2032 ($MILLION)
- TABLE 04. GLOBAL E-BROKERAGE MARKET, BY OWNERSHIP, 2022-2032 ($MILLION)
- TABLE 05. E-BROKERAGE MARKET FOR PRIVATELY HELD, BY REGION, 2022-2032 ($MILLION)
- TABLE 06. E-BROKERAGE MARKET FOR PUBLICLY HELD, BY REGION, 2022-2032 ($MILLION)
- TABLE 07. GLOBAL E-BROKERAGE MARKET, BY END USER, 2022-2032 ($MILLION)
- TABLE 08. E-BROKERAGE MARKET FOR RETAIL INVESTOR, BY REGION, 2022-2032 ($MILLION)
- TABLE 09. E-BROKERAGE MARKET FOR INSTITUTIONAL INVESTOR, BY REGION, 2022-2032 ($MILLION)
- TABLE 10. E-BROKERAGE MARKET, BY REGION, 2022-2032 ($MILLION)
- TABLE 11. NORTH AMERICA E-BROKERAGE MARKET, BY SERVICE PROVIDER, 2022-2032 ($MILLION)
- TABLE 12. NORTH AMERICA E-BROKERAGE MARKET, BY OWNERSHIP, 2022-2032 ($MILLION)
- TABLE 13. NORTH AMERICA E-BROKERAGE MARKET, BY END USER, 2022-2032 ($MILLION)
- TABLE 14. NORTH AMERICA E-BROKERAGE MARKET, BY COUNTRY, 2022-2032 ($MILLION)
- TABLE 15. U.S. E-BROKERAGE MARKET, BY SERVICE PROVIDER, 2022-2032 ($MILLION)
- TABLE 16. U.S. E-BROKERAGE MARKET, BY OWNERSHIP, 2022-2032 ($MILLION)
- TABLE 17. U.S. E-BROKERAGE MARKET, BY END USER, 2022-2032 ($MILLION)
- TABLE 18. CANADA E-BROKERAGE MARKET, BY SERVICE PROVIDER, 2022-2032 ($MILLION)
- TABLE 19. CANADA E-BROKERAGE MARKET, BY OWNERSHIP, 2022-2032 ($MILLION)
- TABLE 20. CANADA E-BROKERAGE MARKET, BY END USER, 2022-2032 ($MILLION)
- TABLE 21. EUROPE E-BROKERAGE MARKET, BY SERVICE PROVIDER, 2022-2032 ($MILLION)
- TABLE 22. EUROPE E-BROKERAGE MARKET, BY OWNERSHIP, 2022-2032 ($MILLION)
- TABLE 23. EUROPE E-BROKERAGE MARKET, BY END USER, 2022-2032 ($MILLION)
- TABLE 24. EUROPE E-BROKERAGE MARKET, BY COUNTRY, 2022-2032 ($MILLION)
- TABLE 25. UK E-BROKERAGE MARKET, BY SERVICE PROVIDER, 2022-2032 ($MILLION)
- TABLE 26. UK E-BROKERAGE MARKET, BY OWNERSHIP, 2022-2032 ($MILLION)
- TABLE 27. UK E-BROKERAGE MARKET, BY END USER, 2022-2032 ($MILLION)
- TABLE 28. GERMANY E-BROKERAGE MARKET, BY SERVICE PROVIDER, 2022-2032 ($MILLION)
- TABLE 29. GERMANY E-BROKERAGE MARKET, BY OWNERSHIP, 2022-2032 ($MILLION)
- TABLE 30. GERMANY E-BROKERAGE MARKET, BY END USER, 2022-2032 ($MILLION)
- TABLE 31. FRANCE E-BROKERAGE MARKET, BY SERVICE PROVIDER, 2022-2032 ($MILLION)
- TABLE 32. FRANCE E-BROKERAGE MARKET, BY OWNERSHIP, 2022-2032 ($MILLION)
- TABLE 33. FRANCE E-BROKERAGE MARKET, BY END USER, 2022-2032 ($MILLION)
- TABLE 34. ITALY E-BROKERAGE MARKET, BY SERVICE PROVIDER, 2022-2032 ($MILLION)
- TABLE 35. ITALY E-BROKERAGE MARKET, BY OWNERSHIP, 2022-2032 ($MILLION)
- TABLE 36. ITALY E-BROKERAGE MARKET, BY END USER, 2022-2032 ($MILLION)
- TABLE 37. SPAIN E-BROKERAGE MARKET, BY SERVICE PROVIDER, 2022-2032 ($MILLION)
- TABLE 38. SPAIN E-BROKERAGE MARKET, BY OWNERSHIP, 2022-2032 ($MILLION)
- TABLE 39. SPAIN E-BROKERAGE MARKET, BY END USER, 2022-2032 ($MILLION)
- TABLE 40. REST OF EUROPE E-BROKERAGE MARKET, BY SERVICE PROVIDER, 2022-2032 ($MILLION)
- TABLE 41. REST OF EUROPE E-BROKERAGE MARKET, BY OWNERSHIP, 2022-2032 ($MILLION)
- TABLE 42. REST OF EUROPE E-BROKERAGE MARKET, BY END USER, 2022-2032 ($MILLION)
- TABLE 43. ASIA-PACIFIC E-BROKERAGE MARKET, BY SERVICE PROVIDER, 2022-2032 ($MILLION)
- TABLE 44. ASIA-PACIFIC E-BROKERAGE MARKET, BY OWNERSHIP, 2022-2032 ($MILLION)
- TABLE 45. ASIA-PACIFIC E-BROKERAGE MARKET, BY END USER, 2022-2032 ($MILLION)
- TABLE 46. ASIA-PACIFIC E-BROKERAGE MARKET, BY COUNTRY, 2022-2032 ($MILLION)
- TABLE 47. CHINA E-BROKERAGE MARKET, BY SERVICE PROVIDER, 2022-2032 ($MILLION)
- TABLE 48. CHINA E-BROKERAGE MARKET, BY OWNERSHIP, 2022-2032 ($MILLION)
- TABLE 49. CHINA E-BROKERAGE MARKET, BY END USER, 2022-2032 ($MILLION)
- TABLE 50. JAPAN E-BROKERAGE MARKET, BY SERVICE PROVIDER, 2022-2032 ($MILLION)
- TABLE 51. JAPAN E-BROKERAGE MARKET, BY OWNERSHIP, 2022-2032 ($MILLION)
- TABLE 52. JAPAN E-BROKERAGE MARKET, BY END USER, 2022-2032 ($MILLION)
- TABLE 53. INDIA E-BROKERAGE MARKET, BY SERVICE PROVIDER, 2022-2032 ($MILLION)
- TABLE 54. INDIA E-BROKERAGE MARKET, BY OWNERSHIP, 2022-2032 ($MILLION)
- TABLE 55. INDIA E-BROKERAGE MARKET, BY END USER, 2022-2032 ($MILLION)
- TABLE 56. AUSTRALIA E-BROKERAGE MARKET, BY SERVICE PROVIDER, 2022-2032 ($MILLION)
- TABLE 57. AUSTRALIA E-BROKERAGE MARKET, BY OWNERSHIP, 2022-2032 ($MILLION)
- TABLE 58. AUSTRALIA E-BROKERAGE MARKET, BY END USER, 2022-2032 ($MILLION)
- TABLE 59. SOUTH KOREA E-BROKERAGE MARKET, BY SERVICE PROVIDER, 2022-2032 ($MILLION)
- TABLE 60. SOUTH KOREA E-BROKERAGE MARKET, BY OWNERSHIP, 2022-2032 ($MILLION)
- TABLE 61. SOUTH KOREA E-BROKERAGE MARKET, BY END USER, 2022-2032 ($MILLION)
- TABLE 62. REST OF ASIA-PACIFIC E-BROKERAGE MARKET, BY SERVICE PROVIDER, 2022-2032 ($MILLION)
- TABLE 63. REST OF ASIA-PACIFIC E-BROKERAGE MARKET, BY OWNERSHIP, 2022-2032 ($MILLION)
- TABLE 64. REST OF ASIA-PACIFIC E-BROKERAGE MARKET, BY END USER, 2022-2032 ($MILLION)
- TABLE 65. LAMEA E-BROKERAGE MARKET, BY SERVICE PROVIDER, 2022-2032 ($MILLION)
- TABLE 66. LAMEA E-BROKERAGE MARKET, BY OWNERSHIP, 2022-2032 ($MILLION)
- TABLE 67. LAMEA E-BROKERAGE MARKET, BY END USER, 2022-2032 ($MILLION)
- TABLE 68. LAMEA E-BROKERAGE MARKET, BY COUNTRY, 2022-2032 ($MILLION)
- TABLE 69. LATIN AMERICA E-BROKERAGE MARKET, BY SERVICE PROVIDER, 2022-2032 ($MILLION)
- TABLE 70. LATIN AMERICA E-BROKERAGE MARKET, BY OWNERSHIP, 2022-2032 ($MILLION)
- TABLE 71. LATIN AMERICA E-BROKERAGE MARKET, BY END USER, 2022-2032 ($MILLION)
- TABLE 72. MIDDLE EAST E-BROKERAGE MARKET, BY SERVICE PROVIDER, 2022-2032 ($MILLION)
- TABLE 73. MIDDLE EAST E-BROKERAGE MARKET, BY OWNERSHIP, 2022-2032 ($MILLION)
- TABLE 74. MIDDLE EAST E-BROKERAGE MARKET, BY END USER, 2022-2032 ($MILLION)
- TABLE 75. AFRICA E-BROKERAGE MARKET, BY SERVICE PROVIDER, 2022-2032 ($MILLION)
- TABLE 76. AFRICA E-BROKERAGE MARKET, BY OWNERSHIP, 2022-2032 ($MILLION)
- TABLE 77. AFRICA E-BROKERAGE MARKET, BY END USER, 2022-2032 ($MILLION)
- TABLE 78. CHARLES SCHWAB AND CO.: KEY EXECUTIVES
- TABLE 79. CHARLES SCHWAB AND CO.: COMPANY SNAPSHOT
- TABLE 80. CHARLES SCHWAB AND CO.: SERVICE SEGMENTS
- TABLE 81. CHARLES SCHWAB AND CO.: PRODUCT PORTFOLIO
- TABLE 82. CHARLES SCHWAB AND CO.: KEY STRATERGIES
- TABLE 83. FMR LLC: KEY EXECUTIVES
- TABLE 84. FMR LLC: COMPANY SNAPSHOT
- TABLE 85. FMR LLC: SERVICE SEGMENTS
- TABLE 86. FMR LLC: PRODUCT PORTFOLIO
- TABLE 87. FMR LLC: KEY STRATERGIES
- TABLE 88. E-TRADE: KEY EXECUTIVES
- TABLE 89. E-TRADE: COMPANY SNAPSHOT
- TABLE 90. E-TRADE: SERVICE SEGMENTS
- TABLE 91. E-TRADE: PRODUCT PORTFOLIO
- TABLE 92. E-TRADE: KEY STRATERGIES
- TABLE 93. INTERACTIVE BROKERS LLC.: KEY EXECUTIVES
- TABLE 94. INTERACTIVE BROKERS LLC.: COMPANY SNAPSHOT
- TABLE 95. INTERACTIVE BROKERS LLC.: SERVICE SEGMENTS
- TABLE 96. INTERACTIVE BROKERS LLC.: PRODUCT PORTFOLIO
- TABLE 97. ETORO: KEY EXECUTIVES
- TABLE 98. ETORO: COMPANY SNAPSHOT
- TABLE 99. ETORO: SERVICE SEGMENTS
- TABLE 100. ETORO: PRODUCT PORTFOLIO
- TABLE 101. FP MARKETS: KEY EXECUTIVES
- TABLE 102. FP MARKETS: COMPANY SNAPSHOT
- TABLE 103. FP MARKETS: SERVICE SEGMENTS
- TABLE 104. FP MARKETS: PRODUCT PORTFOLIO
- TABLE 105. FP MARKETS: KEY STRATERGIES
- TABLE 106. EOPTION: KEY EXECUTIVES
- TABLE 107. EOPTION: COMPANY SNAPSHOT
- TABLE 108. EOPTION: SERVICE SEGMENTS
- TABLE 109. EOPTION: PRODUCT PORTFOLIO
- TABLE 110. TASTYTRADE, INC.: KEY EXECUTIVES
- TABLE 111. TASTYTRADE, INC.: COMPANY SNAPSHOT
- TABLE 112. TASTYTRADE, INC.: SERVICE SEGMENTS
- TABLE 113. TASTYTRADE, INC.: PRODUCT PORTFOLIO
- TABLE 114. TASTYTRADE, INC.: KEY STRATERGIES
- TABLE 115. XTB: KEY EXECUTIVES
- TABLE 116. XTB: COMPANY SNAPSHOT
- TABLE 117. XTB: SERVICE SEGMENTS
- TABLE 118. XTB: PRODUCT PORTFOLIO
- TABLE 119. TD AMERITRADE: KEY EXECUTIVES
- TABLE 120. TD AMERITRADE: COMPANY SNAPSHOT
- TABLE 121. TD AMERITRADE: SERVICE SEGMENTS
- TABLE 122. TD AMERITRADE: PRODUCT PORTFOLIO
- TABLE 123. TD AMERITRADE: KEY STRATERGIES
LIST OF FIGURES
- FIGURE 01. E-BROKERAGE MARKET, 2022-2032
- FIGURE 02. SEGMENTATION OF E-BROKERAGE MARKET, 2022-2032
- FIGURE 03. TOP INVESTMENT POCKETS IN E-BROKERAGE MARKET (2023-2032)
- FIGURE 04. HIGH TO MODERATE BARGAINING POWER OF SUPPLIERS
- FIGURE 05. HIGH TO LOW BARGAINING POWER OF BUYERS
- FIGURE 06. MODERATE TO HIGH THREAT OF SUBSTITUTES
- FIGURE 07. HIGH THREAT OF NEW ENTRANTS
- FIGURE 08. MODERATE TO HIGH INTENSITY OF RIVALRY
- FIGURE 09. DRIVERS, RESTRAINTS AND OPPORTUNITIES: GLOBALE-BROKERAGE MARKET
- FIGURE 10. E-BROKERAGE MARKET, BY SERVICE PROVIDER, 2022(%)
- FIGURE 11. COMPARATIVE SHARE ANALYSIS OF E-BROKERAGE MARKET FOR FULL TIME BROKER, BY COUNTRY 2022 AND 2032(%)
- FIGURE 12. COMPARATIVE SHARE ANALYSIS OF E-BROKERAGE MARKET FOR DISCOUNTED BROKER, BY COUNTRY 2022 AND 2032(%)
- FIGURE 13. E-BROKERAGE MARKET, BY OWNERSHIP, 2022(%)
- FIGURE 14. COMPARATIVE SHARE ANALYSIS OF E-BROKERAGE MARKET FOR PRIVATELY HELD, BY COUNTRY 2022 AND 2032(%)
- FIGURE 15. COMPARATIVE SHARE ANALYSIS OF E-BROKERAGE MARKET FOR PUBLICLY HELD, BY COUNTRY 2022 AND 2032(%)
- FIGURE 16. E-BROKERAGE MARKET, BY END USER, 2022(%)
- FIGURE 17. COMPARATIVE SHARE ANALYSIS OF E-BROKERAGE MARKET FOR RETAIL INVESTOR, BY COUNTRY 2022 AND 2032(%)
- FIGURE 18. COMPARATIVE SHARE ANALYSIS OF E-BROKERAGE MARKET FOR INSTITUTIONAL INVESTOR, BY COUNTRY 2022 AND 2032(%)
- FIGURE 19. E-BROKERAGE MARKET BY REGION, 2022
- FIGURE 20. U.S. E-BROKERAGE MARKET, 2022-2032 ($MILLION)
- FIGURE 21. CANADA E-BROKERAGE MARKET, 2022-2032 ($MILLION)
- FIGURE 22. UK E-BROKERAGE MARKET, 2022-2032 ($MILLION)
- FIGURE 23. GERMANY E-BROKERAGE MARKET, 2022-2032 ($MILLION)
- FIGURE 24. FRANCE E-BROKERAGE MARKET, 2022-2032 ($MILLION)
- FIGURE 25. ITALY E-BROKERAGE MARKET, 2022-2032 ($MILLION)
- FIGURE 26. SPAIN E-BROKERAGE MARKET, 2022-2032 ($MILLION)
- FIGURE 27. REST OF EUROPE E-BROKERAGE MARKET, 2022-2032 ($MILLION)
- FIGURE 28. CHINA E-BROKERAGE MARKET, 2022-2032 ($MILLION)
- FIGURE 29. JAPAN E-BROKERAGE MARKET, 2022-2032 ($MILLION)
- FIGURE 30. INDIA E-BROKERAGE MARKET, 2022-2032 ($MILLION)
- FIGURE 31. AUSTRALIA E-BROKERAGE MARKET, 2022-2032 ($MILLION)
- FIGURE 32. SOUTH KOREA E-BROKERAGE MARKET, 2022-2032 ($MILLION)
- FIGURE 33. REST OF ASIA-PACIFIC E-BROKERAGE MARKET, 2022-2032 ($MILLION)
- FIGURE 34. LATIN AMERICA E-BROKERAGE MARKET, 2022-2032 ($MILLION)
- FIGURE 35. MIDDLE EAST E-BROKERAGE MARKET, 2022-2032 ($MILLION)
- FIGURE 36. AFRICA E-BROKERAGE MARKET, 2022-2032 ($MILLION)
- FIGURE 37. TOP WINNING STRATEGIES, BY YEAR
- FIGURE 38. TOP WINNING STRATEGIES, BY DEVELOPMENT
- FIGURE 39. TOP WINNING STRATEGIES, BY COMPANY
- FIGURE 40. PRODUCT MAPPING OF TOP 10 PLAYERS
- FIGURE 41. COMPETITIVE DASHBOARD
- FIGURE 42. COMPETITIVE HEATMAP: E-BROKERAGE MARKET
- FIGURE 43. TOP PLAYER POSITIONING, 2022
- FIGURE 44. CHARLES SCHWAB AND CO.: NET REVENUE, 2020-2022 ($MILLION)
- FIGURE 45. CHARLES SCHWAB AND CO.: REVENUE SHARE BY SEGMENT, 2022 (%)
- FIGURE 46. E-TRADE: NET REVENUE, 2020-2022 ($MILLION)
- FIGURE 47. E-TRADE: REVENUE SHARE BY REGION, 2022 (%)
- FIGURE 48. INTERACTIVE BROKERS LLC.: NET REVENUE, 2020-2022 ($MILLION)
- FIGURE 49. INTERACTIVE BROKERS LLC.: REVENUE SHARE BY REGION, 2022 (%)
- FIGURE 50. XTB: NET REVENUE, 2020-2022 ($MILLION)
- FIGURE 51. XTB: REVENUE SHARE BY SEGMENT, 2022 (%)
- FIGURE 52. XTB: REVENUE SHARE BY REGION, 2022 (%)
- FIGURE 53. TD AMERITRADE: NET REVENUE, 2020-2022 ($MILLION)
According to a new report published by Allied Market Research, titled, "E-Brokerage Market," The e-brokerage market was valued at $11.7 billion in 2022, and is estimated to reach $31.1 billion by 2032, growing at a CAGR of 10.6% from 2023 to 2032.
One of the main drivers of the e-brokerage market is the convenience that online trading platforms offer. With e-brokerage, investors can easily buy and sell securities from the comfort of their homes or offices, without the need to physically visit a broker's office. This convenience has made online trading more accessible to retail investors who may not have had access to traditional brokerage services in the past. Furthermore, the increasing internet penetration has been a significant driver of the e-brokerage market. In addition, with the growth of digitalization and the use of the internet, the online brokerage industry has experienced significant growth. However, security concerns, regulatory issues, and less investor awareness are some of the factors that hamper the market growth. On the contrary, the increasing adoption of mobile trading platforms and the development of new technologies such as artificial intelligence, machine learning, and big data analytics are expected to create new opportunities for the growth of the e-brokerage market in the upcoming years. These technologies can help e-brokerage firms provide better services to their clients, such as personalized investment recommendations, improved risk management, and faster transaction processing.
The e-brokerage market is segmented into service provider, ownership, end user, and region. By service provider, the market is differentiated into full time broker and discounted broker. Depending on ownership, it is fragmented into privately held and publicly held. The end user segment is divided into retail investor and institutional investor. Region wise, the market is segmented into North America, Europe, Asia-Pacific, and Latin America.
The e-brokerage market analysis includes top companies operating in the market such as Charles Schwab & Co., FMR LLC, E*TRADE, Interactive Brokers LLC, eToro, FP Markets, eOption, tastytrade, Inc., XTB, and TD Ameritrade. These players have adopted various strategies to increase their market penetration and strengthen their position in the accounting and budgeting software industry.
Key Benefits for Stakeholders
- The study provides in-depth analysis of the e-brokerage market along with current trends and future estimations to illustrate the imminent investment pockets.
- Information about key drivers, restrains, & opportunities and their impact analysis on the e-brokerage market size are provided in the report.
- The Porter's five forces analysis illustrates the potency of buyers and suppliers operating in the industry.
- The quantitative analysis of the e-brokerage market from 2022 to 2032 is provided to determine the market potential.
Key Market Segments
By Service Provider
- Full Time Broker
- Discounted Broker
By Ownership
- Privately Held
- Publicly Held
By End User
- Retail Investor
- Institutional Investor
By Region
- North America
- U.S.
- Canada
- Europe
- UK
- Germany
- France
- Italy
- Spain
- Rest of Europe
- Asia-Pacific
- China
- Japan
- India
- Australia
- South Korea
- Rest of Asia-Pacific
- LAMEA
- Latin America
- Middle East
- Africa
Key Market Players:
- Charles Schwab and Co.
- eOption
- eToro
- E-trade
- FMR LLC
- FP Markets
- Interactive Brokers LLC.
- TastyTrade, Inc.
- TD Ameritrade
- XTB
TABLE OF CONTENTS
CHAPTER 1: INTRODUCTION
- 1.1. Report description
- 1.2. Key market segments
- 1.3. Key benefits to the stakeholders
- 1.4. Research Methodology
- 1.4.1. Primary research
- 1.4.2. Secondary research
- 1.4.3. Analyst tools and models
CHAPTER 2: EXECUTIVE SUMMARY
- 2.1. CXO Perspective
CHAPTER 3: MARKET OVERVIEW
- 3.1. Market definition and scope
- 3.2. Key findings
- 3.2.1. Top impacting factors
- 3.2.2. Top investment pockets
- 3.3. Porter's five forces analysis
- 3.3.1. Bargaining power of suppliers
- 3.3.2. Bargaining power of buyers
- 3.3.3. Threat of substitutes
- 3.3.4. Threat of new entrants
- 3.3.5. Intensity of rivalry
- 3.4. Market dynamics
- 3.4.1. Drivers
- 3.4.1.1. Convenience and cost-effectiveness of e-brokerage platforms
- 3.4.1.2. Rapid growth in digitalization
- 3.4.1.3. Changing customer preferences
- 3.4.1.4. Increasing internet penetration
- 3.4.1. Drivers
- 3.4.2. Restraints
- 3.4.2.1. Security concerns and regulatory issues
- 3.4.2.2. Less investor awareness
- 3.4.3. Opportunities
- 3.4.3.1. Increasing adoption of mobile trading platforms
- 3.4.3.2. Technological advancements
- 3.5. COVID-19 Impact Analysis on the market
CHAPTER 4: E-BROKERAGE MARKET, BY SERVICE PROVIDER
- 4.1. Overview
- 4.1.1. Market size and forecast
- 4.2. Full Time Broker
- 4.2.1. Key market trends, growth factors and opportunities
- 4.2.2. Market size and forecast, by region
- 4.2.3. Market share analysis by country
- 4.3. Discounted Broker
- 4.3.1. Key market trends, growth factors and opportunities
- 4.3.2. Market size and forecast, by region
- 4.3.3. Market share analysis by country
CHAPTER 5: E-BROKERAGE MARKET, BY OWNERSHIP
- 5.1. Overview
- 5.1.1. Market size and forecast
- 5.2. Privately Held
- 5.2.1. Key market trends, growth factors and opportunities
- 5.2.2. Market size and forecast, by region
- 5.2.3. Market share analysis by country
- 5.3. Publicly Held
- 5.3.1. Key market trends, growth factors and opportunities
- 5.3.2. Market size and forecast, by region
- 5.3.3. Market share analysis by country
CHAPTER 6: E-BROKERAGE MARKET, BY END USER
- 6.1. Overview
- 6.1.1. Market size and forecast
- 6.2. Retail Investor
- 6.2.1. Key market trends, growth factors and opportunities
- 6.2.2. Market size and forecast, by region
- 6.2.3. Market share analysis by country
- 6.3. Institutional Investor
- 6.3.1. Key market trends, growth factors and opportunities
- 6.3.2. Market size and forecast, by region
- 6.3.3. Market share analysis by country
CHAPTER 7: E-BROKERAGE MARKET, BY REGION
- 7.1. Overview
- 7.1.1. Market size and forecast By Region
- 7.2. North America
- 7.2.1. Key trends and opportunities
- 7.2.2. Market size and forecast, by Service Provider
- 7.2.3. Market size and forecast, by Ownership
- 7.2.4. Market size and forecast, by End User
- 7.2.5. Market size and forecast, by country
- 7.2.5.1. U.S.
- 7.2.5.1.1. Key market trends, growth factors and opportunities
- 7.2.5.1.2. Market size and forecast, by Service Provider
- 7.2.5.1.3. Market size and forecast, by Ownership
- 7.2.5.1.4. Market size and forecast, by End User
- 7.2.5.2. Canada
- 7.2.5.2.1. Key market trends, growth factors and opportunities
- 7.2.5.2.2. Market size and forecast, by Service Provider
- 7.2.5.2.3. Market size and forecast, by Ownership
- 7.2.5.2.4. Market size and forecast, by End User
- 7.3. Europe
- 7.3.1. Key trends and opportunities
- 7.3.2. Market size and forecast, by Service Provider
- 7.3.3. Market size and forecast, by Ownership
- 7.3.4. Market size and forecast, by End User
- 7.3.5. Market size and forecast, by country
- 7.3.5.1. UK
- 7.3.5.1.1. Key market trends, growth factors and opportunities
- 7.3.5.1.2. Market size and forecast, by Service Provider
- 7.3.5.1.3. Market size and forecast, by Ownership
- 7.3.5.1.4. Market size and forecast, by End User
- 7.3.5.2. Germany
- 7.3.5.2.1. Key market trends, growth factors and opportunities
- 7.3.5.2.2. Market size and forecast, by Service Provider
- 7.3.5.2.3. Market size and forecast, by Ownership
- 7.3.5.2.4. Market size and forecast, by End User
- 7.3.5.3. France
- 7.3.5.3.1. Key market trends, growth factors and opportunities
- 7.3.5.3.2. Market size and forecast, by Service Provider
- 7.3.5.3.3. Market size and forecast, by Ownership
- 7.3.5.3.4. Market size and forecast, by End User
- 7.3.5.4. Italy
- 7.3.5.4.1. Key market trends, growth factors and opportunities
- 7.3.5.4.2. Market size and forecast, by Service Provider
- 7.3.5.4.3. Market size and forecast, by Ownership
- 7.3.5.4.4. Market size and forecast, by End User
- 7.3.5.5. Spain
- 7.3.5.5.1. Key market trends, growth factors and opportunities
- 7.3.5.5.2. Market size and forecast, by Service Provider
- 7.3.5.5.3. Market size and forecast, by Ownership
- 7.3.5.5.4. Market size and forecast, by End User
- 7.3.5.6. Rest of Europe
- 7.3.5.6.1. Key market trends, growth factors and opportunities
- 7.3.5.6.2. Market size and forecast, by Service Provider
- 7.3.5.6.3. Market size and forecast, by Ownership
- 7.3.5.6.4. Market size and forecast, by End User
- 7.4. Asia-Pacific
- 7.4.1. Key trends and opportunities
- 7.4.2. Market size and forecast, by Service Provider
- 7.4.3. Market size and forecast, by Ownership
- 7.4.4. Market size and forecast, by End User
- 7.4.5. Market size and forecast, by country
- 7.4.5.1. China
- 7.4.5.1.1. Key market trends, growth factors and opportunities
- 7.4.5.1.2. Market size and forecast, by Service Provider
- 7.4.5.1.3. Market size and forecast, by Ownership
- 7.4.5.1.4. Market size and forecast, by End User
- 7.4.5.2. Japan
- 7.4.5.2.1. Key market trends, growth factors and opportunities
- 7.4.5.2.2. Market size and forecast, by Service Provider
- 7.4.5.2.3. Market size and forecast, by Ownership
- 7.4.5.2.4. Market size and forecast, by End User
- 7.4.5.3. India
- 7.4.5.3.1. Key market trends, growth factors and opportunities
- 7.4.5.3.2. Market size and forecast, by Service Provider
- 7.4.5.3.3. Market size and forecast, by Ownership
- 7.4.5.3.4. Market size and forecast, by End User
- 7.4.5.4. Australia
- 7.4.5.4.1. Key market trends, growth factors and opportunities
- 7.4.5.4.2. Market size and forecast, by Service Provider
- 7.4.5.4.3. Market size and forecast, by Ownership
- 7.4.5.4.4. Market size and forecast, by End User
- 7.4.5.5. South Korea
- 7.4.5.5.1. Key market trends, growth factors and opportunities
- 7.4.5.5.2. Market size and forecast, by Service Provider
- 7.4.5.5.3. Market size and forecast, by Ownership
- 7.4.5.5.4. Market size and forecast, by End User
- 7.4.5.6. Rest of Asia-Pacific
- 7.4.5.6.1. Key market trends, growth factors and opportunities
- 7.4.5.6.2. Market size and forecast, by Service Provider
- 7.4.5.6.3. Market size and forecast, by Ownership
- 7.4.5.6.4. Market size and forecast, by End User
- 7.5. LAMEA
- 7.5.1. Key trends and opportunities
- 7.5.2. Market size and forecast, by Service Provider
- 7.5.3. Market size and forecast, by Ownership
- 7.5.4. Market size and forecast, by End User
- 7.5.5. Market size and forecast, by country
- 7.5.5.1. Latin America
- 7.5.5.1.1. Key market trends, growth factors and opportunities
- 7.5.5.1.2. Market size and forecast, by Service Provider
- 7.5.5.1.3. Market size and forecast, by Ownership
- 7.5.5.1.4. Market size and forecast, by End User
- 7.5.5.2. Middle East
- 7.5.5.2.1. Key market trends, growth factors and opportunities
- 7.5.5.2.2. Market size and forecast, by Service Provider
- 7.5.5.2.3. Market size and forecast, by Ownership
- 7.5.5.2.4. Market size and forecast, by End User
- 7.5.5.3. Africa
- 7.5.5.3.1. Key market trends, growth factors and opportunities
- 7.5.5.3.2. Market size and forecast, by Service Provider
- 7.5.5.3.3. Market size and forecast, by Ownership
- 7.5.5.3.4. Market size and forecast, by End User
CHAPTER 8: COMPETITIVE LANDSCAPE
- 8.1. Introduction
- 8.2. Top winning strategies
- 8.3. Product Mapping of Top 10 Player
- 8.4. Competitive Dashboard
- 8.5. Competitive Heatmap
- 8.6. Top player positioning, 2022
CHAPTER 9: COMPANY PROFILES
- 9.1. Charles Schwab and Co.
- 9.1.1. Company overview
- 9.1.2. Key Executives
- 9.1.3. Company snapshot
- 9.1.4. Operating business segments
- 9.1.5. Product portfolio
- 9.1.6. Business performance
- 9.1.7. Key strategic moves and developments
- 9.2. FMR LLC
- 9.2.1. Company overview
- 9.2.2. Key Executives
- 9.2.3. Company snapshot
- 9.2.4. Operating business segments
- 9.2.5. Product portfolio
- 9.2.6. Key strategic moves and developments
- 9.3. E-trade
- 9.3.1. Company overview
- 9.3.2. Key Executives
- 9.3.3. Company snapshot
- 9.3.4. Operating business segments
- 9.3.5. Product portfolio
- 9.3.6. Business performance
- 9.3.7. Key strategic moves and developments
- 9.4. Interactive Brokers LLC.
- 9.4.1. Company overview
- 9.4.2. Key Executives
- 9.4.3. Company snapshot
- 9.4.4. Operating business segments
- 9.4.5. Product portfolio
- 9.4.6. Business performance
- 9.5. eToro
- 9.5.1. Company overview
- 9.5.2. Key Executives
- 9.5.3. Company snapshot
- 9.5.4. Operating business segments
- 9.5.5. Product portfolio
- 9.6. FP Markets
- 9.6.1. Company overview
- 9.6.2. Key Executives
- 9.6.3. Company snapshot
- 9.6.4. Operating business segments
- 9.6.5. Product portfolio
- 9.6.6. Key strategic moves and developments
- 9.7. eOption
- 9.7.1. Company overview
- 9.7.2. Key Executives
- 9.7.3. Company snapshot
- 9.7.4. Operating business segments
- 9.7.5. Product portfolio
- 9.8. TastyTrade, Inc.
- 9.8.1. Company overview
- 9.8.2. Key Executives
- 9.8.3. Company snapshot
- 9.8.4. Operating business segments
- 9.8.5. Product portfolio
- 9.8.6. Key strategic moves and developments
- 9.9. XTB
- 9.9.1. Company overview
- 9.9.2. Key Executives
- 9.9.3. Company snapshot
- 9.9.4. Operating business segments
- 9.9.5. Product portfolio
- 9.9.6. Business performance
- 9.10. TD Ameritrade
- 9.10.1. Company overview
- 9.10.2. Key Executives
- 9.10.3. Company snapshot
- 9.10.4. Operating business segments
- 9.10.5. Product portfolio
- 9.10.6. Business performance
- 9.10.7. Key strategic moves and developments