
|
市場調査レポート
商品コード
1344320
肺機能モニタリングデバイス市場:製品タイプ別、エンドユーザー別:世界の機会分析と産業予測、2023-2032年Lung Monitoring Devices Market By Product Type (Spirometers, Pulse Oximeters, Capnographs, Others), By End User (Hospitals, Homecare, Others): Global Opportunity Analysis and Industry Forecast, 2023-2032 |
||||||
|
|||||||

| 肺機能モニタリングデバイス市場:製品タイプ別、エンドユーザー別:世界の機会分析と産業予測、2023-2032年 |
|
出版日: 2023年06月01日
発行: Allied Market Research
ページ情報: 英文 224 Pages
納期: 2~3営業日
|

- 全表示
- 概要
- 図表
- 目次
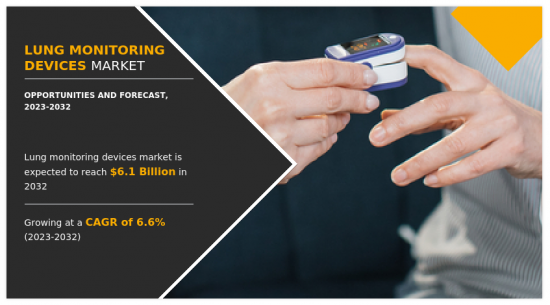
Allied Market Researchが発行した調査レポートによると、肺機能モニタリングデバイス市場は2022年に33億米ドル、2023年から2032年にかけてCAGR 6.6%で成長し、2032年には61億米ドルに達すると推定されています。
肺機能モニタリングデバイスは、慢性閉塞性肺疾患(COPD)、嚢胞性線維症、移植後患者などの呼吸器疾患に対して、肺機能を正確かつ効率的にモニタリングするために使用されます。これらのデバイスは、症状の管理を支援し、喘息やCOPDなどの複数の肺疾患の増悪を抑えるのに役立ちます。
肺機能モニタリングデバイス市場の成長は、呼吸器疾患の罹患率の急増、医療治療の入手可能性と手頃な価格の増加、および先進的な製品の発売数の増加が原動力となっています。例えば、2021年3月、大手製薬会社のVyaire Medical社は、欧州、中東、オーストラリアの15カ国以上でAioCare(HealthUp SA、ポーランド)モバイルスパイロメトリーシステムの発売を発表しました。スパイロメトリーは最も一般的な肺機能または呼吸検査です。
さらに、大手医療技術企業は、肺機能モニタリングデバイスのソリューションを提供する企業の買収にますます力を入れるようになっており、これは市場成長に顕著に寄与すると予想されます。世界の肺機能モニタリングデバイス市場の有力企業は、市場での地位を強化し、競合環境を維持するために、製品の発売、買収、肺機能モニタリングデバイスの進歩のための研究開発への投資など、さまざまな戦略を採用しています。
さらに、COPD有病率の憂慮すべき増加、肺機能モニタリングデバイスの技術的進歩、事故や外傷の数の増加は、市場の成長を促進する主な要因の一部です。さらに、大都市における大気汚染レベルの上昇や、タバコの喫煙を伴うライフスタイルの変化は、肺疾患の有病率上昇に顕著に寄与しています。しかし、肺機能モニタリングデバイスに代わる治療法の利用可能性や肺疾患に関する認識不足が市場成長の妨げとなっています。逆に、老年人口における肺機能モニタリングデバイスの適用の増加は、近い将来の市場成長に有利な機会を提供すると予想されます。さらに、医療インフラの大幅な改善とともに、肺機能モニタリングデバイスの分野における広範な研究開発活動は、予測期間中に市場拡大のための新たな道を開くと予想されます。
目次
第1章 イントロダクション
第2章 エグゼクティブサマリー
第3章 市場概要
- 市場の定義と範囲
- 主な調査結果
- 影響要因
- 主な投資機会
- ポーターのファイブフォース分析
- 市場力学
- 促進要因
- 老人人口の増加
- 呼吸器疾患の増加
- 急速な技術進歩
- 抑制要因
- 呼吸器疾患に関する認識不足
- 機会
- 在宅医療への嗜好の高まり
- 促進要因
- COVID-19:市場への影響分析
第4章 肺機能モニタリングデバイス市場:製品タイプ別
- 概要
- スパイロメーター
- パルスオキシメーター
- カプノグラフ
- その他
第5章 肺機能モニタリングデバイス市場:エンドユーザー別
- 概要
- 病院
- 在宅医療
- その他
第6章 肺機能モニタリングデバイス市場:地域別
- 概要
- 北米
- 米国
- カナダ
- メキシコ
- 欧州
- ドイツ
- フランス
- 英国
- イタリア
- スペイン
- その他欧州
- アジア太平洋
- 中国
- 日本
- インド
- オーストラリア
- 韓国
- その他アジア太平洋地域
- ラテンアメリカ・中東・アフリカ
- ブラジル
- サウジアラビア
- 南アフリカ
- その他ラテンアメリカ・中東・アフリカ
第7章 競合情勢
- イントロダクション
- 主要成功戦略
- 主要10社の製品マッピング
- 競合ダッシュボード
- 競合ヒートマップ
- 主要企業のポジショニング、2022年
第8章 企業プロファイル
- Koninklijke Philips N.V.
- Masimo Corporation
- Medtronic plc
- Nihon Kohden Corporation
- ResMed Inc.
- ICU Medical Inc.
- Vyaire Medical, Inc.
- Becton, Dickinson and Company
- Teleflex Incorporated.
- Baxter International Inc.
LIST OF TABLES
- TABLE 01. GLOBAL LUNG MONITORING DEVICES MARKET, BY PRODUCT TYPE, 2022-2032 ($MILLION)
- TABLE 02. LUNG MONITORING DEVICES MARKET FOR SPIROMETERS, BY REGION, 2022-2032 ($MILLION)
- TABLE 03. GLOBAL SPIROMETERS LUNG MONITORING DEVICES MARKET, BY TYPE, 2022-2032 ($MILLION)
- TABLE 04. LUNG MONITORING DEVICES MARKET FOR PULSE OXIMETERS, BY REGION, 2022-2032 ($MILLION)
- TABLE 05. GLOBAL PULSE OXIMETERS LUNG MONITORING DEVICES MARKET, BY TYPE, 2022-2032 ($MILLION)
- TABLE 06. LUNG MONITORING DEVICES MARKET FOR CAPNOGRAPHS, BY REGION, 2022-2032 ($MILLION)
- TABLE 07. LUNG MONITORING DEVICES MARKET FOR OTHERS, BY REGION, 2022-2032 ($MILLION)
- TABLE 08. GLOBAL LUNG MONITORING DEVICES MARKET, BY END USER, 2022-2032 ($MILLION)
- TABLE 09. LUNG MONITORING DEVICES MARKET FOR HOSPITALS, BY REGION, 2022-2032 ($MILLION)
- TABLE 10. LUNG MONITORING DEVICES MARKET FOR HOMECARE, BY REGION, 2022-2032 ($MILLION)
- TABLE 11. LUNG MONITORING DEVICES MARKET FOR OTHERS, BY REGION, 2022-2032 ($MILLION)
- TABLE 12. LUNG MONITORING DEVICES MARKET, BY REGION, 2022-2032 ($MILLION)
- TABLE 13. NORTH AMERICA LUNG MONITORING DEVICES MARKET, BY PRODUCT TYPE, 2022-2032 ($MILLION)
- TABLE 14. NORTH AMERICA LUNG MONITORING DEVICES MARKET, BY END USER, 2022-2032 ($MILLION)
- TABLE 15. NORTH AMERICA LUNG MONITORING DEVICES MARKET, BY COUNTRY, 2022-2032 ($MILLION)
- TABLE 16. U.S. LUNG MONITORING DEVICES MARKET, BY PRODUCT TYPE, 2022-2032 ($MILLION)
- TABLE 17. U.S. LUNG MONITORING DEVICES MARKET, BY END USER, 2022-2032 ($MILLION)
- TABLE 18. CANADA LUNG MONITORING DEVICES MARKET, BY PRODUCT TYPE, 2022-2032 ($MILLION)
- TABLE 19. CANADA LUNG MONITORING DEVICES MARKET, BY END USER, 2022-2032 ($MILLION)
- TABLE 20. MEXICO LUNG MONITORING DEVICES MARKET, BY PRODUCT TYPE, 2022-2032 ($MILLION)
- TABLE 21. MEXICO LUNG MONITORING DEVICES MARKET, BY END USER, 2022-2032 ($MILLION)
- TABLE 22. EUROPE LUNG MONITORING DEVICES MARKET, BY PRODUCT TYPE, 2022-2032 ($MILLION)
- TABLE 23. EUROPE LUNG MONITORING DEVICES MARKET, BY END USER, 2022-2032 ($MILLION)
- TABLE 24. EUROPE LUNG MONITORING DEVICES MARKET, BY COUNTRY, 2022-2032 ($MILLION)
- TABLE 25. GERMANY LUNG MONITORING DEVICES MARKET, BY PRODUCT TYPE, 2022-2032 ($MILLION)
- TABLE 26. GERMANY LUNG MONITORING DEVICES MARKET, BY END USER, 2022-2032 ($MILLION)
- TABLE 27. FRANCE LUNG MONITORING DEVICES MARKET, BY PRODUCT TYPE, 2022-2032 ($MILLION)
- TABLE 28. FRANCE LUNG MONITORING DEVICES MARKET, BY END USER, 2022-2032 ($MILLION)
- TABLE 29. UK LUNG MONITORING DEVICES MARKET, BY PRODUCT TYPE, 2022-2032 ($MILLION)
- TABLE 30. UK LUNG MONITORING DEVICES MARKET, BY END USER, 2022-2032 ($MILLION)
- TABLE 31. ITALY LUNG MONITORING DEVICES MARKET, BY PRODUCT TYPE, 2022-2032 ($MILLION)
- TABLE 32. ITALY LUNG MONITORING DEVICES MARKET, BY END USER, 2022-2032 ($MILLION)
- TABLE 33. SPAIN LUNG MONITORING DEVICES MARKET, BY PRODUCT TYPE, 2022-2032 ($MILLION)
- TABLE 34. SPAIN LUNG MONITORING DEVICES MARKET, BY END USER, 2022-2032 ($MILLION)
- TABLE 35. REST OF EUROPE LUNG MONITORING DEVICES MARKET, BY PRODUCT TYPE, 2022-2032 ($MILLION)
- TABLE 36. REST OF EUROPE LUNG MONITORING DEVICES MARKET, BY END USER, 2022-2032 ($MILLION)
- TABLE 37. ASIA-PACIFIC LUNG MONITORING DEVICES MARKET, BY PRODUCT TYPE, 2022-2032 ($MILLION)
- TABLE 38. ASIA-PACIFIC LUNG MONITORING DEVICES MARKET, BY END USER, 2022-2032 ($MILLION)
- TABLE 39. ASIA-PACIFIC LUNG MONITORING DEVICES MARKET, BY COUNTRY, 2022-2032 ($MILLION)
- TABLE 40. CHINA LUNG MONITORING DEVICES MARKET, BY PRODUCT TYPE, 2022-2032 ($MILLION)
- TABLE 41. CHINA LUNG MONITORING DEVICES MARKET, BY END USER, 2022-2032 ($MILLION)
- TABLE 42. JAPAN LUNG MONITORING DEVICES MARKET, BY PRODUCT TYPE, 2022-2032 ($MILLION)
- TABLE 43. JAPAN LUNG MONITORING DEVICES MARKET, BY END USER, 2022-2032 ($MILLION)
- TABLE 44. INDIA LUNG MONITORING DEVICES MARKET, BY PRODUCT TYPE, 2022-2032 ($MILLION)
- TABLE 45. INDIA LUNG MONITORING DEVICES MARKET, BY END USER, 2022-2032 ($MILLION)
- TABLE 46. AUSTRALIA LUNG MONITORING DEVICES MARKET, BY PRODUCT TYPE, 2022-2032 ($MILLION)
- TABLE 47. AUSTRALIA LUNG MONITORING DEVICES MARKET, BY END USER, 2022-2032 ($MILLION)
- TABLE 48. SOUTH KOREA LUNG MONITORING DEVICES MARKET, BY PRODUCT TYPE, 2022-2032 ($MILLION)
- TABLE 49. SOUTH KOREA LUNG MONITORING DEVICES MARKET, BY END USER, 2022-2032 ($MILLION)
- TABLE 50. REST OF ASIA-PACIFIC LUNG MONITORING DEVICES MARKET, BY PRODUCT TYPE, 2022-2032 ($MILLION)
- TABLE 51. REST OF ASIA-PACIFIC LUNG MONITORING DEVICES MARKET, BY END USER, 2022-2032 ($MILLION)
- TABLE 52. LAMEA LUNG MONITORING DEVICES MARKET, BY PRODUCT TYPE, 2022-2032 ($MILLION)
- TABLE 53. LAMEA LUNG MONITORING DEVICES MARKET, BY END USER, 2022-2032 ($MILLION)
- TABLE 54. LAMEA LUNG MONITORING DEVICES MARKET, BY COUNTRY, 2022-2032 ($MILLION)
- TABLE 55. BRAZIL LUNG MONITORING DEVICES MARKET, BY PRODUCT TYPE, 2022-2032 ($MILLION)
- TABLE 56. BRAZIL LUNG MONITORING DEVICES MARKET, BY END USER, 2022-2032 ($MILLION)
- TABLE 57. SAUDI ARABIA LUNG MONITORING DEVICES MARKET, BY PRODUCT TYPE, 2022-2032 ($MILLION)
- TABLE 58. SAUDI ARABIA LUNG MONITORING DEVICES MARKET, BY END USER, 2022-2032 ($MILLION)
- TABLE 59. SOUTH AFRICA LUNG MONITORING DEVICES MARKET, BY PRODUCT TYPE, 2022-2032 ($MILLION)
- TABLE 60. SOUTH AFRICA LUNG MONITORING DEVICES MARKET, BY END USER, 2022-2032 ($MILLION)
- TABLE 61. REST OF LAMEA LUNG MONITORING DEVICES MARKET, BY PRODUCT TYPE, 2022-2032 ($MILLION)
- TABLE 62. REST OF LAMEA LUNG MONITORING DEVICES MARKET, BY END USER, 2022-2032 ($MILLION)
- TABLE 63. KONINKLIJKE PHILIPS N.V.: KEY EXECUTIVES
- TABLE 64. KONINKLIJKE PHILIPS N.V.: COMPANY SNAPSHOT
- TABLE 65. KONINKLIJKE PHILIPS N.V.: PRODUCT SEGMENTS
- TABLE 66. KONINKLIJKE PHILIPS N.V.: PRODUCT PORTFOLIO
- TABLE 67. MASIMO CORPORATION: KEY EXECUTIVES
- TABLE 68. MASIMO CORPORATION: COMPANY SNAPSHOT
- TABLE 69. MASIMO CORPORATION: PRODUCT SEGMENTS
- TABLE 70. MASIMO CORPORATION: PRODUCT PORTFOLIO
- TABLE 71. MASIMO CORPORATION: KEY STRATERGIES
- TABLE 72. MEDTRONIC PLC: KEY EXECUTIVES
- TABLE 73. MEDTRONIC PLC: COMPANY SNAPSHOT
- TABLE 74. MEDTRONIC PLC: PRODUCT SEGMENTS
- TABLE 75. MEDTRONIC PLC: PRODUCT PORTFOLIO
- TABLE 76. MEDTRONIC PLC: KEY STRATERGIES
- TABLE 77. NIHON KOHDEN CORPORATION: KEY EXECUTIVES
- TABLE 78. NIHON KOHDEN CORPORATION: COMPANY SNAPSHOT
- TABLE 79. NIHON KOHDEN CORPORATION: PRODUCT SEGMENTS
- TABLE 80. NIHON KOHDEN CORPORATION: PRODUCT PORTFOLIO
- TABLE 81. RESMED INC.: KEY EXECUTIVES
- TABLE 82. RESMED INC.: COMPANY SNAPSHOT
- TABLE 83. RESMED INC.: PRODUCT SEGMENTS
- TABLE 84. RESMED INC.: PRODUCT PORTFOLIO
- TABLE 85. ICU MEDICAL INC.: KEY EXECUTIVES
- TABLE 86. ICU MEDICAL INC.: COMPANY SNAPSHOT
- TABLE 87. ICU MEDICAL INC.: PRODUCT SEGMENTS
- TABLE 88. ICU MEDICAL INC.: PRODUCT PORTFOLIO
- TABLE 89. VYAIRE MEDICAL, INC.: KEY EXECUTIVES
- TABLE 90. VYAIRE MEDICAL, INC.: COMPANY SNAPSHOT
- TABLE 91. VYAIRE MEDICAL, INC.: PRODUCT SEGMENTS
- TABLE 92. VYAIRE MEDICAL, INC.: PRODUCT PORTFOLIO
- TABLE 93. BECTON, DICKINSON AND COMPANY: KEY EXECUTIVES
- TABLE 94. BECTON, DICKINSON AND COMPANY: COMPANY SNAPSHOT
- TABLE 95. BECTON, DICKINSON AND COMPANY: PRODUCT SEGMENTS
- TABLE 96. BECTON, DICKINSON AND COMPANY: PRODUCT PORTFOLIO
- TABLE 97. TELEFLEX INCORPORATED.: KEY EXECUTIVES
- TABLE 98. TELEFLEX INCORPORATED.: COMPANY SNAPSHOT
- TABLE 99. TELEFLEX INCORPORATED.: PRODUCT SEGMENTS
- TABLE 100. TELEFLEX INCORPORATED.: PRODUCT PORTFOLIO
- TABLE 101. BAXTER INTERNATIONAL INC.: KEY EXECUTIVES
- TABLE 102. BAXTER INTERNATIONAL INC.: COMPANY SNAPSHOT
- TABLE 103. BAXTER INTERNATIONAL INC.: PRODUCT SEGMENTS
- TABLE 104. BAXTER INTERNATIONAL INC.: PRODUCT PORTFOLIO
LIST OF FIGURES
- FIGURE 01. LUNG MONITORING DEVICES MARKET, 2022-2032
- FIGURE 02. SEGMENTATION OF LUNG MONITORING DEVICES MARKET, 2022-2032
- FIGURE 03. TOP INVESTMENT POCKETS IN LUNG MONITORING DEVICES MARKET (2023-2032)
- FIGURE 04. MODERATE BARGAINING POWER OF SUPPLIERS
- FIGURE 05. MODERATE THREAT OF NEW ENTRANTS
- FIGURE 06. MODERATE THREAT OF SUBSTITUTES
- FIGURE 07. MODERATE INTENSITY OF RIVALRY
- FIGURE 08. MODERATE BARGAINING POWER OF BUYERS
- FIGURE 09. DRIVERS, RESTRAINTS AND OPPORTUNITIES: GLOBALLUNG MONITORING DEVICES MARKET
- FIGURE 09. LUNG MONITORING DEVICES MARKET, BY PRODUCT TYPE, 2022(%)
- FIGURE 10. COMPARATIVE SHARE ANALYSIS OF LUNG MONITORING DEVICES MARKET FOR SPIROMETERS, BY COUNTRY 2022 AND 2032(%)
- FIGURE 11. COMPARATIVE SHARE ANALYSIS OF LUNG MONITORING DEVICES MARKET FOR PULSE OXIMETERS, BY COUNTRY 2022 AND 2032(%)
- FIGURE 12. COMPARATIVE SHARE ANALYSIS OF LUNG MONITORING DEVICES MARKET FOR CAPNOGRAPHS, BY COUNTRY 2022 AND 2032(%)
- FIGURE 13. COMPARATIVE SHARE ANALYSIS OF LUNG MONITORING DEVICES MARKET FOR OTHERS, BY COUNTRY 2022 AND 2032(%)
- FIGURE 14. LUNG MONITORING DEVICES MARKET, BY END USER, 2022(%)
- FIGURE 15. COMPARATIVE SHARE ANALYSIS OF LUNG MONITORING DEVICES MARKET FOR HOSPITALS, BY COUNTRY 2022 AND 2032(%)
- FIGURE 16. COMPARATIVE SHARE ANALYSIS OF LUNG MONITORING DEVICES MARKET FOR HOMECARE, BY COUNTRY 2022 AND 2032(%)
- FIGURE 17. COMPARATIVE SHARE ANALYSIS OF LUNG MONITORING DEVICES MARKET FOR OTHERS, BY COUNTRY 2022 AND 2032(%)
- FIGURE 18. LUNG MONITORING DEVICES MARKET BY REGION, 2022
- FIGURE 19. U.S. LUNG MONITORING DEVICES MARKET, 2022-2032 ($MILLION)
- FIGURE 20. CANADA LUNG MONITORING DEVICES MARKET, 2022-2032 ($MILLION)
- FIGURE 21. MEXICO LUNG MONITORING DEVICES MARKET, 2022-2032 ($MILLION)
- FIGURE 22. GERMANY LUNG MONITORING DEVICES MARKET, 2022-2032 ($MILLION)
- FIGURE 23. FRANCE LUNG MONITORING DEVICES MARKET, 2022-2032 ($MILLION)
- FIGURE 24. UK LUNG MONITORING DEVICES MARKET, 2022-2032 ($MILLION)
- FIGURE 25. ITALY LUNG MONITORING DEVICES MARKET, 2022-2032 ($MILLION)
- FIGURE 26. SPAIN LUNG MONITORING DEVICES MARKET, 2022-2032 ($MILLION)
- FIGURE 27. REST OF EUROPE LUNG MONITORING DEVICES MARKET, 2022-2032 ($MILLION)
- FIGURE 28. CHINA LUNG MONITORING DEVICES MARKET, 2022-2032 ($MILLION)
- FIGURE 29. JAPAN LUNG MONITORING DEVICES MARKET, 2022-2032 ($MILLION)
- FIGURE 30. INDIA LUNG MONITORING DEVICES MARKET, 2022-2032 ($MILLION)
- FIGURE 31. AUSTRALIA LUNG MONITORING DEVICES MARKET, 2022-2032 ($MILLION)
- FIGURE 32. SOUTH KOREA LUNG MONITORING DEVICES MARKET, 2022-2032 ($MILLION)
- FIGURE 33. REST OF ASIA-PACIFIC LUNG MONITORING DEVICES MARKET, 2022-2032 ($MILLION)
- FIGURE 34. BRAZIL LUNG MONITORING DEVICES MARKET, 2022-2032 ($MILLION)
- FIGURE 35. SAUDI ARABIA LUNG MONITORING DEVICES MARKET, 2022-2032 ($MILLION)
- FIGURE 36. SOUTH AFRICA LUNG MONITORING DEVICES MARKET, 2022-2032 ($MILLION)
- FIGURE 37. REST OF LAMEA LUNG MONITORING DEVICES MARKET, 2022-2032 ($MILLION)
- FIGURE 38. TOP WINNING STRATEGIES, BY YEAR
- FIGURE 39. TOP WINNING STRATEGIES, BY DEVELOPMENT
- FIGURE 40. TOP WINNING STRATEGIES, BY COMPANY
- FIGURE 41. PRODUCT MAPPING OF TOP 10 PLAYERS
- FIGURE 42. COMPETITIVE DASHBOARD
- FIGURE 43. COMPETITIVE HEATMAP: LUNG MONITORING DEVICES MARKET
- FIGURE 44. TOP PLAYER POSITIONING, 2022
- FIGURE 45. KONINKLIJKE PHILIPS N.V.: NET SALES, 2020-2022 ($MILLION)
- FIGURE 46. KONINKLIJKE PHILIPS N.V.: REVENUE SHARE BY SEGMENT, 2022 (%)
- FIGURE 47. KONINKLIJKE PHILIPS N.V.: REVENUE SHARE BY REGION, 2022 (%)
- FIGURE 48. MASIMO CORPORATION: NET REVENUE, 2020-2022 ($MILLION)
- FIGURE 49. MEDTRONIC PLC: NET SALES, 2020-2022 ($MILLION)
- FIGURE 50. MEDTRONIC PLC: REVENUE SHARE BY SEGMENT, 2022 (%)
- FIGURE 51. MEDTRONIC PLC: REVENUE SHARE BY REGION, 2022 (%)
- FIGURE 52. NIHON KOHDEN CORPORATION: NET SALES, 2020-2022 ($MILLION)
- FIGURE 53. NIHON KOHDEN CORPORATION: REVENUE SHARE BY SEGMENT, 2022 (%)
- FIGURE 54. NIHON KOHDEN CORPORATION: REVENUE SHARE BY REGION, 2022 (%)
- FIGURE 55. RESMED INC.: NET REVENUE, 2020-2022 ($MILLION)
- FIGURE 56. RESMED INC.: REVENUE SHARE BY SEGMENT, 2022 (%)
- FIGURE 57. RESMED INC.: REVENUE SHARE BY REGION, 2022 (%)
- FIGURE 58. ICU MEDICAL INC.: NET REVENUE, 2020-2022 ($MILLION)
- FIGURE 59. ICU MEDICAL INC.: REVENUE SHARE BY SEGMENT, 2022 (%)
- FIGURE 60. ICU MEDICAL INC.: REVENUE SHARE BY REGION, 2022 (%)
- FIGURE 61. BECTON, DICKINSON AND COMPANY: NET REVENUE, 2020-2022 ($MILLION)
- FIGURE 62. BECTON, DICKINSON AND COMPANY: REVENUE SHARE BY SEGMENT, 2022 (%)
- FIGURE 63. BECTON, DICKINSON AND COMPANY: REVENUE SHARE BY REGION, 2022 (%)
- FIGURE 64. TELEFLEX INCORPORATED.: NET REVENUE, 2020-2022 ($MILLION)
- FIGURE 65. TELEFLEX INCORPORATED.: REVENUE SHARE BY SEGMENT, 2022 (%)
- FIGURE 66. TELEFLEX INCORPORATED.: REVENUE SHARE BY REGION, 2021 (%)
- FIGURE 67. BAXTER INTERNATIONAL INC.: NET SALES, 2020-2022 ($MILLION)
- FIGURE 68. BAXTER INTERNATIONAL INC.: REVENUE SHARE BY SEGMENT, 2022 (%)
- FIGURE 69. BAXTER INTERNATIONAL INC.: REVENUE SHARE BY REGION, 2022 (%)
According to a new report published by Allied Market Research, titled, "Lung Monitoring Devices Market," The lung monitoring devices market was valued at $3.3 billion in 2022, and is estimated to reach $6.1 billion by 2032, growing at a CAGR of 6.6% from 2023 to 2032.
Lung monitoring devices are used for precise and efficient monitoring of lung function for respiratory conditions, including chronic obstructive pulmonary disease (COPD), cystic fibrosis, and post-transplant patients. These devices aid in managing symptoms and help reduce exacerbations of multiple lung disorders such as asthma and COPD.
The growth of the lung monitoring devices market is driven by surge in incidence of respiratory diseases, increase in availability & affordability of healthcare treatment, and rise in number of advanced product launches. For instance, in March 2021, Vyaire Medical, a leading pharmaceutical company, announced the launch of the AioCare (HealthUp SA, Poland) mobile spirometry system in more than 15 countries across Europe, the Middle East, and Australia. Spirometry is the most common type of pulmonary function or breathing test.
Moreover, large medical technology firms are increasingly focusing on acquiring companies that provide solutions for lung monitoring devices, which is expected to notably contribute toward the market growth. Prominent players in the global lung monitoring devices market have adopted various strategies such as product launches, acquisition, and investments in R&D for advancement in lung monitoring devices to strengthen their position in the market and sustain the competitive environment.
Moreover, alarming increase in prevalence of COPD, technological advancements in lung monitoring devices, and rise in the number of accidents and trauma are some of the key factors driving the growth of the market. Furthermore, rise in levels of air pollution in metropolitan cities and changes in lifestyles involving cigarette smoking notably contribute toward the growing prevalence of pulmonary diseases. However, availability of alternative treatments for lung monitoring devices and lack of awareness regarding lung diseases hamper the market growth. Conversely, increased application of lung monitoring devices among the geriatric population is expected to provide lucrative opportunities for the growth of the market in the near future. In addition, extensive R&D activities in the field of lung monitoring devices along with significant improvement in medical infrastructure are anticipated to open new avenues for the expansion of the market during the forecast period.
The global lung monitoring devices market is segmented into product type, end user, and region. On the basis of product type, the market is classified spirometers, pulse oximeters, capnographs, and others. The spirometers segment further bifurcated into hand-held and table-top. The pulse oximeter segment further classified into bedside pulse oximeter, fingertip pulse oximeter, hand held pulse oximeter, wrist worn pulse oximeter and pediatric pulse oximeter.
Depending on end user, it is classified into hospitals, homecare, and others. Region wise, the market is studied across North America (the U.S., Canada, and Mexico), Europe (Germany, France, UK, Italy, Spain, and rest of Europe), Asia-Pacific (Japan, China, Australia, India, South Korea, and rest of Asia-Pacific), and LAMEA (Brazil, South Africa, Saudi Arabia, and rest of LAMEA).
Major companies profiled in the report include: GE Healthcare, Hill-Rom, Inc., Koninklijke Philips N.V., Masimo, Medtronic, Nihon Kohden Corporation, Resmed Inc., Smiths Medical, Vitalograph Ltd., and Vyaire Medical.
Key Benefits For Stakeholders
- This report provides a quantitative analysis of the market segments, current trends, estimations, and dynamics of the lung monitoring devices market analysis from 2022 to 2032 to identify the prevailing lung monitoring devices market opportunities.
- The market research is offered along with information related to key drivers, restraints, and opportunities.
- Porter's five forces analysis highlights the potency of buyers and suppliers to enable stakeholders make profit-oriented business decisions and strengthen their supplier-buyer network.
- In-depth analysis of the lung monitoring devices market segmentation assists to determine the prevailing market opportunities.
- Major countries in each region are mapped according to their revenue contribution to the global market.
- Market player positioning facilitates benchmarking and provides a clear understanding of the present position of the market players.
- The report includes the analysis of the regional as well as global lung monitoring devices market trends, key players, market segments, application areas, and market growth strategies.
Key Market Segments
By End User
- Hospitals
- Homecare
- Others
By Product Type
- Pulse Oximeters
- Type
- Bedside Pulse Oximeter
- Fingertip Pulse Oximeter
- Hand held Pulse Oximeter
- Wrist worn Pulse Oximeter
- Pediatric Pulse Oximeter
- Capnographs
- Others
- Spirometers
- Type
- Hand-Held
- Table-Top
By Region
- North America
- U.S.
- Canada
- Mexico
- Europe
- Germany
- France
- UK
- Italy
- Spain
- Rest of Europe
- Asia-Pacific
- China
- Japan
- India
- Australia
- South Korea
- Rest of Asia-Pacific
- LAMEA
- Brazil
- Saudi Arabia
- South Africa
- Rest of LAMEA
Key Market Players:
- Baxter International Inc.
- Becton, Dickinson and Company
- ICU Medical Inc.
- Koninklijke Philips N.V.
- Masimo Corporation
- Medtronic plc
- Nihon Kohden Corporation
- ResMed Inc.
- Teleflex Incorporated.
- Vyaire Medical, Inc.
TABLE OF CONTENTS
CHAPTER 1: INTRODUCTION
- 1.1. Report description
- 1.2. Key market segments
- 1.3. Key benefits to the stakeholders
- 1.4. Research Methodology
- 1.4.1. Primary research
- 1.4.2. Secondary research
- 1.4.3. Analyst tools and models
CHAPTER 2: EXECUTIVE SUMMARY
- 2.1. CXO Perspective
CHAPTER 3: MARKET OVERVIEW
- 3.1. Market definition and scope
- 3.2. Key findings
- 3.2.1. Top impacting factors
- 3.2.2. Top investment pockets
- 3.3. Porter's five forces analysis
- 3.3.1. Moderate bargaining power of suppliers
- 3.3.2. Moderate threat of new entrants
- 3.3.3. Moderate threat of substitutes
- 3.3.4. Moderate intensity of rivalry
- 3.3.5. Moderate bargaining power of buyers
- 3.4. Market dynamics
- 3.4.1. Drivers
- 3.4.1.1. Upsurge in geriatric population
- 3.4.1.2. Rise in incidence of respiratory diseases
- 3.4.1.3. Rapid technological advancements
- 3.4.1. Drivers
- 3.4.2. Restraints
- 3.4.2.1. Lack of awareness regarding respiratory diseases
- 3.4.3. Opportunities
- 3.4.3.1. Rise in preference for home healthcare
- 3.5. COVID-19 Impact Analysis on the market
CHAPTER 4: LUNG MONITORING DEVICES MARKET, BY PRODUCT TYPE
- 4.1. Overview
- 4.1.1. Market size and forecast
- 4.2. Spirometers
- 4.2.1. Key market trends, growth factors and opportunities
- 4.2.2. Market size and forecast, by region
- 4.2.3. Market share analysis by country
- 4.2.4. Spirometers Lung Monitoring Devices Market by Type
- 4.3. Pulse Oximeters
- 4.3.1. Key market trends, growth factors and opportunities
- 4.3.2. Market size and forecast, by region
- 4.3.3. Market share analysis by country
- 4.3.4. Pulse Oximeters Lung Monitoring Devices Market by Type
- 4.4. Capnographs
- 4.4.1. Key market trends, growth factors and opportunities
- 4.4.2. Market size and forecast, by region
- 4.4.3. Market share analysis by country
- 4.5. Others
- 4.5.1. Key market trends, growth factors and opportunities
- 4.5.2. Market size and forecast, by region
- 4.5.3. Market share analysis by country
CHAPTER 5: LUNG MONITORING DEVICES MARKET, BY END USER
- 5.1. Overview
- 5.1.1. Market size and forecast
- 5.2. Hospitals
- 5.2.1. Key market trends, growth factors and opportunities
- 5.2.2. Market size and forecast, by region
- 5.2.3. Market share analysis by country
- 5.3. Homecare
- 5.3.1. Key market trends, growth factors and opportunities
- 5.3.2. Market size and forecast, by region
- 5.3.3. Market share analysis by country
- 5.4. Others
- 5.4.1. Key market trends, growth factors and opportunities
- 5.4.2. Market size and forecast, by region
- 5.4.3. Market share analysis by country
CHAPTER 6: LUNG MONITORING DEVICES MARKET, BY REGION
- 6.1. Overview
- 6.1.1. Market size and forecast By Region
- 6.2. North America
- 6.2.1. Key trends and opportunities
- 6.2.2. Market size and forecast, by Product Type
- 6.2.3. Market size and forecast, by End User
- 6.2.4. Market size and forecast, by country
- 6.2.4.1. U.S.
- 6.2.4.1.1. Key market trends, growth factors and opportunities
- 6.2.4.1.2. Market size and forecast, by Product Type
- 6.2.4.1.3. Market size and forecast, by End User
- 6.2.4.2. Canada
- 6.2.4.2.1. Key market trends, growth factors and opportunities
- 6.2.4.2.2. Market size and forecast, by Product Type
- 6.2.4.2.3. Market size and forecast, by End User
- 6.2.4.3. Mexico
- 6.2.4.3.1. Key market trends, growth factors and opportunities
- 6.2.4.3.2. Market size and forecast, by Product Type
- 6.2.4.3.3. Market size and forecast, by End User
- 6.3. Europe
- 6.3.1. Key trends and opportunities
- 6.3.2. Market size and forecast, by Product Type
- 6.3.3. Market size and forecast, by End User
- 6.3.4. Market size and forecast, by country
- 6.3.4.1. Germany
- 6.3.4.1.1. Key market trends, growth factors and opportunities
- 6.3.4.1.2. Market size and forecast, by Product Type
- 6.3.4.1.3. Market size and forecast, by End User
- 6.3.4.2. France
- 6.3.4.2.1. Key market trends, growth factors and opportunities
- 6.3.4.2.2. Market size and forecast, by Product Type
- 6.3.4.2.3. Market size and forecast, by End User
- 6.3.4.3. UK
- 6.3.4.3.1. Key market trends, growth factors and opportunities
- 6.3.4.3.2. Market size and forecast, by Product Type
- 6.3.4.3.3. Market size and forecast, by End User
- 6.3.4.4. Italy
- 6.3.4.4.1. Key market trends, growth factors and opportunities
- 6.3.4.4.2. Market size and forecast, by Product Type
- 6.3.4.4.3. Market size and forecast, by End User
- 6.3.4.5. Spain
- 6.3.4.5.1. Key market trends, growth factors and opportunities
- 6.3.4.5.2. Market size and forecast, by Product Type
- 6.3.4.5.3. Market size and forecast, by End User
- 6.3.4.6. Rest of Europe
- 6.3.4.6.1. Key market trends, growth factors and opportunities
- 6.3.4.6.2. Market size and forecast, by Product Type
- 6.3.4.6.3. Market size and forecast, by End User
- 6.4. Asia-Pacific
- 6.4.1. Key trends and opportunities
- 6.4.2. Market size and forecast, by Product Type
- 6.4.3. Market size and forecast, by End User
- 6.4.4. Market size and forecast, by country
- 6.4.4.1. China
- 6.4.4.1.1. Key market trends, growth factors and opportunities
- 6.4.4.1.2. Market size and forecast, by Product Type
- 6.4.4.1.3. Market size and forecast, by End User
- 6.4.4.2. Japan
- 6.4.4.2.1. Key market trends, growth factors and opportunities
- 6.4.4.2.2. Market size and forecast, by Product Type
- 6.4.4.2.3. Market size and forecast, by End User
- 6.4.4.3. India
- 6.4.4.3.1. Key market trends, growth factors and opportunities
- 6.4.4.3.2. Market size and forecast, by Product Type
- 6.4.4.3.3. Market size and forecast, by End User
- 6.4.4.4. Australia
- 6.4.4.4.1. Key market trends, growth factors and opportunities
- 6.4.4.4.2. Market size and forecast, by Product Type
- 6.4.4.4.3. Market size and forecast, by End User
- 6.4.4.5. South Korea
- 6.4.4.5.1. Key market trends, growth factors and opportunities
- 6.4.4.5.2. Market size and forecast, by Product Type
- 6.4.4.5.3. Market size and forecast, by End User
- 6.4.4.6. Rest of Asia-Pacific
- 6.4.4.6.1. Key market trends, growth factors and opportunities
- 6.4.4.6.2. Market size and forecast, by Product Type
- 6.4.4.6.3. Market size and forecast, by End User
- 6.5. LAMEA
- 6.5.1. Key trends and opportunities
- 6.5.2. Market size and forecast, by Product Type
- 6.5.3. Market size and forecast, by End User
- 6.5.4. Market size and forecast, by country
- 6.5.4.1. Brazil
- 6.5.4.1.1. Key market trends, growth factors and opportunities
- 6.5.4.1.2. Market size and forecast, by Product Type
- 6.5.4.1.3. Market size and forecast, by End User
- 6.5.4.2. Saudi Arabia
- 6.5.4.2.1. Key market trends, growth factors and opportunities
- 6.5.4.2.2. Market size and forecast, by Product Type
- 6.5.4.2.3. Market size and forecast, by End User
- 6.5.4.3. South Africa
- 6.5.4.3.1. Key market trends, growth factors and opportunities
- 6.5.4.3.2. Market size and forecast, by Product Type
- 6.5.4.3.3. Market size and forecast, by End User
- 6.5.4.4. Rest of LAMEA
- 6.5.4.4.1. Key market trends, growth factors and opportunities
- 6.5.4.4.2. Market size and forecast, by Product Type
- 6.5.4.4.3. Market size and forecast, by End User
CHAPTER 7: COMPETITIVE LANDSCAPE
- 7.1. Introduction
- 7.2. Top winning strategies
- 7.3. Product Mapping of Top 10 Player
- 7.4. Competitive Dashboard
- 7.5. Competitive Heatmap
- 7.6. Top player positioning, 2022
CHAPTER 8: COMPANY PROFILES
- 8.1. Koninklijke Philips N.V.
- 8.1.1. Company overview
- 8.1.2. Key Executives
- 8.1.3. Company snapshot
- 8.1.4. Operating business segments
- 8.1.5. Product portfolio
- 8.1.6. Business performance
- 8.2. Masimo Corporation
- 8.2.1. Company overview
- 8.2.2. Key Executives
- 8.2.3. Company snapshot
- 8.2.4. Operating business segments
- 8.2.5. Product portfolio
- 8.2.6. Business performance
- 8.2.7. Key strategic moves and developments
- 8.3. Medtronic plc
- 8.3.1. Company overview
- 8.3.2. Key Executives
- 8.3.3. Company snapshot
- 8.3.4. Operating business segments
- 8.3.5. Product portfolio
- 8.3.6. Business performance
- 8.3.7. Key strategic moves and developments
- 8.4. Nihon Kohden Corporation
- 8.4.1. Company overview
- 8.4.2. Key Executives
- 8.4.3. Company snapshot
- 8.4.4. Operating business segments
- 8.4.5. Product portfolio
- 8.4.6. Business performance
- 8.5. ResMed Inc.
- 8.5.1. Company overview
- 8.5.2. Key Executives
- 8.5.3. Company snapshot
- 8.5.4. Operating business segments
- 8.5.5. Product portfolio
- 8.5.6. Business performance
- 8.6. ICU Medical Inc.
- 8.6.1. Company overview
- 8.6.2. Key Executives
- 8.6.3. Company snapshot
- 8.6.4. Operating business segments
- 8.6.5. Product portfolio
- 8.6.6. Business performance
- 8.7. Vyaire Medical, Inc.
- 8.7.1. Company overview
- 8.7.2. Key Executives
- 8.7.3. Company snapshot
- 8.7.4. Operating business segments
- 8.7.5. Product portfolio
- 8.8. Becton, Dickinson and Company
- 8.8.1. Company overview
- 8.8.2. Key Executives
- 8.8.3. Company snapshot
- 8.8.4. Operating business segments
- 8.8.5. Product portfolio
- 8.8.6. Business performance
- 8.9. Teleflex Incorporated.
- 8.9.1. Company overview
- 8.9.2. Key Executives
- 8.9.3. Company snapshot
- 8.9.4. Operating business segments
- 8.9.5. Product portfolio
- 8.9.6. Business performance
- 8.10. Baxter International Inc.
- 8.10.1. Company overview
- 8.10.2. Key Executives
- 8.10.3. Company snapshot
- 8.10.4. Operating business segments
- 8.10.5. Product portfolio
- 8.10.6. Business performance