|
|
市場調査レポート
商品コード
1344270
研磨材市場:タイプ別、材料別、最終用途産業別:世界の機会分析と産業予測、2023-2032年Abrasives Market By Type, By Material, By End Use Industry : Global Opportunity Analysis and Industry Forecast, 2023-2032 |
||||||
|
|
|||||||
|
|||||||


| 研磨材市場:タイプ別、材料別、最終用途産業別:世界の機会分析と産業予測、2023-2032年 |
|
出版日: 2023年06月01日
発行: Allied Market Research
ページ情報: 英文 336 Pages
納期: 2~3営業日
|

- 全表示
- 概要
- 図表
- 目次
Allied Market Researchが発行した調査レポートによると、研磨材市場は2022年に426億米ドルと評価され、2023年から2032年にかけてCAGR 4.7%で成長し、2032年には670億米ドルに達すると予測されています。
研磨材は、摩耗のプロセスを通じて他の材料を研削、研磨、切断、成形するために使用される材料または物質です。硬度、強度、摩擦によって表面から物質を除去する能力によって特徴付けられます。研磨材は、天然鉱物、合成化合物、またはその両方の組み合わせなど、さまざまな形態で利用できます。また、粒子、粉末、化合物、コーティングまたは結合された材料の形態もあります。研磨材の主な目的は、材料の表面を摩耗させたり平滑にしたりすることです。これには、バリや粗いエッジなどの不要な材料を除去したり、研磨面や滑らかな面など、望ましい仕上げを実現したりすることが含まれます。
研磨材は、製造、自動車、建設、金属加工、木工、エレクトロニクスなどの業界で広く使用されています。これらは、金属、セラミック、ガラス、プラスチック、複合材料などのさまざまな材料の研削、サンディング、切断、研磨、バリ取り、成形などの用途に使用されています。研磨材の選択は、加工対象の材質、必要な精度レベル、用途の種類、作業の特定の要件などの要因によって異なります。研磨ディスク、砥石車、ベルト、砥石など、さまざまな種類の研磨材を適切な工具や機械と組み合わせて使用することで、望ましい結果が得られます。
可処分所得の増加、技術的アップグレード、相手先商標製品製造業者(OEM)の増加などの要因により、自動車産業は著しい成長を遂げています。例えば、India Brands Equity Foundationが発表した報告書によると、国内の自動車生産台数は2016年から20年にかけてCAGR2.36%で増加し、2020年には2,636万台がインドで生産されます。
研磨材は、自動車生産時の研削、サンディング、研磨用途や、自動車の修理・メンテナンスに幅広く使用されています。自動車セクターの成長と進化は研磨材市場に大きな影響を与えます。電気自動車(EV)の開発、アルミニウムや炭素繊維複合材料などの軽量素材の使用増加といった技術の進歩は、研磨材の需要に影響を与えます。例えば、電気自動車はその独特な部品の製造と組み立てに特殊な研磨工具を必要とします。さらに、美観と高品質の表面仕上げを重視する自動車業界は、研磨材の需要をさらに押し上げています。
さらに、製造業と工業分野の成長が研磨材市場の大きな促進要因となっています。研磨材は、研削、研磨、切断、仕上げなど、さまざまな製造工程で不可欠です。産業活動が拡大するにつれて研磨材の需要が増加し、市場成長を後押ししています。製造業には、自動車、航空宇宙、機械、電子機器、消費財など幅広い産業が含まれます。これらの産業はそれぞれ、程度の差こそあれ、製造作業において研磨材に依存しています。これらの産業が成長と革新を遂げるにつれ、研磨材の需要も相応に高まり、市場の成長を牽引しています。
しかし、研磨材市場は競争が激しく、世界レベルでも地域レベルでも多数のプレーヤーが活動しています。メーカーは、製品の品質、性能、価格、納品スピード、顧客サービスなどの要素に基づいて競争しています。既存市場プレイヤーの存在と新規競合企業の参入は、業界内の競争を激化させる。これは、価格圧力、利益率の低下、市場シェアを維持するための継続的な技術革新と差別化の必要性につながる可能性があります。競争の激化は市場の飽和と統合を招き、中小企業が効果的に競争することを困難にします。
これとは逆に、環境問題や持続可能性に対する意識の高まりは、研磨材市場成長の有力な促進要因になりつつあります。産業界と消費者は、環境に優しく持続可能な慣行や製品を優先するようになっています。これを受けて、研磨材メーカーはこうした需要に応え、世界の持続可能性目標に沿った持続可能なソリューションの開発に注力しています。例えば、リサイクル可能で排出量が少なく、環境に優しい研磨材製品が好まれるようになっています。また、メーカー各社は、製品の環境への影響を低減するため、天然材料やバイオベースの研磨材など、従来の研磨材に代わる素材を模索しています。持続可能な手法の採用は、環境問題に対処するだけでなく、市場差別化と競争優位性を提供します。
目次
第1章 イントロダクション
第2章 エグゼクティブサマリー
第3章 市場概要
- 市場の定義と範囲
- 主な調査結果
- 影響要因
- 主な投資機会
- ポーターのファイブフォース分析
- 市場力学
- 促進要因
- 建築・建設セクターからの需要の高まり
- 自動車セクターからの堅調な需要
- 製造・工業用地の急増
- 金属加工および機械産業からの需要増加
- 抑制要因
- 原材料価格の変動
- 激しい競合
- 機会
- 表面品質への注目の高まり
- 持続可能性への意識の高まり
- 促進要因
- COVID-19:市場への影響分析
- 価格分析
- バリューチェーン分析
- 主要規制分析
- 特許情勢
第4章 研磨材市場:タイプ別
- 概要
- 接着研磨材
- コーティング研磨材
- 超研磨材
第5章 研磨材市場:材料別
- 概要
- 天然
- 合成
第6章 研磨材市場:最終用途産業別
- 概要
- 自動車
- 金属加工
- 機械
- エレクトロニクス
- 建設
- その他
第7章 研磨材市場:地域別
- 概要
- 北米
- 米国
- カナダ
- メキシコ
- 欧州
- ドイツ
- 英国
- フランス
- スペイン
- イタリア
- その他欧州
- アジア太平洋
- 中国
- インド
- 日本
- 韓国
- オーストラリア
- その他アジア太平洋地域
- ラテンアメリカ・中東・アフリカ
- ブラジル
- サウジアラビア
- 南アフリカ
- その他ラテンアメリカ・中東・アフリカ
第8章 競合情勢
- イントロダクション
- 主要成功戦略
- 主要10企業の製品マッピング
- 競合ダッシュボード
- 競合ヒートマップ
- 主要企業のポジショニング、2022年
第9章 企業プロファイル
- Carborundum Universal Limited
- Saint-Gobain
- Robert Bosch Power Tools GmbH
- deerfos
- SAK ABRASIVES LIMITED
- Hindustan Abrasives
- Sterling Abrasives Limited
- Bullard Abrasives, Inc.
- 3M Company
- Osborn Lippert India Private Limited
LIST OF TABLES
- TABLE 01. GLOBAL ABRASIVES MARKET, BY TYPE, 2022-2032 ($MILLION)
- TABLE 02. GLOBAL ABRASIVES MARKET, BY TYPE, 2022-2032 (KILOTON)
- TABLE 03. ABRASIVES MARKET FOR BONDED ABRASIVES, BY REGION, 2022-2032 ($MILLION)
- TABLE 04. ABRASIVES MARKET FOR BONDED ABRASIVES, BY REGION, 2022-2032 (KILOTON)
- TABLE 05. ABRASIVES MARKET FOR COATED ABRASIVES, BY REGION, 2022-2032 ($MILLION)
- TABLE 06. ABRASIVES MARKET FOR COATED ABRASIVES, BY REGION, 2022-2032 (KILOTON)
- TABLE 07. ABRASIVES MARKET FOR SUPER ABRASIVES, BY REGION, 2022-2032 ($MILLION)
- TABLE 08. ABRASIVES MARKET FOR SUPER ABRASIVES, BY REGION, 2022-2032 (KILOTON)
- TABLE 09. GLOBAL ABRASIVES MARKET, BY MATERIAL, 2022-2032 ($MILLION)
- TABLE 10. GLOBAL ABRASIVES MARKET, BY MATERIAL, 2022-2032 (KILOTON)
- TABLE 11. ABRASIVES MARKET FOR NATURAL, BY REGION, 2022-2032 ($MILLION)
- TABLE 12. ABRASIVES MARKET FOR NATURAL, BY REGION, 2022-2032 (KILOTON)
- TABLE 13. ABRASIVES MARKET FOR SYNTHETIC, BY REGION, 2022-2032 ($MILLION)
- TABLE 14. ABRASIVES MARKET FOR SYNTHETIC, BY REGION, 2022-2032 (KILOTON)
- TABLE 15. GLOBAL ABRASIVES MARKET, BY END USE INDUSTRY, 2022-2032 ($MILLION)
- TABLE 16. GLOBAL ABRASIVES MARKET, BY END USE INDUSTRY, 2022-2032 (KILOTON)
- TABLE 17. ABRASIVES MARKET FOR AUTOMOTIVE, BY REGION, 2022-2032 ($MILLION)
- TABLE 18. ABRASIVES MARKET FOR AUTOMOTIVE, BY REGION, 2022-2032 (KILOTON)
- TABLE 19. ABRASIVES MARKET FOR METAL FABRICATION, BY REGION, 2022-2032 ($MILLION)
- TABLE 20. ABRASIVES MARKET FOR METAL FABRICATION, BY REGION, 2022-2032 (KILOTON)
- TABLE 21. ABRASIVES MARKET FOR MACHINERY, BY REGION, 2022-2032 ($MILLION)
- TABLE 22. ABRASIVES MARKET FOR MACHINERY, BY REGION, 2022-2032 (KILOTON)
- TABLE 23. ABRASIVES MARKET FOR ELECTRONICS, BY REGION, 2022-2032 ($MILLION)
- TABLE 24. ABRASIVES MARKET FOR ELECTRONICS, BY REGION, 2022-2032 (KILOTON)
- TABLE 25. ABRASIVES MARKET FOR CONSTRUCTION, BY REGION, 2022-2032 ($MILLION)
- TABLE 26. ABRASIVES MARKET FOR CONSTRUCTION, BY REGION, 2022-2032 (KILOTON)
- TABLE 27. ABRASIVES MARKET FOR OTHERS, BY REGION, 2022-2032 ($MILLION)
- TABLE 28. ABRASIVES MARKET FOR OTHERS, BY REGION, 2022-2032 (KILOTON)
- TABLE 29. ABRASIVES MARKET, BY REGION, 2022-2032 ($MILLION)
- TABLE 30. ABRASIVES MARKET, BY REGION, 2022-2032 (KILOTON)
- TABLE 31. NORTH AMERICA ABRASIVES MARKET, BY TYPE, 2022-2032 ($MILLION)
- TABLE 32. NORTH AMERICA ABRASIVES MARKET, BY TYPE, 2022-2032 (KILOTON)
- TABLE 33. NORTH AMERICA ABRASIVES MARKET, BY MATERIAL, 2022-2032 ($MILLION)
- TABLE 34. NORTH AMERICA ABRASIVES MARKET, BY MATERIAL, 2022-2032 (KILOTON)
- TABLE 35. NORTH AMERICA ABRASIVES MARKET, BY END USE INDUSTRY, 2022-2032 ($MILLION)
- TABLE 36. NORTH AMERICA ABRASIVES MARKET, BY END USE INDUSTRY, 2022-2032 (KILOTON)
- TABLE 37. NORTH AMERICA ABRASIVES MARKET, BY COUNTRY, 2022-2032 ($MILLION)
- TABLE 38. NORTH AMERICA ABRASIVES MARKET, BY COUNTRY, 2022-2032 (KILOTON)
- TABLE 39. U.S. ABRASIVES MARKET, BY TYPE, 2022-2032 ($MILLION)
- TABLE 40. U.S. ABRASIVES MARKET, BY TYPE, 2022-2032 (KILOTON)
- TABLE 41. U.S. ABRASIVES MARKET, BY MATERIAL, 2022-2032 ($MILLION)
- TABLE 42. U.S. ABRASIVES MARKET, BY MATERIAL, 2022-2032 (KILOTON)
- TABLE 43. U.S. ABRASIVES MARKET, BY END USE INDUSTRY, 2022-2032 ($MILLION)
- TABLE 44. U.S. ABRASIVES MARKET, BY END USE INDUSTRY, 2022-2032 (KILOTON)
- TABLE 45. CANADA ABRASIVES MARKET, BY TYPE, 2022-2032 ($MILLION)
- TABLE 46. CANADA ABRASIVES MARKET, BY TYPE, 2022-2032 (KILOTON)
- TABLE 47. CANADA ABRASIVES MARKET, BY MATERIAL, 2022-2032 ($MILLION)
- TABLE 48. CANADA ABRASIVES MARKET, BY MATERIAL, 2022-2032 (KILOTON)
- TABLE 49. CANADA ABRASIVES MARKET, BY END USE INDUSTRY, 2022-2032 ($MILLION)
- TABLE 50. CANADA ABRASIVES MARKET, BY END USE INDUSTRY, 2022-2032 (KILOTON)
- TABLE 51. MEXICO ABRASIVES MARKET, BY TYPE, 2022-2032 ($MILLION)
- TABLE 52. MEXICO ABRASIVES MARKET, BY TYPE, 2022-2032 (KILOTON)
- TABLE 53. MEXICO ABRASIVES MARKET, BY MATERIAL, 2022-2032 ($MILLION)
- TABLE 54. MEXICO ABRASIVES MARKET, BY MATERIAL, 2022-2032 (KILOTON)
- TABLE 55. MEXICO ABRASIVES MARKET, BY END USE INDUSTRY, 2022-2032 ($MILLION)
- TABLE 56. MEXICO ABRASIVES MARKET, BY END USE INDUSTRY, 2022-2032 (KILOTON)
- TABLE 57. EUROPE ABRASIVES MARKET, BY TYPE, 2022-2032 ($MILLION)
- TABLE 58. EUROPE ABRASIVES MARKET, BY TYPE, 2022-2032 (KILOTON)
- TABLE 59. EUROPE ABRASIVES MARKET, BY MATERIAL, 2022-2032 ($MILLION)
- TABLE 60. EUROPE ABRASIVES MARKET, BY MATERIAL, 2022-2032 (KILOTON)
- TABLE 61. EUROPE ABRASIVES MARKET, BY END USE INDUSTRY, 2022-2032 ($MILLION)
- TABLE 62. EUROPE ABRASIVES MARKET, BY END USE INDUSTRY, 2022-2032 (KILOTON)
- TABLE 63. EUROPE ABRASIVES MARKET, BY COUNTRY, 2022-2032 ($MILLION)
- TABLE 64. EUROPE ABRASIVES MARKET, BY COUNTRY, 2022-2032 (KILOTON)
- TABLE 65. GERMANY ABRASIVES MARKET, BY TYPE, 2022-2032 ($MILLION)
- TABLE 66. GERMANY ABRASIVES MARKET, BY TYPE, 2022-2032 (KILOTON)
- TABLE 67. GERMANY ABRASIVES MARKET, BY MATERIAL, 2022-2032 ($MILLION)
- TABLE 68. GERMANY ABRASIVES MARKET, BY MATERIAL, 2022-2032 (KILOTON)
- TABLE 69. GERMANY ABRASIVES MARKET, BY END USE INDUSTRY, 2022-2032 ($MILLION)
- TABLE 70. GERMANY ABRASIVES MARKET, BY END USE INDUSTRY, 2022-2032 (KILOTON)
- TABLE 71. UK ABRASIVES MARKET, BY TYPE, 2022-2032 ($MILLION)
- TABLE 72. UK ABRASIVES MARKET, BY TYPE, 2022-2032 (KILOTON)
- TABLE 73. UK ABRASIVES MARKET, BY MATERIAL, 2022-2032 ($MILLION)
- TABLE 74. UK ABRASIVES MARKET, BY MATERIAL, 2022-2032 (KILOTON)
- TABLE 75. UK ABRASIVES MARKET, BY END USE INDUSTRY, 2022-2032 ($MILLION)
- TABLE 76. UK ABRASIVES MARKET, BY END USE INDUSTRY, 2022-2032 (KILOTON)
- TABLE 77. FRANCE ABRASIVES MARKET, BY TYPE, 2022-2032 ($MILLION)
- TABLE 78. FRANCE ABRASIVES MARKET, BY TYPE, 2022-2032 (KILOTON)
- TABLE 79. FRANCE ABRASIVES MARKET, BY MATERIAL, 2022-2032 ($MILLION)
- TABLE 80. FRANCE ABRASIVES MARKET, BY MATERIAL, 2022-2032 (KILOTON)
- TABLE 81. FRANCE ABRASIVES MARKET, BY END USE INDUSTRY, 2022-2032 ($MILLION)
- TABLE 82. FRANCE ABRASIVES MARKET, BY END USE INDUSTRY, 2022-2032 (KILOTON)
- TABLE 83. SPAIN ABRASIVES MARKET, BY TYPE, 2022-2032 ($MILLION)
- TABLE 84. SPAIN ABRASIVES MARKET, BY TYPE, 2022-2032 (KILOTON)
- TABLE 85. SPAIN ABRASIVES MARKET, BY MATERIAL, 2022-2032 ($MILLION)
- TABLE 86. SPAIN ABRASIVES MARKET, BY MATERIAL, 2022-2032 (KILOTON)
- TABLE 87. SPAIN ABRASIVES MARKET, BY END USE INDUSTRY, 2022-2032 ($MILLION)
- TABLE 88. SPAIN ABRASIVES MARKET, BY END USE INDUSTRY, 2022-2032 (KILOTON)
- TABLE 89. ITALY ABRASIVES MARKET, BY TYPE, 2022-2032 ($MILLION)
- TABLE 90. ITALY ABRASIVES MARKET, BY TYPE, 2022-2032 (KILOTON)
- TABLE 91. ITALY ABRASIVES MARKET, BY MATERIAL, 2022-2032 ($MILLION)
- TABLE 92. ITALY ABRASIVES MARKET, BY MATERIAL, 2022-2032 (KILOTON)
- TABLE 93. ITALY ABRASIVES MARKET, BY END USE INDUSTRY, 2022-2032 ($MILLION)
- TABLE 94. ITALY ABRASIVES MARKET, BY END USE INDUSTRY, 2022-2032 (KILOTON)
- TABLE 95. REST OF EUROPE ABRASIVES MARKET, BY TYPE, 2022-2032 ($MILLION)
- TABLE 96. REST OF EUROPE ABRASIVES MARKET, BY TYPE, 2022-2032 (KILOTON)
- TABLE 97. REST OF EUROPE ABRASIVES MARKET, BY MATERIAL, 2022-2032 ($MILLION)
- TABLE 98. REST OF EUROPE ABRASIVES MARKET, BY MATERIAL, 2022-2032 (KILOTON)
- TABLE 99. REST OF EUROPE ABRASIVES MARKET, BY END USE INDUSTRY, 2022-2032 ($MILLION)
- TABLE 100. REST OF EUROPE ABRASIVES MARKET, BY END USE INDUSTRY, 2022-2032 (KILOTON)
- TABLE 101. ASIA-PACIFIC ABRASIVES MARKET, BY TYPE, 2022-2032 ($MILLION)
- TABLE 102. ASIA-PACIFIC ABRASIVES MARKET, BY TYPE, 2022-2032 (KILOTON)
- TABLE 103. ASIA-PACIFIC ABRASIVES MARKET, BY MATERIAL, 2022-2032 ($MILLION)
- TABLE 104. ASIA-PACIFIC ABRASIVES MARKET, BY MATERIAL, 2022-2032 (KILOTON)
- TABLE 105. ASIA-PACIFIC ABRASIVES MARKET, BY END USE INDUSTRY, 2022-2032 ($MILLION)
- TABLE 106. ASIA-PACIFIC ABRASIVES MARKET, BY END USE INDUSTRY, 2022-2032 (KILOTON)
- TABLE 107. ASIA-PACIFIC ABRASIVES MARKET, BY COUNTRY, 2022-2032 ($MILLION)
- TABLE 108. ASIA-PACIFIC ABRASIVES MARKET, BY COUNTRY, 2022-2032 (KILOTON)
- TABLE 109. CHINA ABRASIVES MARKET, BY TYPE, 2022-2032 ($MILLION)
- TABLE 110. CHINA ABRASIVES MARKET, BY TYPE, 2022-2032 (KILOTON)
- TABLE 111. CHINA ABRASIVES MARKET, BY MATERIAL, 2022-2032 ($MILLION)
- TABLE 112. CHINA ABRASIVES MARKET, BY MATERIAL, 2022-2032 (KILOTON)
- TABLE 113. CHINA ABRASIVES MARKET, BY END USE INDUSTRY, 2022-2032 ($MILLION)
- TABLE 114. CHINA ABRASIVES MARKET, BY END USE INDUSTRY, 2022-2032 (KILOTON)
- TABLE 115. INDIA ABRASIVES MARKET, BY TYPE, 2022-2032 ($MILLION)
- TABLE 116. INDIA ABRASIVES MARKET, BY TYPE, 2022-2032 (KILOTON)
- TABLE 117. INDIA ABRASIVES MARKET, BY MATERIAL, 2022-2032 ($MILLION)
- TABLE 118. INDIA ABRASIVES MARKET, BY MATERIAL, 2022-2032 (KILOTON)
- TABLE 119. INDIA ABRASIVES MARKET, BY END USE INDUSTRY, 2022-2032 ($MILLION)
- TABLE 120. INDIA ABRASIVES MARKET, BY END USE INDUSTRY, 2022-2032 (KILOTON)
- TABLE 121. JAPAN ABRASIVES MARKET, BY TYPE, 2022-2032 ($MILLION)
- TABLE 122. JAPAN ABRASIVES MARKET, BY TYPE, 2022-2032 (KILOTON)
- TABLE 123. JAPAN ABRASIVES MARKET, BY MATERIAL, 2022-2032 ($MILLION)
- TABLE 124. JAPAN ABRASIVES MARKET, BY MATERIAL, 2022-2032 (KILOTON)
- TABLE 125. JAPAN ABRASIVES MARKET, BY END USE INDUSTRY, 2022-2032 ($MILLION)
- TABLE 126. JAPAN ABRASIVES MARKET, BY END USE INDUSTRY, 2022-2032 (KILOTON)
- TABLE 127. SOUTH KOREA ABRASIVES MARKET, BY TYPE, 2022-2032 ($MILLION)
- TABLE 128. SOUTH KOREA ABRASIVES MARKET, BY TYPE, 2022-2032 (KILOTON)
- TABLE 129. SOUTH KOREA ABRASIVES MARKET, BY MATERIAL, 2022-2032 ($MILLION)
- TABLE 130. SOUTH KOREA ABRASIVES MARKET, BY MATERIAL, 2022-2032 (KILOTON)
- TABLE 131. SOUTH KOREA ABRASIVES MARKET, BY END USE INDUSTRY, 2022-2032 ($MILLION)
- TABLE 132. SOUTH KOREA ABRASIVES MARKET, BY END USE INDUSTRY, 2022-2032 (KILOTON)
- TABLE 133. AUSTRALIA ABRASIVES MARKET, BY TYPE, 2022-2032 ($MILLION)
- TABLE 134. AUSTRALIA ABRASIVES MARKET, BY TYPE, 2022-2032 (KILOTON)
- TABLE 135. AUSTRALIA ABRASIVES MARKET, BY MATERIAL, 2022-2032 ($MILLION)
- TABLE 136. AUSTRALIA ABRASIVES MARKET, BY MATERIAL, 2022-2032 (KILOTON)
- TABLE 137. AUSTRALIA ABRASIVES MARKET, BY END USE INDUSTRY, 2022-2032 ($MILLION)
- TABLE 138. AUSTRALIA ABRASIVES MARKET, BY END USE INDUSTRY, 2022-2032 (KILOTON)
- TABLE 139. REST OF ASIA-PACIFIC ABRASIVES MARKET, BY TYPE, 2022-2032 ($MILLION)
- TABLE 140. REST OF ASIA-PACIFIC ABRASIVES MARKET, BY TYPE, 2022-2032 (KILOTON)
- TABLE 141. REST OF ASIA-PACIFIC ABRASIVES MARKET, BY MATERIAL, 2022-2032 ($MILLION)
- TABLE 142. REST OF ASIA-PACIFIC ABRASIVES MARKET, BY MATERIAL, 2022-2032 (KILOTON)
- TABLE 143. REST OF ASIA-PACIFIC ABRASIVES MARKET, BY END USE INDUSTRY, 2022-2032 ($MILLION)
- TABLE 144. REST OF ASIA-PACIFIC ABRASIVES MARKET, BY END USE INDUSTRY, 2022-2032 (KILOTON)
- TABLE 145. LAMEA ABRASIVES MARKET, BY TYPE, 2022-2032 ($MILLION)
- TABLE 146. LAMEA ABRASIVES MARKET, BY TYPE, 2022-2032 (KILOTON)
- TABLE 147. LAMEA ABRASIVES MARKET, BY MATERIAL, 2022-2032 ($MILLION)
- TABLE 148. LAMEA ABRASIVES MARKET, BY MATERIAL, 2022-2032 (KILOTON)
- TABLE 149. LAMEA ABRASIVES MARKET, BY END USE INDUSTRY, 2022-2032 ($MILLION)
- TABLE 150. LAMEA ABRASIVES MARKET, BY END USE INDUSTRY, 2022-2032 (KILOTON)
- TABLE 151. LAMEA ABRASIVES MARKET, BY COUNTRY, 2022-2032 ($MILLION)
- TABLE 152. LAMEA ABRASIVES MARKET, BY COUNTRY, 2022-2032 (KILOTON)
- TABLE 153. BRAZIL ABRASIVES MARKET, BY TYPE, 2022-2032 ($MILLION)
- TABLE 154. BRAZIL ABRASIVES MARKET, BY TYPE, 2022-2032 (KILOTON)
- TABLE 155. BRAZIL ABRASIVES MARKET, BY MATERIAL, 2022-2032 ($MILLION)
- TABLE 156. BRAZIL ABRASIVES MARKET, BY MATERIAL, 2022-2032 (KILOTON)
- TABLE 157. BRAZIL ABRASIVES MARKET, BY END USE INDUSTRY, 2022-2032 ($MILLION)
- TABLE 158. BRAZIL ABRASIVES MARKET, BY END USE INDUSTRY, 2022-2032 (KILOTON)
- TABLE 159. SAUDI ARABIA ABRASIVES MARKET, BY TYPE, 2022-2032 ($MILLION)
- TABLE 160. SAUDI ARABIA ABRASIVES MARKET, BY TYPE, 2022-2032 (KILOTON)
- TABLE 161. SAUDI ARABIA ABRASIVES MARKET, BY MATERIAL, 2022-2032 ($MILLION)
- TABLE 162. SAUDI ARABIA ABRASIVES MARKET, BY MATERIAL, 2022-2032 (KILOTON)
- TABLE 163. SAUDI ARABIA ABRASIVES MARKET, BY END USE INDUSTRY, 2022-2032 ($MILLION)
- TABLE 164. SAUDI ARABIA ABRASIVES MARKET, BY END USE INDUSTRY, 2022-2032 (KILOTON)
- TABLE 165. SOUTH AFRICA ABRASIVES MARKET, BY TYPE, 2022-2032 ($MILLION)
- TABLE 166. SOUTH AFRICA ABRASIVES MARKET, BY TYPE, 2022-2032 (KILOTON)
- TABLE 167. SOUTH AFRICA ABRASIVES MARKET, BY MATERIAL, 2022-2032 ($MILLION)
- TABLE 168. SOUTH AFRICA ABRASIVES MARKET, BY MATERIAL, 2022-2032 (KILOTON)
- TABLE 169. SOUTH AFRICA ABRASIVES MARKET, BY END USE INDUSTRY, 2022-2032 ($MILLION)
- TABLE 170. SOUTH AFRICA ABRASIVES MARKET, BY END USE INDUSTRY, 2022-2032 (KILOTON)
- TABLE 171. REST OF LAMEA ABRASIVES MARKET, BY TYPE, 2022-2032 ($MILLION)
- TABLE 172. REST OF LAMEA ABRASIVES MARKET, BY TYPE, 2022-2032 (KILOTON)
- TABLE 173. REST OF LAMEA ABRASIVES MARKET, BY MATERIAL, 2022-2032 ($MILLION)
- TABLE 174. REST OF LAMEA ABRASIVES MARKET, BY MATERIAL, 2022-2032 (KILOTON)
- TABLE 175. REST OF LAMEA ABRASIVES MARKET, BY END USE INDUSTRY, 2022-2032 ($MILLION)
- TABLE 176. REST OF LAMEA ABRASIVES MARKET, BY END USE INDUSTRY, 2022-2032 (KILOTON)
- TABLE 177. CARBORUNDUM UNIVERSAL LIMITED: KEY EXECUTIVES
- TABLE 178. CARBORUNDUM UNIVERSAL LIMITED: COMPANY SNAPSHOT
- TABLE 179. CARBORUNDUM UNIVERSAL LIMITED: PRODUCT SEGMENTS
- TABLE 180. CARBORUNDUM UNIVERSAL LIMITED: PRODUCT PORTFOLIO
- TABLE 181. SAINT-GOBAIN: KEY EXECUTIVES
- TABLE 182. SAINT-GOBAIN: COMPANY SNAPSHOT
- TABLE 183. SAINT-GOBAIN: PRODUCT SEGMENTS
- TABLE 184. SAINT-GOBAIN: PRODUCT PORTFOLIO
- TABLE 185. ROBERT BOSCH POWER TOOLS GMBH: KEY EXECUTIVES
- TABLE 186. ROBERT BOSCH POWER TOOLS GMBH: COMPANY SNAPSHOT
- TABLE 187. ROBERT BOSCH POWER TOOLS GMBH: PRODUCT SEGMENTS
- TABLE 188. ROBERT BOSCH POWER TOOLS GMBH: PRODUCT PORTFOLIO
- TABLE 189. DEERFOS: KEY EXECUTIVES
- TABLE 190. DEERFOS: COMPANY SNAPSHOT
- TABLE 191. DEERFOS: PRODUCT SEGMENTS
- TABLE 192. DEERFOS: PRODUCT PORTFOLIO
- TABLE 193. SAK ABRASIVES LIMITED: KEY EXECUTIVES
- TABLE 194. SAK ABRASIVES LIMITED: COMPANY SNAPSHOT
- TABLE 195. SAK ABRASIVES LIMITED: PRODUCT SEGMENTS
- TABLE 196. SAK ABRASIVES LIMITED: PRODUCT PORTFOLIO
- TABLE 197. HINDUSTAN ABRASIVES: KEY EXECUTIVES
- TABLE 198. HINDUSTAN ABRASIVES: COMPANY SNAPSHOT
- TABLE 199. HINDUSTAN ABRASIVES: PRODUCT SEGMENTS
- TABLE 200. HINDUSTAN ABRASIVES: PRODUCT PORTFOLIO
- TABLE 201. STERLING ABRASIVES LIMITED: KEY EXECUTIVES
- TABLE 202. STERLING ABRASIVES LIMITED: COMPANY SNAPSHOT
- TABLE 203. STERLING ABRASIVES LIMITED: PRODUCT SEGMENTS
- TABLE 204. STERLING ABRASIVES LIMITED: PRODUCT PORTFOLIO
- TABLE 205. BULLARD ABRASIVES, INC.: KEY EXECUTIVES
- TABLE 206. BULLARD ABRASIVES, INC.: COMPANY SNAPSHOT
- TABLE 207. BULLARD ABRASIVES, INC.: PRODUCT SEGMENTS
- TABLE 208. BULLARD ABRASIVES, INC.: PRODUCT PORTFOLIO
- TABLE 209. 3M COMPANY: KEY EXECUTIVES
- TABLE 210. 3M COMPANY: COMPANY SNAPSHOT
- TABLE 211. 3M COMPANY: PRODUCT SEGMENTS
- TABLE 212. 3M COMPANY: PRODUCT PORTFOLIO
- TABLE 213. OSBORN LIPPERT INDIA PRIVATE LIMITED.: KEY EXECUTIVES
- TABLE 214. OSBORN LIPPERT INDIA PRIVATE LIMITED.: COMPANY SNAPSHOT
- TABLE 215. OSBORN LIPPERT INDIA PRIVATE LIMITED.: PRODUCT SEGMENTS
- TABLE 216. OSBORN LIPPERT INDIA PRIVATE LIMITED.: PRODUCT PORTFOLIO
LIST OF FIGURES
- FIGURE 01. ABRASIVES MARKET, 2022-2032
- FIGURE 02. SEGMENTATION OF ABRASIVES MARKET, 2022-2032
- FIGURE 03. TOP INVESTMENT POCKETS IN ABRASIVES MARKET (2023-2032)
- FIGURE 04. MODERATE BARGAINING POWER OF SUPPLIERS
- FIGURE 05. MODERATE THREAT OF NEW ENTRANTS
- FIGURE 06. MODERATE THREAT OF SUBSTITUTES
- FIGURE 07. MODERATE INTENSITY OF RIVALRY
- FIGURE 08. MODERATE BARGAINING POWER OF BUYERS
- FIGURE 09. DRIVERS, RESTRAINTS AND OPPORTUNITIES: GLOBALABRASIVES MARKET
- FIGURE 10. PRICING ANALYSIS: ABRASIVES MARKET 2022 AND 2032
- FIGURE 11. IMPACT OF KEY REGULATION: ABRASIVES MARKET
- FIGURE 12. PATENT ANALYSIS BY COMPANY
- FIGURE 13. PATENT ANALYSIS BY COUNTRY
- FIGURE 13. ABRASIVES MARKET, BY TYPE, 2022(%)
- FIGURE 14. COMPARATIVE SHARE ANALYSIS OF ABRASIVES MARKET FOR BONDED ABRASIVES, BY COUNTRY 2022 AND 2032(%)
- FIGURE 15. COMPARATIVE SHARE ANALYSIS OF ABRASIVES MARKET FOR COATED ABRASIVES, BY COUNTRY 2022 AND 2032(%)
- FIGURE 16. COMPARATIVE SHARE ANALYSIS OF ABRASIVES MARKET FOR SUPER ABRASIVES, BY COUNTRY 2022 AND 2032(%)
- FIGURE 17. ABRASIVES MARKET, BY MATERIAL, 2022(%)
- FIGURE 18. COMPARATIVE SHARE ANALYSIS OF ABRASIVES MARKET FOR NATURAL, BY COUNTRY 2022 AND 2032(%)
- FIGURE 19. COMPARATIVE SHARE ANALYSIS OF ABRASIVES MARKET FOR SYNTHETIC, BY COUNTRY 2022 AND 2032(%)
- FIGURE 20. ABRASIVES MARKET, BY END USE INDUSTRY, 2022(%)
- FIGURE 21. COMPARATIVE SHARE ANALYSIS OF ABRASIVES MARKET FOR AUTOMOTIVE, BY COUNTRY 2022 AND 2032(%)
- FIGURE 22. COMPARATIVE SHARE ANALYSIS OF ABRASIVES MARKET FOR METAL FABRICATION, BY COUNTRY 2022 AND 2032(%)
- FIGURE 23. COMPARATIVE SHARE ANALYSIS OF ABRASIVES MARKET FOR MACHINERY, BY COUNTRY 2022 AND 2032(%)
- FIGURE 24. COMPARATIVE SHARE ANALYSIS OF ABRASIVES MARKET FOR ELECTRONICS, BY COUNTRY 2022 AND 2032(%)
- FIGURE 25. COMPARATIVE SHARE ANALYSIS OF ABRASIVES MARKET FOR CONSTRUCTION, BY COUNTRY 2022 AND 2032(%)
- FIGURE 26. COMPARATIVE SHARE ANALYSIS OF ABRASIVES MARKET FOR OTHERS, BY COUNTRY 2022 AND 2032(%)
- FIGURE 27. ABRASIVES MARKET BY REGION, 2022
- FIGURE 28. U.S. ABRASIVES MARKET, 2022-2032 ($MILLION)
- FIGURE 29. CANADA ABRASIVES MARKET, 2022-2032 ($MILLION)
- FIGURE 30. MEXICO ABRASIVES MARKET, 2022-2032 ($MILLION)
- FIGURE 31. GERMANY ABRASIVES MARKET, 2022-2032 ($MILLION)
- FIGURE 32. UK ABRASIVES MARKET, 2022-2032 ($MILLION)
- FIGURE 33. FRANCE ABRASIVES MARKET, 2022-2032 ($MILLION)
- FIGURE 34. SPAIN ABRASIVES MARKET, 2022-2032 ($MILLION)
- FIGURE 35. ITALY ABRASIVES MARKET, 2022-2032 ($MILLION)
- FIGURE 36. REST OF EUROPE ABRASIVES MARKET, 2022-2032 ($MILLION)
- FIGURE 37. CHINA ABRASIVES MARKET, 2022-2032 ($MILLION)
- FIGURE 38. INDIA ABRASIVES MARKET, 2022-2032 ($MILLION)
- FIGURE 39. JAPAN ABRASIVES MARKET, 2022-2032 ($MILLION)
- FIGURE 40. SOUTH KOREA ABRASIVES MARKET, 2022-2032 ($MILLION)
- FIGURE 41. AUSTRALIA ABRASIVES MARKET, 2022-2032 ($MILLION)
- FIGURE 42. REST OF ASIA-PACIFIC ABRASIVES MARKET, 2022-2032 ($MILLION)
- FIGURE 43. BRAZIL ABRASIVES MARKET, 2022-2032 ($MILLION)
- FIGURE 44. SAUDI ARABIA ABRASIVES MARKET, 2022-2032 ($MILLION)
- FIGURE 45. SOUTH AFRICA ABRASIVES MARKET, 2022-2032 ($MILLION)
- FIGURE 46. REST OF LAMEA ABRASIVES MARKET, 2022-2032 ($MILLION)
- FIGURE 47. TOP WINNING STRATEGIES, BY YEAR
- FIGURE 48. TOP WINNING STRATEGIES, BY DEVELOPMENT
- FIGURE 49. TOP WINNING STRATEGIES, BY COMPANY
- FIGURE 50. PRODUCT MAPPING OF TOP 10 PLAYERS
- FIGURE 51. COMPETITIVE DASHBOARD
- FIGURE 52. COMPETITIVE HEATMAP: ABRASIVES MARKET
- FIGURE 53. TOP PLAYER POSITIONING, 2022
- FIGURE 54. CARBORUNDUM UNIVERSAL LIMITED: NET SALES, 2020-2022 ($MILLION)
- FIGURE 55. CARBORUNDUM UNIVERSAL LIMITED: REVENUE SHARE BY SEGMENT, 2021 (%)
- FIGURE 56. CARBORUNDUM UNIVERSAL LIMITED: REVENUE SHARE BY REGION, 2021 (%)
- FIGURE 57. SAINT-GOBAIN: NET REVENUE, 2020-2022 ($MILLION)
- FIGURE 58. SAINT-GOBAIN: REVENUE SHARE BY REGION, 2022 (%)
- FIGURE 59. 3M COMPANY: NET REVENUE, 2020-2022 ($MILLION)
- FIGURE 60. 3M COMPANY: RESEARCH & DEVELOPMENT EXPENDITURE, 2020-2022 ($MILLION)
- FIGURE 61. 3M COMPANY: REVENUE SHARE BY SEGMENT, 2022 (%)
- FIGURE 62. 3M COMPANY: REVENUE SHARE BY REGION, 2022 (%)
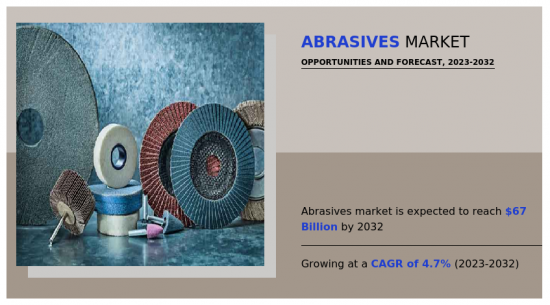
According to a new report published by Allied Market Research, titled, "Abrasives Market," The abrasives market was valued at $42.6 billion in 2022, and is estimated to reach $67 billion by 2032, growing at a CAGR of 4.7% from 2023 to 2032.
Abrasives are materials or substances that are used for grinding, polishing, cutting, or shaping other materials through the process of abrasion. They are characterized by their hardness, strength, and ability to remove material from surfaces through friction. Abrasives are available in various forms, including natural minerals, synthetic compounds, or a combination of both. They can be in the form of grains, powders, compounds, or coated or bonded materials. The main purpose of abrasives is to alter the surface of a material by wearing it down or smoothing it out. This can involve removing unwanted material, such as burrs or rough edges, or achieving a desired finish, such as a polished or smooth surface.
Abrasives are widely used in industries such as manufacturing, automotive, construction, metalworking, woodworking, electronics, and many others. They are employed in various applications, including grinding, sanding, cutting, polishing, deburring, and shaping different materials such as metals, ceramics, glass, plastics, and composites. The choice of abrasives depends on factors such as the material being worked on, the desired level of precision, the type of application, and specific requirements of the task. Different types of abrasives, such as abrasive discs, grinding wheels, belts, or stones, are used in conjunction with appropriate tools or machinery to achieve the desired results.
Factors such as increase in disposable income, technological upgrades, and spurring rise in original equipment manufacturers (OEMs) have led the automotive sector to witness a significant growth. For instance, according to a report published by India Brands Equity Foundation, the domestic automobile production increased by a compound annual growth rate (CAGR) of 2.36% from 2016-20 with 26.36 million vehicles being manufactured in India in 2020.
Abrasives find extensive use in grinding, sanding, and polishing applications during vehicle production, as well as in automotive repair and maintenance. The automotive sector's growth and evolution significantly impact the abrasives market. Technological advancements, such as the development of electric vehicles (Evs) and the rise in use of lightweight materials such as aluminum and carbon fiber composites, influence the demand for abrasives. Evs, for instance, require specialized abrasive tools for the manufacturing and assembly of their unique components. Moreover, the automotive industry's focus on aesthetics and high-quality surface finishes further drives the demand for abrasives.
Furthermore, the growth of manufacturing and industrial sectors is a significant driver of the abrasives market. Abrasives are indispensable in various manufacturing processes, including grinding, polishing, cutting, and finishing. As industrial activities expand, the demand for abrasives increases, thus propelling market growth. The manufacturing sector encompasses a broad range of industries, including automotive, aerospace, machinery, electronics, consumer goods, and many more. Each of these industries relies on abrasives to varying degrees for their manufacturing operations. As these industries experience growth and innovation, the demand for abrasives correspondingly rise, thus driving the growth of the market.
However, the abrasives market is highly competitive, with numerous players operating on both, global and regional levels. Manufacturers compete based on factors such as product quality, performance, price, delivery speed, and customer service. The presence of established market players and entry of new competitors intensifies competition within the industry. This can lead to price pressures, reduced profit margins, and the need for continuous innovation and differentiation to maintain market share. Intense competition can also result in market saturation and consolidation, making it challenging for smaller players to compete effectively.
On the contrary, rise in awareness of environmental concerns and sustainability is becoming an influential driver for the growth of the abrasives market. Industries and consumers are increasingly prioritizing eco-friendly and sustainable practices and products. In response, abrasives manufacturers focus on developing sustainable solutions to meet these demands and align with global sustainability goals. For example, there is a rise in preference for abrasive products that are recyclable, low in emissions, and environmentally friendly. In addition, manufacturers are exploring alternatives to traditional abrasive materials, such as natural and bio-based abrasives, to reduce the environmental impact of their products. Adoption of sustainable practices addresses environmental concerns as well as offer market differentiation and competitive advantage.
The abrasives market is segmented on the basis of type, material, end-use industry, and region. On the basis of type, the market is categorized into bonded abrasives, coated abrasives, and super abrasives. On the basis of material, it is divided into natural abrasives and synthetic abrasives. On the basis of end-use industry, it is classified into automotive, metal fabrication, machinery, electronics, construction, and others. Region-wise, the market is studied across North America, Europe, Asia-Pacific, and LAMEA.
The global abrasives market profiles leading players that include: 3M Company, Bullard Abrasives, Inc., Carborundum Universal Limited, Deerfos, Hindustan Abrasives, Osborn Lippert India Private Limited., Robert Bosch Power Tools GmbH, Saint-Gobain, SAK ABRASIVES LIMITED, and Sterling Abrasives Limited. The global abrasives market report provides in-depth competitive analysis as well as profiles of these major players.
Key Benefits For Stakeholders
- This report provides a quantitative analysis of the market segments, current trends, estimations, and dynamics of the abrasives market analysis from 2022 to 2032 to identify the prevailing abrasives market opportunities.
- The market research is offered along with information related to key drivers, restraints, and opportunities.
- Porter's five forces analysis highlights the potency of buyers and suppliers to enable stakeholders make profit-oriented business decisions and strengthen their supplier-buyer network.
- In-depth analysis of the abrasives market segmentation assists to determine the prevailing market opportunities.
- Major countries in each region are mapped according to their revenue contribution to the global market.
- Market player positioning facilitates benchmarking and provides a clear understanding of the present position of the market players.
- The report includes the analysis of the regional as well as global abrasives market trends, key players, market segments, application areas, and market growth strategies.
Key Market Segments
By Type
- Bonded Abrasives
- Coated Abrasives
- Super Abrasives
By Material
- Natural
- Synthetic
By End Use Industry
- Automotive
- Metal Fabrication
- Machinery
- Electronics
- Construction
- Others
By Region
- North America
- U.S.
- Canada
- Mexico
- Europe
- Germany
- UK
- France
- Spain
- Italy
- Rest of Europe
- Asia-Pacific
- China
- India
- Japan
- South Korea
- Australia
- Rest of Asia-Pacific
- LAMEA
- Brazil
- Saudi Arabia
- South Africa
- Rest of LAMEA
Key Market Players:
- 3M Company
- Bullard Abrasives, Inc.
- Carborundum Universal Limited
- deerfos
- Hindustan Abrasives
- Osborn Lippert India Private Limited.
- Robert Bosch Power Tools GmbH
- Saint-Gobain
- SAK ABRASIVES LIMITED
- Sterling Abrasives Limited
TABLE OF CONTENTS
CHAPTER 1: INTRODUCTION
- 1.1. Report description
- 1.2. Key market segments
- 1.3. Key benefits to the stakeholders
- 1.4. Research Methodology
- 1.4.1. Primary research
- 1.4.2. Secondary research
- 1.4.3. Analyst tools and models
CHAPTER 2: EXECUTIVE SUMMARY
- 2.1. CXO Perspective
CHAPTER 3: MARKET OVERVIEW
- 3.1. Market definition and scope
- 3.2. Key findings
- 3.2.1. Top impacting factors
- 3.2.2. Top investment pockets
- 3.3. Porter's five forces analysis
- 3.3.1. Moderate bargaining power of suppliers
- 3.3.2. Moderate threat of new entrants
- 3.3.3. Moderate threat of substitutes
- 3.3.4. Moderate intensity of rivalry
- 3.3.5. Moderate bargaining power of buyers
- 3.4. Market dynamics
- 3.4.1. Drivers
- 3.4.1.1. Escalating demand from building & construction sector
- 3.4.1.2. Robust demand from automotive sector
- 3.4.1.3. Rapid establishments of manufacturing and industrial sites
- 3.4.1.4. Rise in demand from metal fabrication and machinery industries
- 3.4.1. Drivers
- 3.4.2. Restraints
- 3.4.2.1. Volatility in raw material prices
- 3.4.2.2. Intense competition
- 3.4.3. Opportunities
- 3.4.3.1. Increase in focus on surface quality
- 3.4.3.2. Growing awareness of sustainability
- 3.5. COVID-19 Impact Analysis on the market
- 3.6. Pricing Analysis
- 3.7. Value Chain Analysis
- 3.8. Key Regulation Analysis
- 3.9. Patent Landscape
CHAPTER 4: ABRASIVES MARKET, BY TYPE
- 4.1. Overview
- 4.1.1. Market size and forecast
- 4.2. Bonded Abrasives
- 4.2.1. Key market trends, growth factors and opportunities
- 4.2.2. Market size and forecast, by region
- 4.2.3. Market share analysis by country
- 4.3. Coated Abrasives
- 4.3.1. Key market trends, growth factors and opportunities
- 4.3.2. Market size and forecast, by region
- 4.3.3. Market share analysis by country
- 4.4. Super Abrasives
- 4.4.1. Key market trends, growth factors and opportunities
- 4.4.2. Market size and forecast, by region
- 4.4.3. Market share analysis by country
CHAPTER 5: ABRASIVES MARKET, BY MATERIAL
- 5.1. Overview
- 5.1.1. Market size and forecast
- 5.2. Natural
- 5.2.1. Key market trends, growth factors and opportunities
- 5.2.2. Market size and forecast, by region
- 5.2.3. Market share analysis by country
- 5.3. Synthetic
- 5.3.1. Key market trends, growth factors and opportunities
- 5.3.2. Market size and forecast, by region
- 5.3.3. Market share analysis by country
CHAPTER 6: ABRASIVES MARKET, BY END USE INDUSTRY
- 6.1. Overview
- 6.1.1. Market size and forecast
- 6.2. Automotive
- 6.2.1. Key market trends, growth factors and opportunities
- 6.2.2. Market size and forecast, by region
- 6.2.3. Market share analysis by country
- 6.3. Metal Fabrication
- 6.3.1. Key market trends, growth factors and opportunities
- 6.3.2. Market size and forecast, by region
- 6.3.3. Market share analysis by country
- 6.4. Machinery
- 6.4.1. Key market trends, growth factors and opportunities
- 6.4.2. Market size and forecast, by region
- 6.4.3. Market share analysis by country
- 6.5. Electronics
- 6.5.1. Key market trends, growth factors and opportunities
- 6.5.2. Market size and forecast, by region
- 6.5.3. Market share analysis by country
- 6.6. Construction
- 6.6.1. Key market trends, growth factors and opportunities
- 6.6.2. Market size and forecast, by region
- 6.6.3. Market share analysis by country
- 6.7. Others
- 6.7.1. Key market trends, growth factors and opportunities
- 6.7.2. Market size and forecast, by region
- 6.7.3. Market share analysis by country
CHAPTER 7: ABRASIVES MARKET, BY REGION
- 7.1. Overview
- 7.1.1. Market size and forecast By Region
- 7.2. North America
- 7.2.1. Key trends and opportunities
- 7.2.2. Market size and forecast, by Type
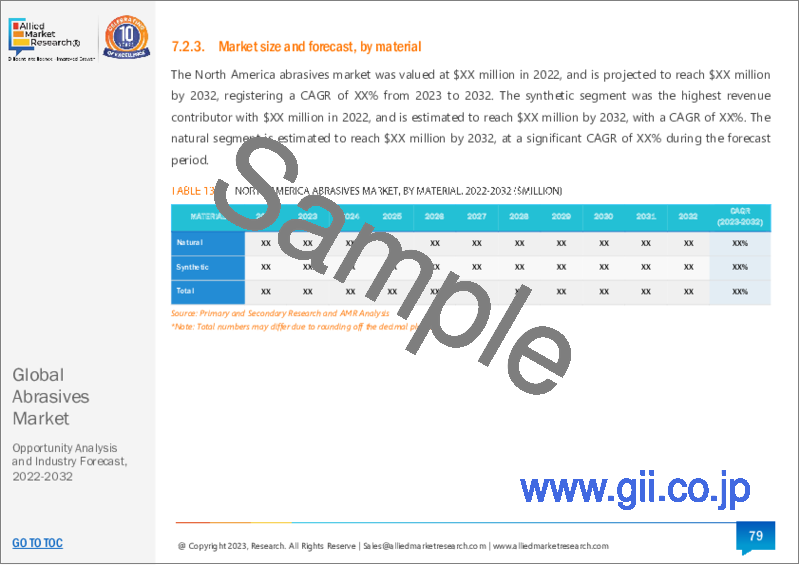
- 7.2.3. Market size and forecast, by Material
- 7.2.4. Market size and forecast, by End Use Industry
- 7.2.5. Market size and forecast, by country
- 7.2.5.1. U.S.
- 7.2.5.1.1. Key market trends, growth factors and opportunities
- 7.2.5.1.2. Market size and forecast, by Type
- 7.2.5.1.3. Market size and forecast, by Material
- 7.2.5.1.4. Market size and forecast, by End Use Industry
- 7.2.5.2. Canada
- 7.2.5.2.1. Key market trends, growth factors and opportunities
- 7.2.5.2.2. Market size and forecast, by Type
- 7.2.5.2.3. Market size and forecast, by Material
- 7.2.5.2.4. Market size and forecast, by End Use Industry
- 7.2.5.3. Mexico
- 7.2.5.3.1. Key market trends, growth factors and opportunities
- 7.2.5.3.2. Market size and forecast, by Type
- 7.2.5.3.3. Market size and forecast, by Material
- 7.2.5.3.4. Market size and forecast, by End Use Industry
- 7.3. Europe
- 7.3.1. Key trends and opportunities
- 7.3.2. Market size and forecast, by Type
- 7.3.3. Market size and forecast, by Material
- 7.3.4. Market size and forecast, by End Use Industry
- 7.3.5. Market size and forecast, by country
- 7.3.5.1. Germany
- 7.3.5.1.1. Key market trends, growth factors and opportunities
- 7.3.5.1.2. Market size and forecast, by Type
- 7.3.5.1.3. Market size and forecast, by Material
- 7.3.5.1.4. Market size and forecast, by End Use Industry
- 7.3.5.2. UK
- 7.3.5.2.1. Key market trends, growth factors and opportunities
- 7.3.5.2.2. Market size and forecast, by Type
- 7.3.5.2.3. Market size and forecast, by Material
- 7.3.5.2.4. Market size and forecast, by End Use Industry
- 7.3.5.3. France
- 7.3.5.3.1. Key market trends, growth factors and opportunities
- 7.3.5.3.2. Market size and forecast, by Type
- 7.3.5.3.3. Market size and forecast, by Material
- 7.3.5.3.4. Market size and forecast, by End Use Industry
- 7.3.5.4. Spain
- 7.3.5.4.1. Key market trends, growth factors and opportunities
- 7.3.5.4.2. Market size and forecast, by Type
- 7.3.5.4.3. Market size and forecast, by Material
- 7.3.5.4.4. Market size and forecast, by End Use Industry
- 7.3.5.5. Italy
- 7.3.5.5.1. Key market trends, growth factors and opportunities
- 7.3.5.5.2. Market size and forecast, by Type
- 7.3.5.5.3. Market size and forecast, by Material
- 7.3.5.5.4. Market size and forecast, by End Use Industry
- 7.3.5.6. Rest of Europe
- 7.3.5.6.1. Key market trends, growth factors and opportunities
- 7.3.5.6.2. Market size and forecast, by Type
- 7.3.5.6.3. Market size and forecast, by Material
- 7.3.5.6.4. Market size and forecast, by End Use Industry
- 7.4. Asia-Pacific
- 7.4.1. Key trends and opportunities
- 7.4.2. Market size and forecast, by Type
- 7.4.3. Market size and forecast, by Material
- 7.4.4. Market size and forecast, by End Use Industry
- 7.4.5. Market size and forecast, by country
- 7.4.5.1. China
- 7.4.5.1.1. Key market trends, growth factors and opportunities
- 7.4.5.1.2. Market size and forecast, by Type
- 7.4.5.1.3. Market size and forecast, by Material
- 7.4.5.1.4. Market size and forecast, by End Use Industry
- 7.4.5.2. India
- 7.4.5.2.1. Key market trends, growth factors and opportunities
- 7.4.5.2.2. Market size and forecast, by Type
- 7.4.5.2.3. Market size and forecast, by Material
- 7.4.5.2.4. Market size and forecast, by End Use Industry
- 7.4.5.3. Japan
- 7.4.5.3.1. Key market trends, growth factors and opportunities
- 7.4.5.3.2. Market size and forecast, by Type
- 7.4.5.3.3. Market size and forecast, by Material
- 7.4.5.3.4. Market size and forecast, by End Use Industry
- 7.4.5.4. South Korea
- 7.4.5.4.1. Key market trends, growth factors and opportunities
- 7.4.5.4.2. Market size and forecast, by Type
- 7.4.5.4.3. Market size and forecast, by Material
- 7.4.5.4.4. Market size and forecast, by End Use Industry
- 7.4.5.5. Australia
- 7.4.5.5.1. Key market trends, growth factors and opportunities
- 7.4.5.5.2. Market size and forecast, by Type
- 7.4.5.5.3. Market size and forecast, by Material
- 7.4.5.5.4. Market size and forecast, by End Use Industry
- 7.4.5.6. Rest of Asia-Pacific
- 7.4.5.6.1. Key market trends, growth factors and opportunities
- 7.4.5.6.2. Market size and forecast, by Type
- 7.4.5.6.3. Market size and forecast, by Material
- 7.4.5.6.4. Market size and forecast, by End Use Industry
- 7.5. LAMEA
- 7.5.1. Key trends and opportunities
- 7.5.2. Market size and forecast, by Type
- 7.5.3. Market size and forecast, by Material
- 7.5.4. Market size and forecast, by End Use Industry
- 7.5.5. Market size and forecast, by country
- 7.5.5.1. Brazil
- 7.5.5.1.1. Key market trends, growth factors and opportunities
- 7.5.5.1.2. Market size and forecast, by Type
- 7.5.5.1.3. Market size and forecast, by Material
- 7.5.5.1.4. Market size and forecast, by End Use Industry
- 7.5.5.2. Saudi Arabia
- 7.5.5.2.1. Key market trends, growth factors and opportunities
- 7.5.5.2.2. Market size and forecast, by Type
- 7.5.5.2.3. Market size and forecast, by Material
- 7.5.5.2.4. Market size and forecast, by End Use Industry
- 7.5.5.3. South Africa
- 7.5.5.3.1. Key market trends, growth factors and opportunities
- 7.5.5.3.2. Market size and forecast, by Type
- 7.5.5.3.3. Market size and forecast, by Material
- 7.5.5.3.4. Market size and forecast, by End Use Industry
- 7.5.5.4. Rest of LAMEA
- 7.5.5.4.1. Key market trends, growth factors and opportunities
- 7.5.5.4.2. Market size and forecast, by Type
- 7.5.5.4.3. Market size and forecast, by Material
- 7.5.5.4.4. Market size and forecast, by End Use Industry
CHAPTER 8: COMPETITIVE LANDSCAPE
- 8.1. Introduction
- 8.2. Top winning strategies
- 8.3. Product Mapping of Top 10 Player
- 8.4. Competitive Dashboard
- 8.5. Competitive Heatmap
- 8.6. Top player positioning, 2022
CHAPTER 9: COMPANY PROFILES
- 9.1. Carborundum Universal Limited
- 9.1.1. Company overview
- 9.1.2. Key Executives
- 9.1.3. Company snapshot
- 9.1.4. Operating business segments
- 9.1.5. Product portfolio
- 9.1.6. Business performance
- 9.2. Saint-Gobain
- 9.2.1. Company overview
- 9.2.2. Key Executives
- 9.2.3. Company snapshot
- 9.2.4. Operating business segments
- 9.2.5. Product portfolio
- 9.2.6. Business performance
- 9.3. Robert Bosch Power Tools GmbH
- 9.3.1. Company overview
- 9.3.2. Key Executives
- 9.3.3. Company snapshot
- 9.3.4. Operating business segments
- 9.3.5. Product portfolio
- 9.4. deerfos
- 9.4.1. Company overview
- 9.4.2. Key Executives
- 9.4.3. Company snapshot
- 9.4.4. Operating business segments
- 9.4.5. Product portfolio
- 9.5. SAK ABRASIVES LIMITED
- 9.5.1. Company overview
- 9.5.2. Key Executives
- 9.5.3. Company snapshot
- 9.5.4. Operating business segments
- 9.5.5. Product portfolio
- 9.6. Hindustan Abrasives
- 9.6.1. Company overview
- 9.6.2. Key Executives
- 9.6.3. Company snapshot
- 9.6.4. Operating business segments
- 9.6.5. Product portfolio
- 9.7. Sterling Abrasives Limited
- 9.7.1. Company overview
- 9.7.2. Key Executives
- 9.7.3. Company snapshot
- 9.7.4. Operating business segments
- 9.7.5. Product portfolio
- 9.8. Bullard Abrasives, Inc.
- 9.8.1. Company overview
- 9.8.2. Key Executives
- 9.8.3. Company snapshot
- 9.8.4. Operating business segments
- 9.8.5. Product portfolio
- 9.9. 3M Company
- 9.9.1. Company overview
- 9.9.2. Key Executives
- 9.9.3. Company snapshot
- 9.9.4. Operating business segments
- 9.9.5. Product portfolio
- 9.9.6. Business performance
- 9.10. Osborn Lippert India Private Limited.
- 9.10.1. Company overview
- 9.10.2. Key Executives
- 9.10.3. Company snapshot
- 9.10.4. Operating business segments
- 9.10.5. Product portfolio