 |
市場調査レポート
商品コード
1298345
腸疾患検査市場:製品タイプ別、手法別、疾患タイプ別、エンドユーザー別:世界の機会分析と産業予測、2023-2032年Enteric Disease Testing Market By Product Type, By Technique, By Disease Type, By End User : Global Opportunity Analysis and Industry Forecast, 2023-2032 |
||||||

| 腸疾患検査市場:製品タイプ別、手法別、疾患タイプ別、エンドユーザー別:世界の機会分析と産業予測、2023-2032年 |
|
出版日: 2023年04月01日
発行: Allied Market Research
ページ情報: 英文 474 Pages
納期: 2~3営業日
|
- 全表示
- 概要
- 図表
- 目次
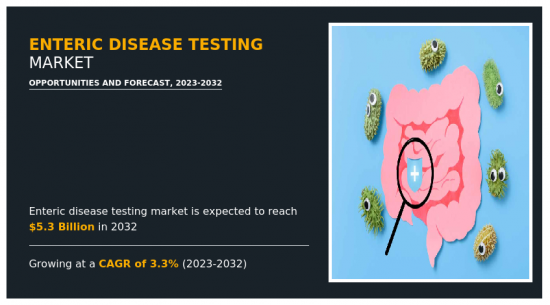
腸疾患検査市場は、2022年には38億7,060万米ドルと評価され、2023年から2032年までのCAGRは3.3%を示し、2032年には53億2,360万米ドルに達すると推定されます。
腸疾患は、細菌、ウイルス、寄生虫を含む様々な微生物によって引き起こされる感染症で、消化管(腸管または消化器系とも呼ばれる)を侵します。これらの病気は通常、汚染された食物や水、不衛生な環境、不適切な衛生習慣によって広がります。腸疾患は、分子診断技術や免疫診断技術を用いて検査されます。腸管疾患の検査は、治療や感染症の蔓延防止に重要です。腸疾患の検査には、さまざまな試薬、消耗品、機器が使用されます。
腸疾患検査市場の成長を促進する主な要因には、腸疾患検査試薬・機器における技術進歩の上昇、感染性腸疾患、消化性潰瘍の負担を軽減するために新興諸国政府が実施するイニシアチブの増加、大腸菌感染症、アメーバ症、ジアルジア症、ピロリ菌感染症、赤痢菌、サルモネラ菌感染症などの腸疾患の有病率の急増などがあります。例えば、米国疾病予防管理センター(CDC)2023によると、カンピロバクター感染症は毎年150万人の米国住民を罹患させています。
しかし、機器の高コストと分子診断アッセイに関連する高コストが腸疾患検査市場の成長を妨げると予想されます。それとは逆に、新興経済諸国における満たされていない医療需要と新興諸国における有利なビジネスチャンスは、腸疾患検査製品メーカーにとって今後計り知れない機会を生み出すと予想されます。
さらに、研究開発活動における腸疾患検査利用の増加、腸疾患検査キットの高い需要、腸疾患の高い発生率により、ヘルスケア事業は成長を示すと予測されます。さらに、効果的な腸疾患検査キットや機器の発見・開発の増加、腸疾患の診断に関する意識の高まりが、インドや中国などの新興諸国における腸疾患検査市場の成長を後押ししています。このことは、予測期間中、主要プレーヤーが市場に投資する有益な機会を提供すると予想されます。
腸疾患検査市場は、製品タイプ、技術、疾患タイプ、エンドユーザー、地域に区分されます。製品タイプ別では、市場は試薬・消耗品と機器に分類されます。手法別では、市場は分子診断薬と免疫診断薬に二分されます。疾患タイプ別では、細菌性腸疾患、ウイルス性腸疾患、寄生虫性腸疾患に分類されます。エンドユーザー別では、病院検査室、製薬・バイオテクノロジー企業、学術・研究機関に分けられます。
目次
第1章 イントロダクション
第2章 エグゼクティブサマリー
第3章 市場概要
- 市場の定義と範囲
- 主な調査結果
- 影響要因
- 主な投資機会
- ポーターのファイブフォース分析
- 供給企業の交渉力
- 買い手の交渉力
- 代替品の脅威
- 新規参入業者の脅威
- 競合の激しさ
- 市場力学
- 促進要因
- 腸疾患の有病率の上昇
- 新興諸国における未開拓市場
- 阻害要因
- 分子診断アッセイに伴う高コスト
- 機会
- 開発戦略の採用の増加主要企業別
- 促進要因
- COVID-19市場への影響分析
第4章 腸疾患検査市場:製品タイプ別
- 概要
- 市場規模と予測
- 試薬と消耗品
- 主な市場動向、成長要因、機会
- 市場規模・予測:地域別
- 市場シェア分析:国別
- 装置
- 主要市場動向、成長要因、機会
- 市場規模・予測:地域別
- 市場シェア分析:国別
第5章 腸疾患検査市場:技術別
- 概要
- 市場規模と予測
- 分子診断
- 主な市場動向、成長要因、機会
- 市場規模・予測:地域別
- 市場シェア分析:国別
- 免疫診断
- 主要市場動向、成長要因、機会
- 市場規模・予測:地域別
- 市場シェア分析:国別
第6章 腸疾患検査市場:疾患タイプ別
- 概要
- 市場規模および予測
- 細菌性腸疾患
- 主な市場動向、成長要因、機会
- 市場規模・予測:地域別
- 市場シェア分析:国別
- ウイルス性腸疾患
- 主な市場動向、成長要因、機会
- 市場規模・予測:地域別
- 市場シェア分析:国別
- 寄生性腸疾患
- 主な市場動向、成長要因、機会
- 市場規模・予測:地域別
- 市場シェア分析: 国別
第7章 腸疾患検査市場:エンドユーザー別
- 概要
- 市場規模および予測
- 病院ラボ
- 主な市場動向、成長要因、機会
- 市場規模・予測:地域別
- 市場シェア分析:国別
- 製薬・バイオテクノロジー企業
- 主な市場動向、成長要因、機会
- 市場規模・予測:地域別
- 市場シェア分析:国別
- 学術・研究機関
- 主要市場動向、成長要因、機会
- 市場規模・予測:地域別
- 市場シェア分析:国別
第8章 腸疾患検査市場:地域別
- 概要
- 市場規模・予測: 地域別
- 北米
- 主要動向と機会
- 市場規模・予測:製品タイプ別
- 市場規模・予測:技術別
- 市場規模・予測:疾患タイプ別
- 市場規模・予測:エンドユーザー別
- 市場規模・予測:国別
- 米国
- 主要市場動向、成長要因、機会
- 市場規模・予測:製品タイプ別
- 市場規模・予測:技術別
- 市場規模・予測:疾患タイプ別
- 市場規模・予測:エンドユーザー別
- カナダ
- 主要市場動向、成長要因、機会
- 市場規模・予測:製品タイプ別
- 市場規模・予測:技術別
- 市場規模・予測:疾患タイプ別
- 市場規模・予測:エンドユーザー別
- メキシコ
- 主要市場動向、成長要因、機会
- 市場規模・予測:製品タイプ別
- 市場規模・予測:技術別
- 市場規模・予測:疾患タイプ別
- 市場規模・予測:エンドユーザー別
- 欧州
- 主要動向と機会
- 市場規模・予測:製品タイプ別
- 市場規模・予測:技術別
- 市場規模・予測:疾患タイプ別
- 市場規模・予測:エンドユーザー別
- 市場規模・予測:国別
- ドイツ
- 主要市場動向、成長要因、機会
- 市場規模・予測:製品タイプ別
- 市場規模・予測:技術別
- 市場規模・予測:疾患タイプ別
- 市場規模・予測:エンドユーザー別
- フランス
- 主要市場動向、成長要因、機会
- 市場規模・予測:製品タイプ別
- 市場規模・予測:技術別
- 市場規模・予測:疾患タイプ別
- 市場規模・予測:エンドユーザー別
- 英国
- 主要市場動向、成長要因、機会
- 市場規模・予測:製品タイプ別
- 市場規模・予測:技術別
- 市場規模・予測:疾患タイプ別
- 市場規模・予測:エンドユーザー別
- イタリア
- 主要市場動向、成長要因、機会
- 市場規模・予測:製品タイプ別
- 市場規模・予測:技術別
- 市場規模・予測:疾患タイプ別
- 市場規模・予測:エンドユーザー別
- スペイン
- 主要市場動向、成長要因、機会
- 市場規模・予測:製品タイプ別
- 市場規模・予測:技術別
- 市場規模・予測:疾患タイプ別
- 市場規模・予測:エンドユーザー別
- その他欧州
- 主要市場動向、成長要因、機会
- 市場規模・予測:製品タイプ別
- 市場規模・予測:技術別
- 市場規模・予測:疾患タイプ別
- 市場規模・予測:エンドユーザー別
- アジア太平洋地域
- 主要動向と機会
- 市場規模・予測:製品タイプ別
- 市場規模・予測:技術別
- 市場規模・予測:疾患タイプ別
- 市場規模・予測:エンドユーザー別
- 市場規模・予測:国別
- 日本
- 主要市場動向、成長要因、機会
- 市場規模・予測:製品タイプ別
- 市場規模・予測:技術別
- 市場規模・予測:疾患タイプ別
- 市場規模・予測:エンドユーザー別
- 中国
- 主要市場動向、成長要因、機会
- 市場規模・予測:製品タイプ別
- 市場規模・予測:技術別
- 市場規模・予測:疾患タイプ別
- 市場規模・予測:エンドユーザー別
- オーストラリア
- 主要市場動向、成長要因、機会
- 市場規模・予測:製品タイプ別
- 市場規模・予測:技術別
- 市場規模・予測:疾患タイプ別
- 市場規模・予測:エンドユーザー別
- インド
- 主要市場動向、成長要因、機会
- 市場規模・予測:製品タイプ別
- 市場規模・予測:技術別
- 市場規模・予測:疾患タイプ別
- 市場規模・予測:エンドユーザー別
- 韓国
- 主要市場動向、成長要因、機会
- 市場規模・予測:製品タイプ別
- 市場規模・予測:技術別
- 市場規模・予測:疾患タイプ別
- 市場規模・予測:エンドユーザー別
- その他アジア太平洋地域
- 主要市場動向、成長要因、機会
- 市場規模・予測:製品タイプ別
- 市場規模・予測:技術別
- 市場規模・予測:疾患タイプ別
- 市場規模・予測:エンドユーザー別
- ラテンアメリカ・中東・アフリカ
- 主要動向と機会
- 市場規模・予測:製品タイプ別
- 市場規模・予測:技術別
- 市場規模・予測:疾患タイプ別
- 市場規模・予測:エンドユーザー別
- 市場規模・予測:国別
- ブラジル
- 主要市場動向、成長要因、機会
- 市場規模・予測:製品タイプ別
- 市場規模・予測:技術別
- 市場規模・予測:疾患タイプ別
- 市場規模・予測:エンドユーザー別
- サウジアラビア
- 主要市場動向、成長要因、機会
- 市場規模・予測:製品タイプ別
- 市場規模・予測:技術別
- 市場規模・予測:疾患タイプ別
- 市場規模・予測:エンドユーザー別
- 南アフリカ
- 主要市場動向、成長要因、機会
- 市場規模・予測:製品タイプ別
- 市場規模・予測:技術別
- 市場規模・予測:疾患タイプ別
- 市場規模・予測:エンドユーザー別
- その他の地域
- 主要市場動向、成長要因、機会
- 市場規模・予測:製品タイプ別
- 市場規模・予測:技術別
- 市場規模・予測:疾患タイプ別
- 市場規模・予測:エンドユーザー別
第9章 競合情勢
- イントロダクション
- 主要成功戦略
- 主要10社の製品マッピング
- 競合ダッシュボード
- 競合ヒートマップ
- トップ企業のポジショニング、2022年
第10章 企業プロファイル
- Becton Dickinson & Company
- Biomerica, Inc.
- Biomerieux SA
- Bio-Rad Laboratories, Inc.
- Diasorin S.p.A.
- Meridian Bioscience Inc.
- Quest Diagnostics Inc.
- Trinity Biotech
- Coris BioConcept
- Abbott Laboratories
LIST OF TABLES
- TABLE 01. GLOBAL ENTERIC DISEASE TESTING MARKET, BY PRODUCT TYPE, 2022-2032 ($MILLION)
- TABLE 02. ENTERIC DISEASE TESTING MARKET FOR REAGENTS AND CONSUMABLES, BY REGION, 2022-2032 ($MILLION)
- TABLE 03. ENTERIC DISEASE TESTING MARKET FOR EQUIPMENT, BY REGION, 2022-2032 ($MILLION)
- TABLE 04. GLOBAL ENTERIC DISEASE TESTING MARKET, BY TECHNIQUE, 2022-2032 ($MILLION)
- TABLE 05. ENTERIC DISEASE TESTING MARKET FOR MOLECULAR DIAGNOSTICS, BY REGION, 2022-2032 ($MILLION)
- TABLE 06. ENTERIC DISEASE TESTING MARKET FOR IMMUNODIAGNOSTICS, BY REGION, 2022-2032 ($MILLION)
- TABLE 07. GLOBAL ENTERIC DISEASE TESTING MARKET, BY DISEASE TYPE, 2022-2032 ($MILLION)
- TABLE 08. ENTERIC DISEASE TESTING MARKET FOR BACTERIAL ENTERIC DISEASE, BY REGION, 2022-2032 ($MILLION)
- TABLE 09. ENTERIC DISEASE TESTING MARKET FOR VIRAL ENTERIC DISEASE, BY REGION, 2022-2032 ($MILLION)
- TABLE 10. ENTERIC DISEASE TESTING MARKET FOR PARASITIC ENTERIC DISEASE, BY REGION, 2022-2032 ($MILLION)
- TABLE 11. GLOBAL ENTERIC DISEASE TESTING MARKET, BY END USER, 2022-2032 ($MILLION)
- TABLE 12. ENTERIC DISEASE TESTING MARKET FOR HOSPITAL LABORATORIES, BY REGION, 2022-2032 ($MILLION)
- TABLE 13. ENTERIC DISEASE TESTING MARKET FOR PHARMACEUTICAL AND BIOTECHNOLOGY COMPANIES, BY REGION, 2022-2032 ($MILLION)
- TABLE 14. ENTERIC DISEASE TESTING MARKET FOR ACADEMIC AND RESEARCH INSTITUTES, BY REGION, 2022-2032 ($MILLION)
- TABLE 15. ENTERIC DISEASE TESTING MARKET, BY REGION, 2022-2032 ($MILLION)
- TABLE 16. NORTH AMERICA ENTERIC DISEASE TESTING MARKET, BY PRODUCT TYPE, 2022-2032 ($MILLION)
- TABLE 17. NORTH AMERICA ENTERIC DISEASE TESTING MARKET, BY TECHNIQUE, 2022-2032 ($MILLION)
- TABLE 18. NORTH AMERICA ENTERIC DISEASE TESTING MARKET, BY DISEASE TYPE, 2022-2032 ($MILLION)
- TABLE 19. NORTH AMERICA ENTERIC DISEASE TESTING MARKET, BY END USER, 2022-2032 ($MILLION)
- TABLE 20. NORTH AMERICA ENTERIC DISEASE TESTING MARKET, BY COUNTRY, 2022-2032 ($MILLION)
- TABLE 21. U.S. ENTERIC DISEASE TESTING MARKET, BY PRODUCT TYPE, 2022-2032 ($MILLION)
- TABLE 22. U.S. ENTERIC DISEASE TESTING MARKET, BY TECHNIQUE, 2022-2032 ($MILLION)
- TABLE 23. U.S. ENTERIC DISEASE TESTING MARKET, BY DISEASE TYPE, 2022-2032 ($MILLION)
- TABLE 24. U.S. ENTERIC DISEASE TESTING MARKET, BY END USER, 2022-2032 ($MILLION)
- TABLE 25. CANADA ENTERIC DISEASE TESTING MARKET, BY PRODUCT TYPE, 2022-2032 ($MILLION)
- TABLE 26. CANADA ENTERIC DISEASE TESTING MARKET, BY TECHNIQUE, 2022-2032 ($MILLION)
- TABLE 27. CANADA ENTERIC DISEASE TESTING MARKET, BY DISEASE TYPE, 2022-2032 ($MILLION)
- TABLE 28. CANADA ENTERIC DISEASE TESTING MARKET, BY END USER, 2022-2032 ($MILLION)
- TABLE 29. MEXICO ENTERIC DISEASE TESTING MARKET, BY PRODUCT TYPE, 2022-2032 ($MILLION)
- TABLE 30. MEXICO ENTERIC DISEASE TESTING MARKET, BY TECHNIQUE, 2022-2032 ($MILLION)
- TABLE 31. MEXICO ENTERIC DISEASE TESTING MARKET, BY DISEASE TYPE, 2022-2032 ($MILLION)
- TABLE 32. MEXICO ENTERIC DISEASE TESTING MARKET, BY END USER, 2022-2032 ($MILLION)
- TABLE 33. EUROPE ENTERIC DISEASE TESTING MARKET, BY PRODUCT TYPE, 2022-2032 ($MILLION)
- TABLE 34. EUROPE ENTERIC DISEASE TESTING MARKET, BY TECHNIQUE, 2022-2032 ($MILLION)
- TABLE 35. EUROPE ENTERIC DISEASE TESTING MARKET, BY DISEASE TYPE, 2022-2032 ($MILLION)
- TABLE 36. EUROPE ENTERIC DISEASE TESTING MARKET, BY END USER, 2022-2032 ($MILLION)
- TABLE 37. EUROPE ENTERIC DISEASE TESTING MARKET, BY COUNTRY, 2022-2032 ($MILLION)
- TABLE 38. GERMANY ENTERIC DISEASE TESTING MARKET, BY PRODUCT TYPE, 2022-2032 ($MILLION)
- TABLE 39. GERMANY ENTERIC DISEASE TESTING MARKET, BY TECHNIQUE, 2022-2032 ($MILLION)
- TABLE 40. GERMANY ENTERIC DISEASE TESTING MARKET, BY DISEASE TYPE, 2022-2032 ($MILLION)
- TABLE 41. GERMANY ENTERIC DISEASE TESTING MARKET, BY END USER, 2022-2032 ($MILLION)
- TABLE 42. FRANCE ENTERIC DISEASE TESTING MARKET, BY PRODUCT TYPE, 2022-2032 ($MILLION)
- TABLE 43. FRANCE ENTERIC DISEASE TESTING MARKET, BY TECHNIQUE, 2022-2032 ($MILLION)
- TABLE 44. FRANCE ENTERIC DISEASE TESTING MARKET, BY DISEASE TYPE, 2022-2032 ($MILLION)
- TABLE 45. FRANCE ENTERIC DISEASE TESTING MARKET, BY END USER, 2022-2032 ($MILLION)
- TABLE 46. UK ENTERIC DISEASE TESTING MARKET, BY PRODUCT TYPE, 2022-2032 ($MILLION)
- TABLE 47. UK ENTERIC DISEASE TESTING MARKET, BY TECHNIQUE, 2022-2032 ($MILLION)
- TABLE 48. UK ENTERIC DISEASE TESTING MARKET, BY DISEASE TYPE, 2022-2032 ($MILLION)
- TABLE 49. UK ENTERIC DISEASE TESTING MARKET, BY END USER, 2022-2032 ($MILLION)
- TABLE 50. ITALY ENTERIC DISEASE TESTING MARKET, BY PRODUCT TYPE, 2022-2032 ($MILLION)
- TABLE 51. ITALY ENTERIC DISEASE TESTING MARKET, BY TECHNIQUE, 2022-2032 ($MILLION)
- TABLE 52. ITALY ENTERIC DISEASE TESTING MARKET, BY DISEASE TYPE, 2022-2032 ($MILLION)
- TABLE 53. ITALY ENTERIC DISEASE TESTING MARKET, BY END USER, 2022-2032 ($MILLION)
- TABLE 54. SPAIN ENTERIC DISEASE TESTING MARKET, BY PRODUCT TYPE, 2022-2032 ($MILLION)
- TABLE 55. SPAIN ENTERIC DISEASE TESTING MARKET, BY TECHNIQUE, 2022-2032 ($MILLION)
- TABLE 56. SPAIN ENTERIC DISEASE TESTING MARKET, BY DISEASE TYPE, 2022-2032 ($MILLION)
- TABLE 57. SPAIN ENTERIC DISEASE TESTING MARKET, BY END USER, 2022-2032 ($MILLION)
- TABLE 58. REST OF EUROPE ENTERIC DISEASE TESTING MARKET, BY PRODUCT TYPE, 2022-2032 ($MILLION)
- TABLE 59. REST OF EUROPE ENTERIC DISEASE TESTING MARKET, BY TECHNIQUE, 2022-2032 ($MILLION)
- TABLE 60. REST OF EUROPE ENTERIC DISEASE TESTING MARKET, BY DISEASE TYPE, 2022-2032 ($MILLION)
- TABLE 61. REST OF EUROPE ENTERIC DISEASE TESTING MARKET, BY END USER, 2022-2032 ($MILLION)
- TABLE 62. ASIA-PACIFIC ENTERIC DISEASE TESTING MARKET, BY PRODUCT TYPE, 2022-2032 ($MILLION)
- TABLE 63. ASIA-PACIFIC ENTERIC DISEASE TESTING MARKET, BY TECHNIQUE, 2022-2032 ($MILLION)
- TABLE 64. ASIA-PACIFIC ENTERIC DISEASE TESTING MARKET, BY DISEASE TYPE, 2022-2032 ($MILLION)
- TABLE 65. ASIA-PACIFIC ENTERIC DISEASE TESTING MARKET, BY END USER, 2022-2032 ($MILLION)
- TABLE 66. ASIA-PACIFIC ENTERIC DISEASE TESTING MARKET, BY COUNTRY, 2022-2032 ($MILLION)
- TABLE 67. JAPAN ENTERIC DISEASE TESTING MARKET, BY PRODUCT TYPE, 2022-2032 ($MILLION)
- TABLE 68. JAPAN ENTERIC DISEASE TESTING MARKET, BY TECHNIQUE, 2022-2032 ($MILLION)
- TABLE 69. JAPAN ENTERIC DISEASE TESTING MARKET, BY DISEASE TYPE, 2022-2032 ($MILLION)
- TABLE 70. JAPAN ENTERIC DISEASE TESTING MARKET, BY END USER, 2022-2032 ($MILLION)
- TABLE 71. CHINA ENTERIC DISEASE TESTING MARKET, BY PRODUCT TYPE, 2022-2032 ($MILLION)
- TABLE 72. CHINA ENTERIC DISEASE TESTING MARKET, BY TECHNIQUE, 2022-2032 ($MILLION)
- TABLE 73. CHINA ENTERIC DISEASE TESTING MARKET, BY DISEASE TYPE, 2022-2032 ($MILLION)
- TABLE 74. CHINA ENTERIC DISEASE TESTING MARKET, BY END USER, 2022-2032 ($MILLION)
- TABLE 75. AUSTRALIA ENTERIC DISEASE TESTING MARKET, BY PRODUCT TYPE, 2022-2032 ($MILLION)
- TABLE 76. AUSTRALIA ENTERIC DISEASE TESTING MARKET, BY TECHNIQUE, 2022-2032 ($MILLION)
- TABLE 77. AUSTRALIA ENTERIC DISEASE TESTING MARKET, BY DISEASE TYPE, 2022-2032 ($MILLION)
- TABLE 78. AUSTRALIA ENTERIC DISEASE TESTING MARKET, BY END USER, 2022-2032 ($MILLION)
- TABLE 79. INDIA ENTERIC DISEASE TESTING MARKET, BY PRODUCT TYPE, 2022-2032 ($MILLION)
- TABLE 80. INDIA ENTERIC DISEASE TESTING MARKET, BY TECHNIQUE, 2022-2032 ($MILLION)
- TABLE 81. INDIA ENTERIC DISEASE TESTING MARKET, BY DISEASE TYPE, 2022-2032 ($MILLION)
- TABLE 82. INDIA ENTERIC DISEASE TESTING MARKET, BY END USER, 2022-2032 ($MILLION)
- TABLE 83. SOUTH KOREA ENTERIC DISEASE TESTING MARKET, BY PRODUCT TYPE, 2022-2032 ($MILLION)
- TABLE 84. SOUTH KOREA ENTERIC DISEASE TESTING MARKET, BY TECHNIQUE, 2022-2032 ($MILLION)
- TABLE 85. SOUTH KOREA ENTERIC DISEASE TESTING MARKET, BY DISEASE TYPE, 2022-2032 ($MILLION)
- TABLE 86. SOUTH KOREA ENTERIC DISEASE TESTING MARKET, BY END USER, 2022-2032 ($MILLION)
- TABLE 87. REST OF ASIA-PACIFIC ENTERIC DISEASE TESTING MARKET, BY PRODUCT TYPE, 2022-2032 ($MILLION)
- TABLE 88. REST OF ASIA-PACIFIC ENTERIC DISEASE TESTING MARKET, BY TECHNIQUE, 2022-2032 ($MILLION)
- TABLE 89. REST OF ASIA-PACIFIC ENTERIC DISEASE TESTING MARKET, BY DISEASE TYPE, 2022-2032 ($MILLION)
- TABLE 90. REST OF ASIA-PACIFIC ENTERIC DISEASE TESTING MARKET, BY END USER, 2022-2032 ($MILLION)
- TABLE 91. LAMEA ENTERIC DISEASE TESTING MARKET, BY PRODUCT TYPE, 2022-2032 ($MILLION)
- TABLE 92. LAMEA ENTERIC DISEASE TESTING MARKET, BY TECHNIQUE, 2022-2032 ($MILLION)
- TABLE 93. LAMEA ENTERIC DISEASE TESTING MARKET, BY DISEASE TYPE, 2022-2032 ($MILLION)
- TABLE 94. LAMEA ENTERIC DISEASE TESTING MARKET, BY END USER, 2022-2032 ($MILLION)
- TABLE 95. LAMEA ENTERIC DISEASE TESTING MARKET, BY COUNTRY, 2022-2032 ($MILLION)
- TABLE 96. BRAZIL ENTERIC DISEASE TESTING MARKET, BY PRODUCT TYPE, 2022-2032 ($MILLION)
- TABLE 97. BRAZIL ENTERIC DISEASE TESTING MARKET, BY TECHNIQUE, 2022-2032 ($MILLION)
- TABLE 98. BRAZIL ENTERIC DISEASE TESTING MARKET, BY DISEASE TYPE, 2022-2032 ($MILLION)
- TABLE 99. BRAZIL ENTERIC DISEASE TESTING MARKET, BY END USER, 2022-2032 ($MILLION)
- TABLE 100. SAUDI ARABIA ENTERIC DISEASE TESTING MARKET, BY PRODUCT TYPE, 2022-2032 ($MILLION)
- TABLE 101. SAUDI ARABIA ENTERIC DISEASE TESTING MARKET, BY TECHNIQUE, 2022-2032 ($MILLION)
- TABLE 102. SAUDI ARABIA ENTERIC DISEASE TESTING MARKET, BY DISEASE TYPE, 2022-2032 ($MILLION)
- TABLE 103. SAUDI ARABIA ENTERIC DISEASE TESTING MARKET, BY END USER, 2022-2032 ($MILLION)
- TABLE 104. SOUTH AFRICA ENTERIC DISEASE TESTING MARKET, BY PRODUCT TYPE, 2022-2032 ($MILLION)
- TABLE 105. SOUTH AFRICA ENTERIC DISEASE TESTING MARKET, BY TECHNIQUE, 2022-2032 ($MILLION)
- TABLE 106. SOUTH AFRICA ENTERIC DISEASE TESTING MARKET, BY DISEASE TYPE, 2022-2032 ($MILLION)
- TABLE 107. SOUTH AFRICA ENTERIC DISEASE TESTING MARKET, BY END USER, 2022-2032 ($MILLION)
- TABLE 108. REST OF LAMEA ENTERIC DISEASE TESTING MARKET, BY PRODUCT TYPE, 2022-2032 ($MILLION)
- TABLE 109. REST OF LAMEA ENTERIC DISEASE TESTING MARKET, BY TECHNIQUE, 2022-2032 ($MILLION)
- TABLE 110. REST OF LAMEA ENTERIC DISEASE TESTING MARKET, BY DISEASE TYPE, 2022-2032 ($MILLION)
- TABLE 111. REST OF LAMEA ENTERIC DISEASE TESTING MARKET, BY END USER, 2022-2032 ($MILLION)
- TABLE 112. BECTON DICKINSON & COMPANY: KEY EXECUTIVES
- TABLE 113. BECTON DICKINSON & COMPANY: COMPANY SNAPSHOT
- TABLE 114. BECTON DICKINSON & COMPANY: PRODUCT SEGMENTS
- TABLE 115. BECTON DICKINSON & COMPANY: PRODUCT PORTFOLIO
- TABLE 116. BIOMERICA, INC.: KEY EXECUTIVES
- TABLE 117. BIOMERICA, INC.: COMPANY SNAPSHOT
- TABLE 118. BIOMERICA, INC.: PRODUCT SEGMENTS
- TABLE 119. BIOMERICA, INC.: PRODUCT PORTFOLIO
- TABLE 120. BIOMERIEUX SA: KEY EXECUTIVES
- TABLE 121. BIOMERIEUX SA: COMPANY SNAPSHOT
- TABLE 122. BIOMERIEUX SA: PRODUCT SEGMENTS
- TABLE 123. BIOMERIEUX SA: PRODUCT PORTFOLIO
- TABLE 124. BIOMERIEUX SA: KEY STRATERGIES
- TABLE 125. BIO-RAD LABORATORIES, INC. : KEY EXECUTIVES
- TABLE 126. BIO-RAD LABORATORIES, INC. : COMPANY SNAPSHOT
- TABLE 127. BIO-RAD LABORATORIES, INC. : PRODUCT SEGMENTS
- TABLE 128. BIO-RAD LABORATORIES, INC. : PRODUCT PORTFOLIO
- TABLE 129. DIASORIN S.P.A.: KEY EXECUTIVES
- TABLE 130. DIASORIN S.P.A.: COMPANY SNAPSHOT
- TABLE 131. DIASORIN S.P.A.: PRODUCT SEGMENTS
- TABLE 132. DIASORIN S.P.A.: PRODUCT PORTFOLIO
- TABLE 133. DIASORIN S.P.A.: KEY STRATERGIES
- TABLE 134. MERIDIAN BIOSCIENCE INC.: KEY EXECUTIVES
- TABLE 135. MERIDIAN BIOSCIENCE INC.: COMPANY SNAPSHOT
- TABLE 136. MERIDIAN BIOSCIENCE INC.: PRODUCT SEGMENTS
- TABLE 137. MERIDIAN BIOSCIENCE INC.: PRODUCT PORTFOLIO
- TABLE 138. MERIDIAN BIOSCIENCE INC.: KEY STRATERGIES
- TABLE 139. QUEST DIAGNOSTICS INC.: KEY EXECUTIVES
- TABLE 140. QUEST DIAGNOSTICS INC.: COMPANY SNAPSHOT
- TABLE 141. QUEST DIAGNOSTICS INC.: SERVICE SEGMENTS
- TABLE 142. QUEST DIAGNOSTICS INC.: PRODUCT PORTFOLIO
- TABLE 143. QUEST DIAGNOSTICS INC.: KEY STRATERGIES
- TABLE 144. TRINITY BIOTECH: KEY EXECUTIVES
- TABLE 145. TRINITY BIOTECH: COMPANY SNAPSHOT
- TABLE 146. TRINITY BIOTECH: PRODUCT SEGMENTS
- TABLE 147. TRINITY BIOTECH: PRODUCT PORTFOLIO
- TABLE 148. TRINITY BIOTECH: KEY STRATERGIES
- TABLE 149. CORIS BIOCONCEPT: KEY EXECUTIVES
- TABLE 150. CORIS BIOCONCEPT: COMPANY SNAPSHOT
- TABLE 151. CORIS BIOCONCEPT: PRODUCT SEGMENTS
- TABLE 152. CORIS BIOCONCEPT: PRODUCT PORTFOLIO
- TABLE 153. ABBOTT LABORATORIES: KEY EXECUTIVES
- TABLE 154. ABBOTT LABORATORIES: COMPANY SNAPSHOT
- TABLE 155. ABBOTT LABORATORIES: PRODUCT SEGMENTS
- TABLE 156. ABBOTT LABORATORIES: PRODUCT PORTFOLIO
LIST OF FIGURES
- FIGURE 01. ENTERIC DISEASE TESTING MARKET, 2022-2032
- FIGURE 02. SEGMENTATION OF ENTERIC DISEASE TESTING MARKET, 2022-2032
- FIGURE 03. TOP INVESTMENT POCKETS IN ENTERIC DISEASE TESTING MARKET (2023-2032)
- FIGURE 04. LOW BARGAINING POWER OF SUPPLIERS
- FIGURE 05. LOW BARGAINING POWER OF BUYERS
- FIGURE 06. LOW THREAT OF SUBSTITUTES
- FIGURE 07. LOW THREAT OF NEW ENTRANTS
- FIGURE 08. LOW INTENSITY OF RIVALRY
- FIGURE 09. DRIVERS, RESTRAINTS AND OPPORTUNITIES: GLOBALENTERIC DISEASE TESTING MARKET
- FIGURE 10. ENTERIC DISEASE TESTING MARKET, BY PRODUCT TYPE, 2022(%)
- FIGURE 11. COMPARATIVE SHARE ANALYSIS OF ENTERIC DISEASE TESTING MARKET FOR REAGENTS AND CONSUMABLES, BY COUNTRY 2022 AND 2032(%)
- FIGURE 12. COMPARATIVE SHARE ANALYSIS OF ENTERIC DISEASE TESTING MARKET FOR EQUIPMENT, BY COUNTRY 2022 AND 2032(%)
- FIGURE 13. ENTERIC DISEASE TESTING MARKET, BY TECHNIQUE, 2022(%)
- FIGURE 14. COMPARATIVE SHARE ANALYSIS OF ENTERIC DISEASE TESTING MARKET FOR MOLECULAR DIAGNOSTICS, BY COUNTRY 2022 AND 2032(%)
- FIGURE 15. COMPARATIVE SHARE ANALYSIS OF ENTERIC DISEASE TESTING MARKET FOR IMMUNODIAGNOSTICS, BY COUNTRY 2022 AND 2032(%)
- FIGURE 16. ENTERIC DISEASE TESTING MARKET, BY DISEASE TYPE, 2022(%)
- FIGURE 17. COMPARATIVE SHARE ANALYSIS OF ENTERIC DISEASE TESTING MARKET FOR BACTERIAL ENTERIC DISEASE, BY COUNTRY 2022 AND 2032(%)
- FIGURE 18. COMPARATIVE SHARE ANALYSIS OF ENTERIC DISEASE TESTING MARKET FOR VIRAL ENTERIC DISEASE, BY COUNTRY 2022 AND 2032(%)
- FIGURE 19. COMPARATIVE SHARE ANALYSIS OF ENTERIC DISEASE TESTING MARKET FOR PARASITIC ENTERIC DISEASE, BY COUNTRY 2022 AND 2032(%)
- FIGURE 20. ENTERIC DISEASE TESTING MARKET, BY END USER, 2022(%)
- FIGURE 21. COMPARATIVE SHARE ANALYSIS OF ENTERIC DISEASE TESTING MARKET FOR HOSPITAL LABORATORIES, BY COUNTRY 2022 AND 2032(%)
- FIGURE 22. COMPARATIVE SHARE ANALYSIS OF ENTERIC DISEASE TESTING MARKET FOR PHARMACEUTICAL AND BIOTECHNOLOGY COMPANIES, BY COUNTRY 2022 AND 2032(%)
- FIGURE 23. COMPARATIVE SHARE ANALYSIS OF ENTERIC DISEASE TESTING MARKET FOR ACADEMIC AND RESEARCH INSTITUTES, BY COUNTRY 2022 AND 2032(%)
- FIGURE 24. ENTERIC DISEASE TESTING MARKET BY REGION, 2022
- FIGURE 25. U.S. ENTERIC DISEASE TESTING MARKET, 2022-2032 ($MILLION)
- FIGURE 26. CANADA ENTERIC DISEASE TESTING MARKET, 2022-2032 ($MILLION)
- FIGURE 27. MEXICO ENTERIC DISEASE TESTING MARKET, 2022-2032 ($MILLION)
- FIGURE 28. GERMANY ENTERIC DISEASE TESTING MARKET, 2022-2032 ($MILLION)
- FIGURE 29. FRANCE ENTERIC DISEASE TESTING MARKET, 2022-2032 ($MILLION)
- FIGURE 30. UK ENTERIC DISEASE TESTING MARKET, 2022-2032 ($MILLION)
- FIGURE 31. ITALY ENTERIC DISEASE TESTING MARKET, 2022-2032 ($MILLION)
- FIGURE 32. SPAIN ENTERIC DISEASE TESTING MARKET, 2022-2032 ($MILLION)
- FIGURE 33. REST OF EUROPE ENTERIC DISEASE TESTING MARKET, 2022-2032 ($MILLION)
- FIGURE 34. JAPAN ENTERIC DISEASE TESTING MARKET, 2022-2032 ($MILLION)
- FIGURE 35. CHINA ENTERIC DISEASE TESTING MARKET, 2022-2032 ($MILLION)
- FIGURE 36. AUSTRALIA ENTERIC DISEASE TESTING MARKET, 2022-2032 ($MILLION)
- FIGURE 37. INDIA ENTERIC DISEASE TESTING MARKET, 2022-2032 ($MILLION)
- FIGURE 38. SOUTH KOREA ENTERIC DISEASE TESTING MARKET, 2022-2032 ($MILLION)
- FIGURE 39. REST OF ASIA-PACIFIC ENTERIC DISEASE TESTING MARKET, 2022-2032 ($MILLION)
- FIGURE 40. BRAZIL ENTERIC DISEASE TESTING MARKET, 2022-2032 ($MILLION)
- FIGURE 41. SAUDI ARABIA ENTERIC DISEASE TESTING MARKET, 2022-2032 ($MILLION)
- FIGURE 42. SOUTH AFRICA ENTERIC DISEASE TESTING MARKET, 2022-2032 ($MILLION)
- FIGURE 43. REST OF LAMEA ENTERIC DISEASE TESTING MARKET, 2022-2032 ($MILLION)
- FIGURE 44. TOP WINNING STRATEGIES, BY YEAR
- FIGURE 45. TOP WINNING STRATEGIES, BY DEVELOPMENT
- FIGURE 46. TOP WINNING STRATEGIES, BY COMPANY
- FIGURE 47. PRODUCT MAPPING OF TOP 10 PLAYERS
- FIGURE 48. COMPETITIVE DASHBOARD
- FIGURE 49. COMPETITIVE HEATMAP: ENTERIC DISEASE TESTING MARKET
- FIGURE 50. TOP PLAYER POSITIONING, 2022
- FIGURE 51. BECTON DICKINSON & COMPANY: NET REVENUE, 2020-2022 ($MILLION)
- FIGURE 52. BECTON DICKINSON & COMPANY: RESEARCH & DEVELOPMENT EXPENDITURE, 2020-2022 ($MILLION)
- FIGURE 53. BECTON DICKINSON & COMPANY: REVENUE SHARE BY SEGMENT, 2022 (%)
- FIGURE 54. BECTON DICKINSON & COMPANY: REVENUE SHARE BY REGION, 2022 (%)
- FIGURE 55. BIOMERICA, INC.: NET REVENUE, 2019-2021 ($MILLION)
- FIGURE 56. BIOMERICA, INC.: RESEARCH & DEVELOPMENT EXPENDITURE, 2019-2021 ($MILLION)
- FIGURE 57. BIOMERICA, INC.: REVENUE SHARE BY REGION, 2021 (%)
- FIGURE 58. BIOMERIEUX SA: NET SALES, 2019-2021 ($MILLION)
- FIGURE 59. BIOMERIEUX SA: REVENUE SHARE BY SEGMENT, 2021 (%)
- FIGURE 60. BIOMERIEUX SA: REVENUE SHARE BY REGION, 2021 (%)
- FIGURE 61. BIO-RAD LABORATORIES, INC. : NET SALES, 2020-2022 ($MILLION)
- FIGURE 62. BIO-RAD LABORATORIES, INC. : REVENUE SHARE BY SEGMENT, 2022 (%)
- FIGURE 63. BIO-RAD LABORATORIES, INC. : REVENUE SHARE BY REGION, 2022 (%)
- FIGURE 64. DIASORIN S.P.A.: NET REVENUE, 2019-2021 ($MILLION)
- FIGURE 65. DIASORIN S.P.A.: REVENUE SHARE BY REGION, 2021 (%)
- FIGURE 66. MERIDIAN BIOSCIENCE INC.: NET REVENUE, 2019-2021 ($MILLION)
- FIGURE 67. MERIDIAN BIOSCIENCE INC.: RESEARCH & DEVELOPMENT EXPENDITURE, 2019-2021 ($MILLION)
- FIGURE 68. MERIDIAN BIOSCIENCE INC.: REVENUE SHARE BY SEGMENT, 2021 (%)
- FIGURE 69. MERIDIAN BIOSCIENCE INC.: REVENUE SHARE BY REGION, 2021 (%)
- FIGURE 70. QUEST DIAGNOSTICS INC.: NET REVENUE, 2019-2021 ($MILLION)
- FIGURE 71. QUEST DIAGNOSTICS INC.: REVENUE SHARE BY SEGMENT, 2021 (%)
- FIGURE 72. TRINITY BIOTECH: NET REVENUE, 2019-2021 ($MILLION)
- FIGURE 73. TRINITY BIOTECH: REVENUE SHARE BY SEGMENT, 2021 (%)
- FIGURE 74. TRINITY BIOTECH: REVENUE SHARE BY REGION, 2021 (%)
- FIGURE 75. ABBOTT LABORATORIES: NET SALES, 2020-2022 ($MILLION)
- FIGURE 76. ABBOTT LABORATORIES: REVENUE SHARE BY SEGMENT, 2022 (%)
- FIGURE 77. ABBOTT LABORATORIES: REVENUE SHARE BY REGION, 2022 (%)
The enteric disease testing market was valued at $3,870.60 million in 2022 and is estimated to reach $5,323.60 million by 2032, exhibiting a CAGR of 3.3% from 2023 to 2032. Enteric diseases are infections caused by various microorganisms, including bacteria, viruses, and parasites, that affect the gastrointestinal tract (also known as the enteric or digestive system). These diseases are typically spread through contaminated food or water, poor sanitation, or inadequate hygiene practices. Enteric diseases are tested using molecular diagnostics techniques and immunodiagnostic techniques. Testing for enteric diseases is important for treatment, and prevention of the spread of infectious diseases. Various reagents, consumables, and equipment are used in the testing of enteric diseases.
Major factors driving the growth of the enteric disease testing market include rise in technological advancement in testing reagents and equipment of enteric disease, increase in initiative taken by governments in developing countries to reduce the burden of infectious enteric diseases, peptic ulcer and surge in prevalence of enteric diseases such as E. coli infection, amoebiasis, giardiasis, H. pylori infection, shigella and salmonella infection. For instance, according to Centers for Disease Control and Prevention (CDC) 2023, campylobacter infection affects 1.5 million U.S. residents every year.
However, the high cost of equipment and high cost associated with molecular diagnostic assay are expected to hamper the enteric disease testing market growth. On the contrary, unmet medical demands in developing countries and lucrative opportunities in emerging economies are expected to create immense opportunities for enteric disease testing product manufacturers in the future.
Furthermore, the healthcare business is projected to witness growth, owing to a rise in the use of enteric disease testing for research and development activities, high demand for enteric disease testing kits, and high incidence rate of enteric diseases. In addition, rise in discovery & development of effective enteric disease testing kits & equipment and increase in awareness regarding diagnosis of enteric disease drive the growth of the enteric disease testing market in developing countries such as India and China. This is anticipated to offer remunerative opportunities for key players to invest in the market during the forecast period.
The enteric disease testing market is segmented into product type, technique, disease type, end user, and region. On the basis of product type, the market is classified into reagents and consumables, and equipment. On the basis of technique, the market is bifurcated into molecular diagnostics, and immunodiagnostics. On the basis of disease type, the market is divided into bacterial enteric disease, viral enteric disease, and parasitic enteric disease. On the basis of end user, it is segregated into hospital laboratories, pharmaceutical and biotechnology companies, academic and research institutes.
Region wise, the market is analyzed across North America (the U.S., Canada, and Mexico), Europe (Germany, France, the UK, Italy, Spain, and rest of Europe), Asia-Pacific (China, Japan, Australia, India, South Korea, and rest of Asia-Pacific), and LAMEA (Brazil, South Africa, Saudi Arabia, and rest of LAMEA).
Major players profiled in the report include: Abbott Laboratories, Becton Dickinson & Company, Biomerica, Inc., Biomerieux SA, Bio-Rad Laboratories, Inc., Coris Bioconcept, Diasorin S.p.A., Meridian Bioscience, Inc, Quest Diagnostics, and Trinity Biotech.
Key Benefits For Stakeholders
- This report provides a quantitative analysis of the market segments, current trends, estimations, and dynamics of the enteric disease testing market analysis from 2022 to 2032 to identify the prevailing enteric disease testing market opportunities.
- The market research is offered along with information related to key drivers, restraints, and opportunities.
- Porter's five forces analysis highlights the potency of buyers and suppliers to enable stakeholders make profit-oriented business decisions and strengthen their supplier-buyer network.
- In-depth analysis of the enteric disease testing market segmentation assists to determine the prevailing market opportunities.
- Major countries in each region are mapped according to their revenue contribution to the global market.
- Market player positioning facilitates benchmarking and provides a clear understanding of the present position of the market players.
- The report includes the analysis of the regional as well as global enteric disease testing market trends, key players, market segments, application areas, and market growth strategies.
Key Market Segments
By Product Type
- Reagents and Consumables
- Equipment
By Technique
- Molecular Diagnostics
- Immunodiagnostics
By Disease Type
- Bacterial Enteric Disease
- Viral Enteric Disease
- Parasitic Enteric Disease
By End User
- Academic and Research Institutes
- Hospital Laboratories
- Pharmaceutical and Biotechnology Companies
By Region
- North America
- U.S.
- Canada
- Mexico
- Europe
- Germany
- France
- UK
- Italy
- Spain
- Rest of Europe
- Asia-Pacific
- Japan
- China
- Australia
- India
- South Korea
- Rest of Asia-Pacific
- LAMEA
- Brazil
- Saudi Arabia
- South Africa
- Rest of LAMEA
Key Market Players:
- Biomerica, Inc.
- Diasorin S.p.A.
- Meridian Bioscience Inc.
- Coris BioConcept
- Abbott Laboratories
- Biomerieux SA
- Bio-Rad Laboratories, Inc.
- Quest Diagnostics Inc.
- Becton Dickinson & Company
- Trinity Biotech
TABLE OF CONTENTS
CHAPTER 1: INTRODUCTION
- 1.1. Report description
- 1.2. Key market segments
- 1.3. Key benefits to the stakeholders
- 1.4. Research Methodology
- 1.4.1. Primary research
- 1.4.2. Secondary research
- 1.4.3. Analyst tools and models
CHAPTER 2: EXECUTIVE SUMMARY
- 2.1. CXO Perspective
CHAPTER 3: MARKET OVERVIEW
- 3.1. Market definition and scope
- 3.2. Key findings
- 3.2.1. Top impacting factors
- 3.2.2. Top investment pockets
- 3.3. Porter's five forces analysis
- 3.3.1. Bargaining power of suppliers
- 3.3.2. Bargaining power of buyers
- 3.3.3. Threat of substitutes
- 3.3.4. Threat of new entrants
- 3.3.5. Intensity of rivalry
- 3.4. Market dynamics
- 3.4.1. Drivers
- 3.4.1.1. Rise in prevalence of enteric diseases
- 3.4.1.2. Untapped market in developing countries
- 3.4.1. Drivers
- 3.4.2. Restraints
- 3.4.2.1. High cost associated with molecular diagnostic assay
- 3.4.3. Opportunities
- 3.4.3.1. Rise in adoption of developmental strategies by key players
- 3.5. COVID-19 Impact Analysis on the market
CHAPTER 4: ENTERIC DISEASE TESTING MARKET, BY PRODUCT TYPE
- 4.1. Overview
- 4.1.1. Market size and forecast
- 4.2. Reagents and Consumables
- 4.2.1. Key market trends, growth factors and opportunities
- 4.2.2. Market size and forecast, by region
- 4.2.3. Market share analysis by country
- 4.3. Equipment
- 4.3.1. Key market trends, growth factors and opportunities
- 4.3.2. Market size and forecast, by region
- 4.3.3. Market share analysis by country
CHAPTER 5: ENTERIC DISEASE TESTING MARKET, BY TECHNIQUE
- 5.1. Overview
- 5.1.1. Market size and forecast
- 5.2. Molecular Diagnostics
- 5.2.1. Key market trends, growth factors and opportunities
- 5.2.2. Market size and forecast, by region
- 5.2.3. Market share analysis by country
- 5.3. Immunodiagnostics
- 5.3.1. Key market trends, growth factors and opportunities
- 5.3.2. Market size and forecast, by region
- 5.3.3. Market share analysis by country
CHAPTER 6: ENTERIC DISEASE TESTING MARKET, BY DISEASE TYPE
- 6.1. Overview
- 6.1.1. Market size and forecast
- 6.2. Bacterial Enteric Disease
- 6.2.1. Key market trends, growth factors and opportunities
- 6.2.2. Market size and forecast, by region
- 6.2.3. Market share analysis by country
- 6.3. Viral Enteric Disease
- 6.3.1. Key market trends, growth factors and opportunities
- 6.3.2. Market size and forecast, by region
- 6.3.3. Market share analysis by country
- 6.4. Parasitic Enteric Disease
- 6.4.1. Key market trends, growth factors and opportunities
- 6.4.2. Market size and forecast, by region
- 6.4.3. Market share analysis by country
CHAPTER 7: ENTERIC DISEASE TESTING MARKET, BY END USER
- 7.1. Overview
- 7.1.1. Market size and forecast
- 7.2. Hospital Laboratories
- 7.2.1. Key market trends, growth factors and opportunities
- 7.2.2. Market size and forecast, by region
- 7.2.3. Market share analysis by country
- 7.3. Pharmaceutical and Biotechnology Companies
- 7.3.1. Key market trends, growth factors and opportunities
- 7.3.2. Market size and forecast, by region
- 7.3.3. Market share analysis by country
- 7.4. Academic and Research Institutes
- 7.4.1. Key market trends, growth factors and opportunities
- 7.4.2. Market size and forecast, by region
- 7.4.3. Market share analysis by country
CHAPTER 8: ENTERIC DISEASE TESTING MARKET, BY REGION
- 8.1. Overview
- 8.1.1. Market size and forecast By Region
- 8.2. North America
- 8.2.1. Key trends and opportunities
- 8.2.2. Market size and forecast, by Product Type
- 8.2.3. Market size and forecast, by Technique
- 8.2.4. Market size and forecast, by Disease Type
- 8.2.5. Market size and forecast, by End User
- 8.2.6. Market size and forecast, by country
- 8.2.6.1. U.S.
- 8.2.6.1.1. Key market trends, growth factors and opportunities
- 8.2.6.1.2. Market size and forecast, by Product Type
- 8.2.6.1.3. Market size and forecast, by Technique
- 8.2.6.1.4. Market size and forecast, by Disease Type
- 8.2.6.1.5. Market size and forecast, by End User
- 8.2.6.2. Canada
- 8.2.6.2.1. Key market trends, growth factors and opportunities
- 8.2.6.2.2. Market size and forecast, by Product Type
- 8.2.6.2.3. Market size and forecast, by Technique
- 8.2.6.2.4. Market size and forecast, by Disease Type
- 8.2.6.2.5. Market size and forecast, by End User
- 8.2.6.3. Mexico
- 8.2.6.3.1. Key market trends, growth factors and opportunities
- 8.2.6.3.2. Market size and forecast, by Product Type
- 8.2.6.3.3. Market size and forecast, by Technique
- 8.2.6.3.4. Market size and forecast, by Disease Type
- 8.2.6.3.5. Market size and forecast, by End User
- 8.3. Europe
- 8.3.1. Key trends and opportunities
- 8.3.2. Market size and forecast, by Product Type
- 8.3.3. Market size and forecast, by Technique
- 8.3.4. Market size and forecast, by Disease Type
- 8.3.5. Market size and forecast, by End User
- 8.3.6. Market size and forecast, by country
- 8.3.6.1. Germany
- 8.3.6.1.1. Key market trends, growth factors and opportunities
- 8.3.6.1.2. Market size and forecast, by Product Type
- 8.3.6.1.3. Market size and forecast, by Technique
- 8.3.6.1.4. Market size and forecast, by Disease Type
- 8.3.6.1.5. Market size and forecast, by End User
- 8.3.6.2. France
- 8.3.6.2.1. Key market trends, growth factors and opportunities
- 8.3.6.2.2. Market size and forecast, by Product Type
- 8.3.6.2.3. Market size and forecast, by Technique
- 8.3.6.2.4. Market size and forecast, by Disease Type
- 8.3.6.2.5. Market size and forecast, by End User
- 8.3.6.3. UK
- 8.3.6.3.1. Key market trends, growth factors and opportunities
- 8.3.6.3.2. Market size and forecast, by Product Type
- 8.3.6.3.3. Market size and forecast, by Technique
- 8.3.6.3.4. Market size and forecast, by Disease Type
- 8.3.6.3.5. Market size and forecast, by End User
- 8.3.6.4. Italy
- 8.3.6.4.1. Key market trends, growth factors and opportunities
- 8.3.6.4.2. Market size and forecast, by Product Type
- 8.3.6.4.3. Market size and forecast, by Technique
- 8.3.6.4.4. Market size and forecast, by Disease Type
- 8.3.6.4.5. Market size and forecast, by End User
- 8.3.6.5. Spain
- 8.3.6.5.1. Key market trends, growth factors and opportunities
- 8.3.6.5.2. Market size and forecast, by Product Type
- 8.3.6.5.3. Market size and forecast, by Technique
- 8.3.6.5.4. Market size and forecast, by Disease Type
- 8.3.6.5.5. Market size and forecast, by End User
- 8.3.6.6. Rest of Europe
- 8.3.6.6.1. Key market trends, growth factors and opportunities
- 8.3.6.6.2. Market size and forecast, by Product Type
- 8.3.6.6.3. Market size and forecast, by Technique
- 8.3.6.6.4. Market size and forecast, by Disease Type
- 8.3.6.6.5. Market size and forecast, by End User
- 8.4. Asia-Pacific
- 8.4.1. Key trends and opportunities
- 8.4.2. Market size and forecast, by Product Type
- 8.4.3. Market size and forecast, by Technique
- 8.4.4. Market size and forecast, by Disease Type
- 8.4.5. Market size and forecast, by End User
- 8.4.6. Market size and forecast, by country
- 8.4.6.1. Japan
- 8.4.6.1.1. Key market trends, growth factors and opportunities
- 8.4.6.1.2. Market size and forecast, by Product Type
- 8.4.6.1.3. Market size and forecast, by Technique
- 8.4.6.1.4. Market size and forecast, by Disease Type
- 8.4.6.1.5. Market size and forecast, by End User
- 8.4.6.2. China
- 8.4.6.2.1. Key market trends, growth factors and opportunities
- 8.4.6.2.2. Market size and forecast, by Product Type
- 8.4.6.2.3. Market size and forecast, by Technique
- 8.4.6.2.4. Market size and forecast, by Disease Type
- 8.4.6.2.5. Market size and forecast, by End User
- 8.4.6.3. Australia
- 8.4.6.3.1. Key market trends, growth factors and opportunities
- 8.4.6.3.2. Market size and forecast, by Product Type
- 8.4.6.3.3. Market size and forecast, by Technique
- 8.4.6.3.4. Market size and forecast, by Disease Type
- 8.4.6.3.5. Market size and forecast, by End User
- 8.4.6.4. India
- 8.4.6.4.1. Key market trends, growth factors and opportunities
- 8.4.6.4.2. Market size and forecast, by Product Type
- 8.4.6.4.3. Market size and forecast, by Technique
- 8.4.6.4.4. Market size and forecast, by Disease Type
- 8.4.6.4.5. Market size and forecast, by End User
- 8.4.6.5. South Korea
- 8.4.6.5.1. Key market trends, growth factors and opportunities
- 8.4.6.5.2. Market size and forecast, by Product Type
- 8.4.6.5.3. Market size and forecast, by Technique
- 8.4.6.5.4. Market size and forecast, by Disease Type
- 8.4.6.5.5. Market size and forecast, by End User
- 8.4.6.6. Rest of Asia-Pacific
- 8.4.6.6.1. Key market trends, growth factors and opportunities
- 8.4.6.6.2. Market size and forecast, by Product Type
- 8.4.6.6.3. Market size and forecast, by Technique
- 8.4.6.6.4. Market size and forecast, by Disease Type
- 8.4.6.6.5. Market size and forecast, by End User
- 8.5. LAMEA
- 8.5.1. Key trends and opportunities
- 8.5.2. Market size and forecast, by Product Type
- 8.5.3. Market size and forecast, by Technique
- 8.5.4. Market size and forecast, by Disease Type
- 8.5.5. Market size and forecast, by End User
- 8.5.6. Market size and forecast, by country
- 8.5.6.1. Brazil
- 8.5.6.1.1. Key market trends, growth factors and opportunities
- 8.5.6.1.2. Market size and forecast, by Product Type
- 8.5.6.1.3. Market size and forecast, by Technique
- 8.5.6.1.4. Market size and forecast, by Disease Type
- 8.5.6.1.5. Market size and forecast, by End User
- 8.5.6.2. Saudi Arabia
- 8.5.6.2.1. Key market trends, growth factors and opportunities
- 8.5.6.2.2. Market size and forecast, by Product Type
- 8.5.6.2.3. Market size and forecast, by Technique
- 8.5.6.2.4. Market size and forecast, by Disease Type
- 8.5.6.2.5. Market size and forecast, by End User
- 8.5.6.3. South Africa
- 8.5.6.3.1. Key market trends, growth factors and opportunities
- 8.5.6.3.2. Market size and forecast, by Product Type
- 8.5.6.3.3. Market size and forecast, by Technique
- 8.5.6.3.4. Market size and forecast, by Disease Type
- 8.5.6.3.5. Market size and forecast, by End User
- 8.5.6.4. Rest of LAMEA
- 8.5.6.4.1. Key market trends, growth factors and opportunities
- 8.5.6.4.2. Market size and forecast, by Product Type
- 8.5.6.4.3. Market size and forecast, by Technique
- 8.5.6.4.4. Market size and forecast, by Disease Type
- 8.5.6.4.5. Market size and forecast, by End User
CHAPTER 9: COMPETITIVE LANDSCAPE
- 9.1. Introduction
- 9.2. Top winning strategies
- 9.3. Product Mapping of Top 10 Player
- 9.4. Competitive Dashboard
- 9.5. Competitive Heatmap
- 9.6. Top player positioning, 2022
CHAPTER 10: COMPANY PROFILES
- 10.1. Becton Dickinson & Company
- 10.1.1. Company overview
- 10.1.2. Key Executives
- 10.1.3. Company snapshot
- 10.1.4. Operating business segments
- 10.1.5. Product portfolio
- 10.1.6. Business performance
- 10.2. Biomerica, Inc.
- 10.2.1. Company overview
- 10.2.2. Key Executives
- 10.2.3. Company snapshot
- 10.2.4. Operating business segments
- 10.2.5. Product portfolio
- 10.2.6. Business performance
- 10.3. Biomerieux SA
- 10.3.1. Company overview
- 10.3.2. Key Executives
- 10.3.3. Company snapshot
- 10.3.4. Operating business segments
- 10.3.5. Product portfolio
- 10.3.6. Business performance
- 10.3.7. Key strategic moves and developments
- 10.4. Bio-Rad Laboratories, Inc.
- 10.4.1. Company overview
- 10.4.2. Key Executives
- 10.4.3. Company snapshot
- 10.4.4. Operating business segments
- 10.4.5. Product portfolio
- 10.4.6. Business performance
- 10.5. Diasorin S.p.A.
- 10.5.1. Company overview
- 10.5.2. Key Executives
- 10.5.3. Company snapshot
- 10.5.4. Operating business segments
- 10.5.5. Product portfolio
- 10.5.6. Business performance
- 10.5.7. Key strategic moves and developments
- 10.6. Meridian Bioscience Inc.
- 10.6.1. Company overview
- 10.6.2. Key Executives
- 10.6.3. Company snapshot
- 10.6.4. Operating business segments
- 10.6.5. Product portfolio
- 10.6.6. Business performance
- 10.6.7. Key strategic moves and developments
- 10.7. Quest Diagnostics Inc.
- 10.7.1. Company overview
- 10.7.2. Key Executives
- 10.7.3. Company snapshot
- 10.7.4. Operating business segments
- 10.7.5. Product portfolio
- 10.7.6. Business performance
- 10.7.7. Key strategic moves and developments
- 10.8. Trinity Biotech
- 10.8.1. Company overview
- 10.8.2. Key Executives
- 10.8.3. Company snapshot
- 10.8.4. Operating business segments
- 10.8.5. Product portfolio
- 10.8.6. Business performance
- 10.8.7. Key strategic moves and developments
- 10.9. Coris BioConcept
- 10.9.1. Company overview
- 10.9.2. Key Executives
- 10.9.3. Company snapshot
- 10.9.4. Operating business segments
- 10.9.5. Product portfolio
- 10.10. Abbott Laboratories
- 10.10.1. Company overview
- 10.10.2. Key Executives
- 10.10.3. Company snapshot
- 10.10.4. Operating business segments
- 10.10.5. Product portfolio
- 10.10.6. Business performance