 |
市場調査レポート
商品コード
1298275
ゲーミングキーボード市場:製品タイプ別、価格帯別、流通チャネル別:世界の機会分析と産業予測、2021-2031年Gaming Keyboard Market By Product Type, By Price point, By Distribution Channel : Global Opportunity Analysis and Industry Forecast, 2021-2031 |
||||||

| ゲーミングキーボード市場:製品タイプ別、価格帯別、流通チャネル別:世界の機会分析と産業予測、2021-2031年 |
|
出版日: 2023年03月01日
発行: Allied Market Research
ページ情報: 英文 400 Pages
納期: 2~3営業日
|
- 全表示
- 概要
- 図表
- 目次
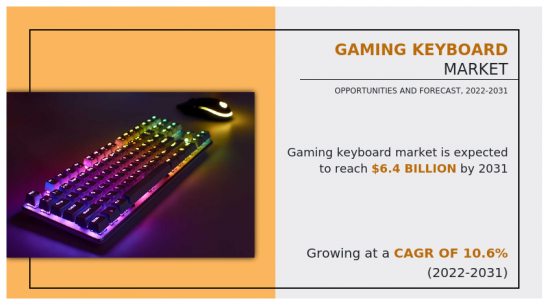
ゲーミングキーボードの市場規模は2021年に23億7,390万米ドルとなり、2022年から2031年にかけてCAGR 13.0%で成長し、2031年には63億4,920万米ドルに達すると予測されています。
ゲームはここ数十年、娯楽の源として、また緊張や疲労を和らげる手段として人気が高まっています。世界中の多くの人々が、ゲームへの没入感を高め、最高のゲーム体験を楽しむために、PCゲームだけでなく、関連機器やアクセサリーを購入する用意ができています。ゲーム機器は特殊な小売業態でしか入手できず、特に新興諸国では要件のミスマッチがあったため、数年前まではゲームアクセサリーへの消費者のアクセスは著しく制限されていました。従来のコンピュータや電気製品のビジネスの中には、消費者層を広げるためにゲーム機器やアクセサリーを提供し始めたところもあります。さらに、インターネットが世界中に普及するにつれて、ゲーム関連のものを販売するオンライン・チャネルの利用が大幅に増加しました。顧客はゲーミングキーボードなどのゲーミング機器やアクセサリーに簡単にアクセスできるようになっています。このため、ゲーミングキーボードやマウスを購入するユーザーが増加し、市場の拡大につながっています。さまざまな流通チャネルを通じてゲーミングキーボードを入手できるようになったことが、市場拡大につながっています。
ゲーミングデバイスや周辺機器は高度に専門化された機器であり、適切に動作させるためには複雑なハードウェア、ソフトウェア、 促進要因を必要とします。市場の競合各社は、最高の性能を備えた高品質のゲーミングキーボードを顧客に提供する一方、素晴らしいゲーム体験を提供するためにいくつかの機能を盛り込むことを目指しています。一方、余分な機能を盛り込むことは、製品の製造コストを押し上げる傾向にあり、製品の最終的な販売価格の上昇につながります。プレイ時間や好みが予測できないため、レジャーとしてビデオゲームをプレイする発展途上国の消費者は、高価なゲーム機器に多額の資金を投資することをためらうかもしれないです。さらに、ゲーミングキーボード業界に参入していない地域では、ゲーミングキーボードを他の地域から輸入しなければならず、製品価格がさらに上昇します。この価格高騰が市場の拡大を妨げています。
目次
第1章 イントロダクション
第2章 エグゼクティブサマリー
第3章 市場概要
- 市場の定義と範囲
- 主な調査結果
- 影響要因
- 主な投資機会
- ポーターのファイブフォース分析
- 供給企業の交渉力
- 買い手の交渉力
- 代替品の脅威
- 新規参入業者の脅威
- 競合の激しさ
- 市場力学
- 促進要因
- エスポーツ産業の成長
- 流通チャネルの改善
- 阻害要因
- ゲーミングキーボードの高価格
- 偽造品の流通
- 機会
- 政府のイニシアチブの増加がゲーム産業を後押し
- 促進要因
- COVID-19:市場への影響分析
- 市場シェア分析
- 親市場分析
- 価格分析
- バリューチェーン分析
第4章 ゲーミングキーボード市場:製品タイプ別
- 概要
- 市場規模と予測
- メカニカル
- 主な市場動向、成長要因、機会
- 市場規模・予測:地域別
- 市場シェア分析:国別
- メカニカルゲーミングキーボード市場:サブタイプ別
- 有線市場規模・予測:地域別
- ワイヤレス市場規模・予測:地域別
- メンブレン
- 主要市場動向、成長要因、機会
- 市場規模・予測: 地域別
- 市場シェア分析: 国別
- メンブレンゲーミングキーボード市場:サブタイプ別
- 有線市場規模・予測:地域別
- ワイヤレス市場規模・予測:地域別
第5章 ゲーミングキーボード市場:価格帯別
- 概要
- 市場規模・予測
- 低価格
- 主な市場動向、成長要因、機会
- 市場規模・予測:地域別
- 市場シェア分析:国別
- 中価格
- 主な市場動向、成長要因、機会
- 市場規模・予測:地域別
- 市場シェア分析:国別
- 高価格
- 主な市場動向、成長要因、機会
- 市場規模・予測:地域別
- 市場シェア分析:国別
第6章 ゲーミングキーボード市場:流通チャネル別
- 概要
- 市場規模と予測
- スーパーマーケット/ハイパーマーケット
- 主な市場動向、成長要因、機会
- 市場規模・予測:地域別
- 市場シェア分析:国別
- 専門店
- 主要市場動向、成長要因、機会
- 市場規模・予測:地域別
- 市場シェア分析:国別
- eコマース
- 主な市場動向、成長要因、機会
- 市場規模・予測:地域別
- 市場シェア分析:国別
- 独立小売店舗
- 主な市場動向、成長要因、機会
- 市場規模・予測:地域別
- 市場シェア分析:国別
第7章 ゲーミングキーボード市場:地域別
- 概要
- 市場規模・予測:地域別
- 北米
- 主な動向と機会
- 市場規模・予測:製品タイプ別
- 市場規模・予測:価格帯別
- 市場規模・予測:流通チャネル別
- 市場規模・予測:国別
- 米国
- 主要市場動向、成長要因、機会
- 市場規模・予測:製品タイプ別
- 市場規模・予測:価格帯別
- 市場規模・予測:流通チャネル別
- カナダ
- 主要市場動向、成長要因、機会
- 市場規模・予測:製品タイプ別
- 市場規模・予測:価格帯別
- 市場規模・予測:流通チャネル別
- メキシコ
- 主要市場動向、成長要因、機会
- 市場規模・予測:製品タイプ別
- 市場規模・予測:価格帯別
- 市場規模・予測:流通チャネル別
- 欧州
- 主要動向と機会
- 市場規模・予測:製品タイプ別
- 市場規模・予測:価格帯別
- 市場規模・予測:流通チャネル別
- 市場規模・予測:国別
- 英国
- 主要市場動向、成長要因、機会
- 市場規模・予測:製品タイプ別
- 市場規模・予測:価格帯別
- 市場規模・予測:流通チャネル別
- ドイツ
- 主要市場動向、成長要因、機会
- 市場規模・予測:製品タイプ別
- 市場規模・予測:価格帯別
- 市場規模・予測:流通チャネル別
- フランス
- 主要市場動向、成長要因、機会
- 市場規模・予測:製品タイプ別
- 市場規模・予測:価格帯別
- 市場規模・予測:流通チャネル別
- ロシア連邦
- 主要市場動向、成長要因、機会
- 市場規模・予測:製品タイプ別
- 市場規模・予測:価格帯別
- 市場規模・予測:流通チャネル別
- イタリア
- 主要市場動向、成長要因、機会
- 市場規模・予測:製品タイプ別
- 市場規模・予測:価格帯別
- 市場規模・予測:流通チャネル別
- スペイン
- 主要市場動向、成長要因、機会
- 市場規模・予測:製品タイプ別
- 市場規模・予測:価格帯別
- 市場規模・予測:流通チャネル別
- その他欧州
- 主要市場動向、成長要因、機会
- 市場規模・予測:製品タイプ別
- 市場規模・予測:価格帯別
- 市場規模・予測:流通チャネル別
- アジア太平洋地域
- 主要動向と機会
- 市場規模・予測:製品タイプ別
- 市場規模・予測:価格帯別
- 市場規模・予測:流通チャネル別
- 市場規模・予測:国別
- 中国市場
- 主要市場動向、成長要因、機会
- 市場規模・予測:製品タイプ別
- 市場規模・予測:価格帯別
- 市場規模・予測:流通チャネル別
- 日本
- 主要市場動向、成長要因、機会
- 市場規模・予測:製品タイプ別
- 市場規模・予測:価格帯別
- 市場規模・予測:流通チャネル別
- インド
- 主要市場動向、成長要因、機会
- 市場規模・予測:製品タイプ別
- 市場規模・予測:価格帯別
- 市場規模・予測:流通チャネル別
- 韓国
- 主要市場動向、成長要因、機会
- 市場規模・予測:製品タイプ別
- 市場規模・予測:価格帯別
- 市場規模・予測:流通チャネル別
- オーストラリア
- 主要市場動向、成長要因、機会
- 市場規模・予測:製品タイプ別
- 市場規模・予測:価格帯別
- 市場規模・予測:流通チャネル別
- その他アジア太平洋地域
- 主要市場動向、成長要因、機会
- 市場規模・予測:製品タイプ別
- 市場規模・予測:価格帯別
- 市場規模・予測:流通チャネル別
- ラテンアメリカ・中東・アフリカ
- 主要動向と機会
- 市場規模・予測:製品タイプ別
- 市場規模・予測:価格帯別
- 市場規模・予測:流通チャネル別
- 市場規模・予測:国別
- ブラジル
- 主要市場動向、成長要因、機会
- 市場規模・予測:製品タイプ別
- 市場規模・予測:価格帯別
- 市場規模・予測:流通チャネル別
- 南アフリカ
- 主要市場動向、成長要因、機会
- 市場規模・予測:製品タイプ別
- 市場規模・予測:価格帯別
- 市場規模・予測:流通チャネル別
- サウジアラビア
- 主要市場動向、成長要因、機会
- 市場規模・予測:製品タイプ別
- 市場規模・予測:価格帯別
- 市場規模・予測:流通チャネル別
- アルゼンチン
- 主要市場動向、成長要因、機会
- 市場規模・予測:製品タイプ別
- 市場規模・予測:価格帯別
- 市場規模・予測:流通チャネル別
- その他の地域
- 主要市場動向、成長要因、機会
- 市場規模・予測:製品タイプ別
- 市場規模・予測:価格帯別
- 市場規模・予測:流通チャネル別
第8章 競合情勢
- イントロダクション
- 主要成功戦略
- 主要10社の製品マッピング
- 競合ダッシュボード
- 競合ヒートマップ
- トップ企業のポジショニング(2021年)
第9章 企業プロファイル
- Ant Esports
- AsusTek Computer Inc.
- Bloody
- Corsair Gaming, Inc.
- HP Inc.
- Lenovo Group Limited
- Logitech International S.A.
- Mad Catz Global Limited
- Mionix
- Razer Inc.
- Sharkoon Technologies GmbH
- Shenzhen Rapoo Technology Co., LTD
- SteelSeries ApS
- Eastern Times Technology Co., ltd
- Turtle Beach Corporation
LIST OF TABLES
- TABLE 01. GLOBAL GAMING KEYBOARD MARKET, BY PRODUCT TYPE, 2021-2031 ($MILLION)
- TABLE 02. GLOBAL GAMING KEYBOARD MARKET, BY PRODUCT TYPE, 2021-2031 (MILLION UNITS)
- TABLE 03. GAMING KEYBOARD MARKET FOR MECHANICAL, BY REGION, 2021-2031 ($MILLION)
- TABLE 04. GAMING KEYBOARD MARKET FOR MECHANICAL, BY REGION, 2021-2031 (MILLION UNITS)
- TABLE 05. GLOBAL MECHANICAL GAMING KEYBOARD MARKET, BY SUB-TYPE, 2021-2031 ($MILLION)
- TABLE 06. GLOBAL MECHANICAL GAMING KEYBOARD MARKET, BY SUB-TYPE, 2021-2031 (MILLION UNITS)
- TABLE 07. GAMING KEYBOARD MARKET FOR WIRED, BY REGION, 2021-2031 ($MILLION)
- TABLE 08. GAMING KEYBOARD MARKET FOR WIRED, BY REGION, 2021-2031 (MILLION UNITS)
- TABLE 09. GAMING KEYBOARD MARKET FOR WIRELESS, BY REGION, 2021-2031 ($MILLION)
- TABLE 10. GAMING KEYBOARD MARKET FOR WIRELESS, BY REGION, 2021-2031 (MILLION UNITS)
- TABLE 11. GAMING KEYBOARD MARKET FOR MEMBRANE, BY REGION, 2021-2031 ($MILLION)
- TABLE 12. GAMING KEYBOARD MARKET FOR MEMBRANE, BY REGION, 2021-2031 (MILLION UNITS)
- TABLE 13. GLOBAL MEMBRANE GAMING KEYBOARD MARKET, BY SUB-TYPE, 2021-2031 ($MILLION)
- TABLE 14. GLOBAL MEMBRANE GAMING KEYBOARD MARKET, BY SUB-TYPE, 2021-2031 (MILLION UNITS)
- TABLE 15. GAMING KEYBOARD MARKET FOR WIRED, BY REGION, 2021-2031 ($MILLION)
- TABLE 16. GAMING KEYBOARD MARKET FOR WIRED, BY REGION, 2021-2031 (MILLION UNITS)
- TABLE 17. GAMING KEYBOARD MARKET FOR WIRELESS, BY REGION, 2021-2031 ($MILLION)
- TABLE 18. GAMING KEYBOARD MARKET FOR WIRELESS, BY REGION, 2021-2031 (MILLION UNITS)
- TABLE 19. GLOBAL GAMING KEYBOARD MARKET, BY PRICE POINT, 2021-2031 ($MILLION)
- TABLE 20. GAMING KEYBOARD MARKET FOR LOW-PRICED, BY REGION, 2021-2031 ($MILLION)
- TABLE 21. GAMING KEYBOARD MARKET FOR MEDIUM-PRICED, BY REGION, 2021-2031 ($MILLION)
- TABLE 22. GAMING KEYBOARD MARKET FOR HIGH-PRICED, BY REGION, 2021-2031 ($MILLION)
- TABLE 23. GLOBAL GAMING KEYBOARD MARKET, BY DISTRIBUTION CHANNEL, 2021-2031 ($MILLION)
- TABLE 24. GAMING KEYBOARD MARKET FOR SUPERMARKETS/HYPERMARKETS, BY REGION, 2021-2031 ($MILLION)
- TABLE 25. GAMING KEYBOARD MARKET FOR SPECIALTY STORES, BY REGION, 2021-2031 ($MILLION)
- TABLE 26. GAMING KEYBOARD MARKET FOR E-COMMERCE, BY REGION, 2021-2031 ($MILLION)
- TABLE 27. GAMING KEYBOARD MARKET FOR INDEPENDENT RETAIL STORES, BY REGION, 2021-2031 ($MILLION)
- TABLE 28. GAMING KEYBOARD MARKET, BY REGION, 2021-2031 ($MILLION)
- TABLE 29. GAMING KEYBOARD MARKET, BY REGION, 2021-2031 (MILLION UNITS)
- TABLE 30. NORTH AMERICA GAMING KEYBOARD MARKET, BY PRODUCT TYPE, 2021-2031 ($MILLION)
- TABLE 31. NORTH AMERICA GAMING KEYBOARD MARKET, BY PRODUCT TYPE, 2021-2031 (MILLION UNITS)
- TABLE 32. NORTH AMERICA MECHANICAL GAMING KEYBOARD MARKET, BY SUB-TYPE, 2021-2031 ($MILLION)
- TABLE 33. NORTH AMERICA MECHANICAL GAMING KEYBOARD MARKET, BY SUB-TYPE, 2021-2031 (MILLION UNITS)
- TABLE 34. NORTH AMERICA MEMBRANE GAMING KEYBOARD MARKET, BY SUB-TYPE, 2021-2031 ($MILLION)
- TABLE 35. NORTH AMERICA MEMBRANE GAMING KEYBOARD MARKET, BY SUB-TYPE, 2021-2031 (MILLION UNITS)
- TABLE 36. NORTH AMERICA GAMING KEYBOARD MARKET, BY PRICE POINT, 2021-2031 ($MILLION)
- TABLE 37. NORTH AMERICA GAMING KEYBOARD MARKET, BY DISTRIBUTION CHANNEL, 2021-2031 ($MILLION)
- TABLE 38. NORTH AMERICA GAMING KEYBOARD MARKET, BY COUNTRY, 2021-2031 ($MILLION)
- TABLE 39. NORTH AMERICA GAMING KEYBOARD MARKET, BY COUNTRY, 2021-2031 (MILLION UNITS)
- TABLE 40. U.S. GAMING KEYBOARD MARKET, BY PRODUCT TYPE, 2021-2031 ($MILLION)
- TABLE 41. U.S. GAMING KEYBOARD MARKET, BY PRODUCT TYPE, 2021-2031 (MILLION UNITS)
- TABLE 42. U.S. GAMING KEYBOARD MARKET, BY PRICE POINT, 2021-2031 ($MILLION)
- TABLE 43. U.S. GAMING KEYBOARD MARKET, BY DISTRIBUTION CHANNEL, 2021-2031 ($MILLION)
- TABLE 44. CANADA GAMING KEYBOARD MARKET, BY PRODUCT TYPE, 2021-2031 ($MILLION)
- TABLE 45. CANADA GAMING KEYBOARD MARKET, BY PRODUCT TYPE, 2021-2031 (MILLION UNITS)
- TABLE 46. CANADA GAMING KEYBOARD MARKET, BY PRICE POINT, 2021-2031 ($MILLION)
- TABLE 47. CANADA GAMING KEYBOARD MARKET, BY DISTRIBUTION CHANNEL, 2021-2031 ($MILLION)
- TABLE 48. MEXICO GAMING KEYBOARD MARKET, BY PRODUCT TYPE, 2021-2031 ($MILLION)
- TABLE 49. MEXICO GAMING KEYBOARD MARKET, BY PRODUCT TYPE, 2021-2031 (MILLION UNITS)
- TABLE 50. MEXICO GAMING KEYBOARD MARKET, BY PRICE POINT, 2021-2031 ($MILLION)
- TABLE 51. MEXICO GAMING KEYBOARD MARKET, BY DISTRIBUTION CHANNEL, 2021-2031 ($MILLION)
- TABLE 52. EUROPE GAMING KEYBOARD MARKET, BY PRODUCT TYPE, 2021-2031 ($MILLION)
- TABLE 53. EUROPE GAMING KEYBOARD MARKET, BY PRODUCT TYPE, 2021-2031 (MILLION UNITS)
- TABLE 54. EUROPE MECHANICAL GAMING KEYBOARD MARKET, BY SUB-TYPE, 2021-2031 ($MILLION)
- TABLE 55. EUROPE MECHANICAL GAMING KEYBOARD MARKET, BY SUB-TYPE, 2021-2031 (MILLION UNITS)
- TABLE 56. EUROPE MEMBRANE GAMING KEYBOARD MARKET, BY SUB-TYPE, 2021-2031 ($MILLION)
- TABLE 57. EUROPE MEMBRANE GAMING KEYBOARD MARKET, BY SUB-TYPE, 2021-2031 (MILLION UNITS)
- TABLE 58. EUROPE GAMING KEYBOARD MARKET, BY PRICE POINT, 2021-2031 ($MILLION)
- TABLE 59. EUROPE GAMING KEYBOARD MARKET, BY DISTRIBUTION CHANNEL, 2021-2031 ($MILLION)
- TABLE 60. EUROPE GAMING KEYBOARD MARKET, BY COUNTRY, 2021-2031 ($MILLION)
- TABLE 61. EUROPE GAMING KEYBOARD MARKET, BY COUNTRY, 2021-2031 (MILLION UNITS)
- TABLE 62. UK GAMING KEYBOARD MARKET, BY PRODUCT TYPE, 2021-2031 ($MILLION)
- TABLE 63. UK GAMING KEYBOARD MARKET, BY PRODUCT TYPE, 2021-2031 (MILLION UNITS)
- TABLE 64. UK GAMING KEYBOARD MARKET, BY PRICE POINT, 2021-2031 ($MILLION)
- TABLE 65. UK GAMING KEYBOARD MARKET, BY DISTRIBUTION CHANNEL, 2021-2031 ($MILLION)
- TABLE 66. GERMANY GAMING KEYBOARD MARKET, BY PRODUCT TYPE, 2021-2031 ($MILLION)
- TABLE 67. GERMANY GAMING KEYBOARD MARKET, BY PRODUCT TYPE, 2021-2031 (MILLION UNITS)
- TABLE 68. GERMANY GAMING KEYBOARD MARKET, BY PRICE POINT, 2021-2031 ($MILLION)
- TABLE 69. GERMANY GAMING KEYBOARD MARKET, BY DISTRIBUTION CHANNEL, 2021-2031 ($MILLION)
- TABLE 70. FRANCE GAMING KEYBOARD MARKET, BY PRODUCT TYPE, 2021-2031 ($MILLION)
- TABLE 71. FRANCE GAMING KEYBOARD MARKET, BY PRODUCT TYPE, 2021-2031 (MILLION UNITS)
- TABLE 72. FRANCE GAMING KEYBOARD MARKET, BY PRICE POINT, 2021-2031 ($MILLION)
- TABLE 73. FRANCE GAMING KEYBOARD MARKET, BY DISTRIBUTION CHANNEL, 2021-2031 ($MILLION)
- TABLE 74. RUSSIAN FEDERATION GAMING KEYBOARD MARKET, BY PRODUCT TYPE, 2021-2031 ($MILLION)
- TABLE 75. RUSSIAN FEDERATION GAMING KEYBOARD MARKET, BY PRODUCT TYPE, 2021-2031 (MILLION UNITS)
- TABLE 76. RUSSIAN FEDERATION GAMING KEYBOARD MARKET, BY PRICE POINT, 2021-2031 ($MILLION)
- TABLE 77. RUSSIAN FEDERATION GAMING KEYBOARD MARKET, BY DISTRIBUTION CHANNEL, 2021-2031 ($MILLION)
- TABLE 78. ITALY GAMING KEYBOARD MARKET, BY PRODUCT TYPE, 2021-2031 ($MILLION)
- TABLE 79. ITALY GAMING KEYBOARD MARKET, BY PRODUCT TYPE, 2021-2031 (MILLION UNITS)
- TABLE 80. ITALY GAMING KEYBOARD MARKET, BY PRICE POINT, 2021-2031 ($MILLION)
- TABLE 81. ITALY GAMING KEYBOARD MARKET, BY DISTRIBUTION CHANNEL, 2021-2031 ($MILLION)
- TABLE 82. SPAIN GAMING KEYBOARD MARKET, BY PRODUCT TYPE, 2021-2031 ($MILLION)
- TABLE 83. SPAIN GAMING KEYBOARD MARKET, BY PRODUCT TYPE, 2021-2031 (MILLION UNITS)
- TABLE 84. SPAIN GAMING KEYBOARD MARKET, BY PRICE POINT, 2021-2031 ($MILLION)
- TABLE 85. SPAIN GAMING KEYBOARD MARKET, BY DISTRIBUTION CHANNEL, 2021-2031 ($MILLION)
- TABLE 86. REST OF EUROPE GAMING KEYBOARD MARKET, BY PRODUCT TYPE, 2021-2031 ($MILLION)
- TABLE 87. REST OF EUROPE GAMING KEYBOARD MARKET, BY PRODUCT TYPE, 2021-2031 (MILLION UNITS)
- TABLE 88. REST OF EUROPE GAMING KEYBOARD MARKET, BY PRICE POINT, 2021-2031 ($MILLION)
- TABLE 89. REST OF EUROPE GAMING KEYBOARD MARKET, BY DISTRIBUTION CHANNEL, 2021-2031 ($MILLION)
- TABLE 90. ASIA-PACIFIC GAMING KEYBOARD MARKET, BY PRODUCT TYPE, 2021-2031 ($MILLION)
- TABLE 91. ASIA-PACIFIC GAMING KEYBOARD MARKET, BY PRODUCT TYPE, 2021-2031 (MILLION UNITS)
- TABLE 92. ASIA-PACIFIC MECHANICAL GAMING KEYBOARD MARKET, BY SUB-TYPE, 2021-2031 ($MILLION)
- TABLE 93. ASIA-PACIFIC MECHANICAL GAMING KEYBOARD MARKET, BY SUB-TYPE, 2021-2031 (MILLION UNITS)
- TABLE 94. ASIA-PACIFIC MEMBRANE GAMING KEYBOARD MARKET, BY SUB-TYPE, 2021-2031 ($MILLION)
- TABLE 95. ASIA-PACIFIC MEMBRANE GAMING KEYBOARD MARKET, BY SUB-TYPE, 2021-2031 (MILLION UNITS)
- TABLE 96. ASIA-PACIFIC GAMING KEYBOARD MARKET, BY PRICE POINT, 2021-2031 ($MILLION)
- TABLE 97. ASIA-PACIFIC GAMING KEYBOARD MARKET, BY DISTRIBUTION CHANNEL, 2021-2031 ($MILLION)
- TABLE 98. ASIA-PACIFIC GAMING KEYBOARD MARKET, BY COUNTRY, 2021-2031 ($MILLION)
- TABLE 99. ASIA-PACIFIC GAMING KEYBOARD MARKET, BY COUNTRY, 2021-2031 (MILLION UNITS)
- TABLE 100. CHINA GAMING KEYBOARD MARKET, BY PRODUCT TYPE, 2021-2031 ($MILLION)
- TABLE 101. CHINA GAMING KEYBOARD MARKET, BY PRODUCT TYPE, 2021-2031 (MILLION UNITS)
- TABLE 102. CHINA GAMING KEYBOARD MARKET, BY PRICE POINT, 2021-2031 ($MILLION)
- TABLE 103. CHINA GAMING KEYBOARD MARKET, BY DISTRIBUTION CHANNEL, 2021-2031 ($MILLION)
- TABLE 104. JAPAN GAMING KEYBOARD MARKET, BY PRODUCT TYPE, 2021-2031 ($MILLION)
- TABLE 105. JAPAN GAMING KEYBOARD MARKET, BY PRODUCT TYPE, 2021-2031 (MILLION UNITS)
- TABLE 106. JAPAN GAMING KEYBOARD MARKET, BY PRICE POINT, 2021-2031 ($MILLION)
- TABLE 107. JAPAN GAMING KEYBOARD MARKET, BY DISTRIBUTION CHANNEL, 2021-2031 ($MILLION)
- TABLE 108. INDIA GAMING KEYBOARD MARKET, BY PRODUCT TYPE, 2021-2031 ($MILLION)
- TABLE 109. INDIA GAMING KEYBOARD MARKET, BY PRODUCT TYPE, 2021-2031 (MILLION UNITS)
- TABLE 110. INDIA GAMING KEYBOARD MARKET, BY PRICE POINT, 2021-2031 ($MILLION)
- TABLE 111. INDIA GAMING KEYBOARD MARKET, BY DISTRIBUTION CHANNEL, 2021-2031 ($MILLION)
- TABLE 112. SOUTH KOREA GAMING KEYBOARD MARKET, BY PRODUCT TYPE, 2021-2031 ($MILLION)
- TABLE 113. SOUTH KOREA GAMING KEYBOARD MARKET, BY PRODUCT TYPE, 2021-2031 (MILLION UNITS)
- TABLE 114. SOUTH KOREA GAMING KEYBOARD MARKET, BY PRICE POINT, 2021-2031 ($MILLION)
- TABLE 115. SOUTH KOREA GAMING KEYBOARD MARKET, BY DISTRIBUTION CHANNEL, 2021-2031 ($MILLION)
- TABLE 116. AUSTRALIA GAMING KEYBOARD MARKET, BY PRODUCT TYPE, 2021-2031 ($MILLION)
- TABLE 117. AUSTRALIA GAMING KEYBOARD MARKET, BY PRODUCT TYPE, 2021-2031 (MILLION UNITS)
- TABLE 118. AUSTRALIA GAMING KEYBOARD MARKET, BY PRICE POINT, 2021-2031 ($MILLION)
- TABLE 119. AUSTRALIA GAMING KEYBOARD MARKET, BY DISTRIBUTION CHANNEL, 2021-2031 ($MILLION)
- TABLE 120. REST OF ASIA-PACIFIC GAMING KEYBOARD MARKET, BY PRODUCT TYPE, 2021-2031 ($MILLION)
- TABLE 121. REST OF ASIA-PACIFIC GAMING KEYBOARD MARKET, BY PRODUCT TYPE, 2021-2031 (MILLION UNITS)
- TABLE 122. REST OF ASIA-PACIFIC GAMING KEYBOARD MARKET, BY PRICE POINT, 2021-2031 ($MILLION)
- TABLE 123. REST OF ASIA-PACIFIC GAMING KEYBOARD MARKET, BY DISTRIBUTION CHANNEL, 2021-2031 ($MILLION)
- TABLE 124. LAMEA GAMING KEYBOARD MARKET, BY PRODUCT TYPE, 2021-2031 ($MILLION)
- TABLE 125. LAMEA GAMING KEYBOARD MARKET, BY PRODUCT TYPE, 2021-2031 (MILLION UNITS)
- TABLE 126. LAMEA MECHANICAL GAMING KEYBOARD MARKET, BY SUB-TYPE, 2021-2031 ($MILLION)
- TABLE 127. LAMEA MECHANICAL GAMING KEYBOARD MARKET, BY SUB-TYPE, 2021-2031 (MILLION UNITS)
- TABLE 128. LAMEA MEMBRANE GAMING KEYBOARD MARKET, BY SUB-TYPE, 2021-2031 ($MILLION)
- TABLE 129. LAMEA MEMBRANE GAMING KEYBOARD MARKET, BY SUB-TYPE, 2021-2031 (MILLION UNITS)
- TABLE 130. LAMEA GAMING KEYBOARD MARKET, BY PRICE POINT, 2021-2031 ($MILLION)
- TABLE 131. LAMEA GAMING KEYBOARD MARKET, BY DISTRIBUTION CHANNEL, 2021-2031 ($MILLION)
- TABLE 132. LAMEA GAMING KEYBOARD MARKET, BY COUNTRY, 2021-2031 ($MILLION)
- TABLE 133. LAMEA GAMING KEYBOARD MARKET, BY COUNTRY, 2021-2031 (MILLION UNITS)
- TABLE 134. BRAZIL GAMING KEYBOARD MARKET, BY PRODUCT TYPE, 2021-2031 ($MILLION)
- TABLE 135. BRAZIL GAMING KEYBOARD MARKET, BY PRODUCT TYPE, 2021-2031 (MILLION UNITS)
- TABLE 136. BRAZIL GAMING KEYBOARD MARKET, BY PRICE POINT, 2021-2031 ($MILLION)
- TABLE 137. BRAZIL GAMING KEYBOARD MARKET, BY DISTRIBUTION CHANNEL, 2021-2031 ($MILLION)
- TABLE 138. SOUTH AFRICA, GAMING KEYBOARD MARKET, BY PRODUCT TYPE, 2021-2031 ($MILLION)
- TABLE 139. SOUTH AFRICA, GAMING KEYBOARD MARKET, BY PRODUCT TYPE, 2021-2031 (MILLION UNITS)
- TABLE 140. SOUTH AFRICA, GAMING KEYBOARD MARKET, BY PRICE POINT, 2021-2031 ($MILLION)
- TABLE 141. SOUTH AFRICA, GAMING KEYBOARD MARKET, BY DISTRIBUTION CHANNEL, 2021-2031 ($MILLION)
- TABLE 142. SAUDI ARABIA GAMING KEYBOARD MARKET, BY PRODUCT TYPE, 2021-2031 ($MILLION)
- TABLE 143. SAUDI ARABIA GAMING KEYBOARD MARKET, BY PRODUCT TYPE, 2021-2031 (MILLION UNITS)
- TABLE 144. SAUDI ARABIA GAMING KEYBOARD MARKET, BY PRICE POINT, 2021-2031 ($MILLION)
- TABLE 145. SAUDI ARABIA GAMING KEYBOARD MARKET, BY DISTRIBUTION CHANNEL, 2021-2031 ($MILLION)
- TABLE 146. ARGENTINA GAMING KEYBOARD MARKET, BY PRODUCT TYPE, 2021-2031 ($MILLION)
- TABLE 147. ARGENTINA GAMING KEYBOARD MARKET, BY PRODUCT TYPE, 2021-2031 (MILLION UNITS)
- TABLE 148. ARGENTINA GAMING KEYBOARD MARKET, BY PRICE POINT, 2021-2031 ($MILLION)
- TABLE 149. ARGENTINA GAMING KEYBOARD MARKET, BY DISTRIBUTION CHANNEL, 2021-2031 ($MILLION)
- TABLE 150. REST OF LAMEA GAMING KEYBOARD MARKET, BY PRODUCT TYPE, 2021-2031 ($MILLION)
- TABLE 151. REST OF LAMEA GAMING KEYBOARD MARKET, BY PRODUCT TYPE, 2021-2031 (MILLION UNITS)
- TABLE 152. REST OF LAMEA GAMING KEYBOARD MARKET, BY PRICE POINT, 2021-2031 ($MILLION)
- TABLE 153. REST OF LAMEA GAMING KEYBOARD MARKET, BY DISTRIBUTION CHANNEL, 2021-2031 ($MILLION)
- TABLE 154. ANT ESPORTS: KEY EXECUTIVES
- TABLE 155. ANT ESPORTS: COMPANY SNAPSHOT
- TABLE 156. ANT ESPORTS: PRODUCT SEGMENTS
- TABLE 157. ANT ESPORTS: PRODUCT PORTFOLIO
- TABLE 158. ASUSTEK COMPUTER INC.: KEY EXECUTIVES
- TABLE 159. ASUSTEK COMPUTER INC.: COMPANY SNAPSHOT
- TABLE 160. ASUSTEK COMPUTER INC.: PRODUCT SEGMENTS
- TABLE 161. ASUSTEK COMPUTER INC.: PRODUCT PORTFOLIO
- TABLE 162. ASUSTEK COMPUTER INC.: KEY STRATERGIES
- TABLE 163. BLOODY: KEY EXECUTIVES
- TABLE 164. BLOODY: COMPANY SNAPSHOT
- TABLE 165. BLOODY: PRODUCT SEGMENTS
- TABLE 166. BLOODY: PRODUCT PORTFOLIO
- TABLE 167. CORSAIR GAMING, INC.: KEY EXECUTIVES
- TABLE 168. CORSAIR GAMING, INC.: COMPANY SNAPSHOT
- TABLE 169. CORSAIR GAMING, INC.: PRODUCT SEGMENTS
- TABLE 170. CORSAIR GAMING, INC.: PRODUCT PORTFOLIO
- TABLE 171. CORSAIR GAMING, INC.: KEY STRATERGIES
- TABLE 172. HP INC.: KEY EXECUTIVES
- TABLE 173. HP INC.: COMPANY SNAPSHOT
- TABLE 174. HP INC.: PRODUCT SEGMENTS
- TABLE 175. HP INC.: PRODUCT PORTFOLIO
- TABLE 176. HP INC.: KEY STRATERGIES
- TABLE 177. LENOVO GROUP LIMITED: KEY EXECUTIVES
- TABLE 178. LENOVO GROUP LIMITED: COMPANY SNAPSHOT
- TABLE 179. LENOVO GROUP LIMITED: PRODUCT SEGMENTS
- TABLE 180. LENOVO GROUP LIMITED: PRODUCT PORTFOLIO
- TABLE 181. LOGITECH INTERNATIONAL S.A.: KEY EXECUTIVES
- TABLE 182. LOGITECH INTERNATIONAL S.A.: COMPANY SNAPSHOT
- TABLE 183. LOGITECH INTERNATIONAL S.A.: PRODUCT SEGMENTS
- TABLE 184. LOGITECH INTERNATIONAL S.A.: PRODUCT PORTFOLIO
- TABLE 185. LOGITECH INTERNATIONAL S.A.: KEY STRATERGIES
- TABLE 186. MAD CATZ GLOBAL LIMITED: KEY EXECUTIVES
- TABLE 187. MAD CATZ GLOBAL LIMITED: COMPANY SNAPSHOT
- TABLE 188. MAD CATZ GLOBAL LIMITED: PRODUCT SEGMENTS
- TABLE 189. MAD CATZ GLOBAL LIMITED: PRODUCT PORTFOLIO
- TABLE 190. MAD CATZ GLOBAL LIMITED: KEY STRATERGIES
- TABLE 191. MIONIX: KEY EXECUTIVES
- TABLE 192. MIONIX: COMPANY SNAPSHOT
- TABLE 193. MIONIX: PRODUCT SEGMENTS
- TABLE 194. MIONIX: PRODUCT PORTFOLIO
- TABLE 195. RAZER INC.: KEY EXECUTIVES
- TABLE 196. RAZER INC.: COMPANY SNAPSHOT
- TABLE 197. RAZER INC.: PRODUCT SEGMENTS
- TABLE 198. RAZER INC.: PRODUCT PORTFOLIO
- TABLE 199. RAZER INC.: KEY STRATERGIES
- TABLE 200. SHARKOON TECHNOLOGIES GMBH: KEY EXECUTIVES
- TABLE 201. SHARKOON TECHNOLOGIES GMBH: COMPANY SNAPSHOT
- TABLE 202. SHARKOON TECHNOLOGIES GMBH: PRODUCT SEGMENTS
- TABLE 203. SHARKOON TECHNOLOGIES GMBH: PRODUCT PORTFOLIO
- TABLE 204. SHENZHEN RAPOO TECHNOLOGY CO., LTD: KEY EXECUTIVES
- TABLE 205. SHENZHEN RAPOO TECHNOLOGY CO., LTD: COMPANY SNAPSHOT
- TABLE 206. SHENZHEN RAPOO TECHNOLOGY CO., LTD: PRODUCT SEGMENTS
- TABLE 207. SHENZHEN RAPOO TECHNOLOGY CO., LTD: PRODUCT PORTFOLIO
- TABLE 208. STEELSERIES APS: KEY EXECUTIVES
- TABLE 209. STEELSERIES APS: COMPANY SNAPSHOT
- TABLE 210. STEELSERIES APS: PRODUCT SEGMENTS
- TABLE 211. STEELSERIES APS: PRODUCT PORTFOLIO
- TABLE 212. EASTERN TIMES TECHNOLOGY CO., LTD: KEY EXECUTIVES
- TABLE 213. EASTERN TIMES TECHNOLOGY CO., LTD: COMPANY SNAPSHOT
- TABLE 214. EASTERN TIMES TECHNOLOGY CO., LTD: PRODUCT SEGMENTS
- TABLE 215. EASTERN TIMES TECHNOLOGY CO., LTD: PRODUCT PORTFOLIO
- TABLE 216. TURTLE BEACH CORPORATION: KEY EXECUTIVES
- TABLE 217. TURTLE BEACH CORPORATION: COMPANY SNAPSHOT
- TABLE 218. TURTLE BEACH CORPORATION: PRODUCT SEGMENTS
- TABLE 219. TURTLE BEACH CORPORATION: PRODUCT PORTFOLIO
- TABLE 220. TURTLE BEACH CORPORATION: KEY STRATERGIES
LIST OF FIGURES
- FIGURE 01. GAMING KEYBOARD MARKET, 2021-2031
- FIGURE 02. SEGMENTATION OF GAMING KEYBOARD MARKET, 2021-2031
- FIGURE 03. TOP INVESTMENT POCKETS IN GAMING KEYBOARD MARKET (2022-2031)
- FIGURE 04. MODERATE BARGAINING POWER OF SUPPLIERS
- FIGURE 05. MODERATE BARGAINING POWER OF BUYERS
- FIGURE 06. MODERATE THREAT OF SUBSTITUTES
- FIGURE 07. MODERATE THREAT OF NEW ENTRANTS
- FIGURE 08. MODERATE INTENSITY OF RIVALRY
- FIGURE 09. DRIVERS, RESTRAINTS AND OPPORTUNITIES: GLOBALGAMING KEYBOARD MARKET
- FIGURE 10. MARKET SHARE ANALYSIS: GAMING KEYBOARD MARKET
- FIGURE 11. PRICING ANALYSIS: GAMING KEYBOARD MARKET 2021 AND 2031
- FIGURE 12. VALUE CHAIN ANALYSIS: GAMING KEYBOARD MARKET
- FIGURE 13. GAMING KEYBOARD MARKET, BY PRODUCT TYPE, 2021(%)
- FIGURE 14. COMPARATIVE SHARE ANALYSIS OF GAMING KEYBOARD MARKET FOR MECHANICAL, BY COUNTRY 2021 AND 2031(%)
- FIGURE 15. COMPARATIVE SHARE ANALYSIS OF GAMING KEYBOARD MARKET FOR MEMBRANE, BY COUNTRY 2021 AND 2031(%)
- FIGURE 16. GAMING KEYBOARD MARKET, BY PRICE POINT, 2021(%)
- FIGURE 17. COMPARATIVE SHARE ANALYSIS OF GAMING KEYBOARD MARKET FOR LOW-PRICED, BY COUNTRY 2021 AND 2031(%)
- FIGURE 18. COMPARATIVE SHARE ANALYSIS OF GAMING KEYBOARD MARKET FOR MEDIUM-PRICED, BY COUNTRY 2021 AND 2031(%)
- FIGURE 19. COMPARATIVE SHARE ANALYSIS OF GAMING KEYBOARD MARKET FOR HIGH-PRICED, BY COUNTRY 2021 AND 2031(%)
- FIGURE 20. GAMING KEYBOARD MARKET, BY DISTRIBUTION CHANNEL, 2021(%)
- FIGURE 21. COMPARATIVE SHARE ANALYSIS OF GAMING KEYBOARD MARKET FOR SUPERMARKETS/HYPERMARKETS, BY COUNTRY 2021 AND 2031(%)
- FIGURE 22. COMPARATIVE SHARE ANALYSIS OF GAMING KEYBOARD MARKET FOR SPECIALTY STORES, BY COUNTRY 2021 AND 2031(%)
- FIGURE 23. COMPARATIVE SHARE ANALYSIS OF GAMING KEYBOARD MARKET FOR E-COMMERCE, BY COUNTRY 2021 AND 2031(%)
- FIGURE 24. COMPARATIVE SHARE ANALYSIS OF GAMING KEYBOARD MARKET FOR INDEPENDENT RETAIL STORES, BY COUNTRY 2021 AND 2031(%)
- FIGURE 25. GAMING KEYBOARD MARKET BY REGION, 2021
- FIGURE 26. U.S. GAMING KEYBOARD MARKET, 2021-2031 ($MILLION)
- FIGURE 27. CANADA GAMING KEYBOARD MARKET, 2021-2031 ($MILLION)
- FIGURE 28. MEXICO GAMING KEYBOARD MARKET, 2021-2031 ($MILLION)
- FIGURE 29. UK GAMING KEYBOARD MARKET, 2021-2031 ($MILLION)
- FIGURE 30. GERMANY GAMING KEYBOARD MARKET, 2021-2031 ($MILLION)
- FIGURE 31. FRANCE GAMING KEYBOARD MARKET, 2021-2031 ($MILLION)
- FIGURE 32. RUSSIAN FEDERATION GAMING KEYBOARD MARKET, 2021-2031 ($MILLION)
- FIGURE 33. ITALY GAMING KEYBOARD MARKET, 2021-2031 ($MILLION)
- FIGURE 34. SPAIN GAMING KEYBOARD MARKET, 2021-2031 ($MILLION)
- FIGURE 35. REST OF EUROPE GAMING KEYBOARD MARKET, 2021-2031 ($MILLION)
- FIGURE 36. CHINA GAMING KEYBOARD MARKET, 2021-2031 ($MILLION)
- FIGURE 37. JAPAN GAMING KEYBOARD MARKET, 2021-2031 ($MILLION)
- FIGURE 38. INDIA GAMING KEYBOARD MARKET, 2021-2031 ($MILLION)
- FIGURE 39. SOUTH KOREA GAMING KEYBOARD MARKET, 2021-2031 ($MILLION)
- FIGURE 40. AUSTRALIA GAMING KEYBOARD MARKET, 2021-2031 ($MILLION)
- FIGURE 41. REST OF ASIA-PACIFIC GAMING KEYBOARD MARKET, 2021-2031 ($MILLION)
- FIGURE 42. BRAZIL GAMING KEYBOARD MARKET, 2021-2031 ($MILLION)
- FIGURE 43. SOUTH AFRICA, GAMING KEYBOARD MARKET, 2021-2031 ($MILLION)
- FIGURE 44. SAUDI ARABIA GAMING KEYBOARD MARKET, 2021-2031 ($MILLION)
- FIGURE 45. ARGENTINA GAMING KEYBOARD MARKET, 2021-2031 ($MILLION)
- FIGURE 46. REST OF LAMEA GAMING KEYBOARD MARKET, 2021-2031 ($MILLION)
- FIGURE 47. TOP WINNING STRATEGIES, BY YEAR
- FIGURE 48. TOP WINNING STRATEGIES, BY DEVELOPMENT
- FIGURE 49. TOP WINNING STRATEGIES, BY COMPANY
- FIGURE 50. PRODUCT MAPPING OF TOP 10 PLAYERS
- FIGURE 51. COMPETITIVE DASHBOARD
- FIGURE 52. COMPETITIVE HEATMAP: GAMING KEYBOARD MARKET
- FIGURE 53. TOP PLAYER POSITIONING, 2021
- FIGURE 54. ASUSTEK COMPUTER INC.: NET REVENUE, 2019-2021 ($MILLION)
- FIGURE 55. ASUSTEK COMPUTER INC.: RESEARCH & DEVELOPMENT EXPENDITURE, 2019-2021
- FIGURE 56. ASUSTEK COMPUTER INC.: REVENUE SHARE BY SEGMENT, 2021 (%)
- FIGURE 57. ASUSTEK COMPUTER INC.: REVENUE SHARE BY REGION, 2021 (%)
- FIGURE 58. CORSAIR GAMING, INC.: NET REVENUE, 2019-2021 ($MILLION)
- FIGURE 59. CORSAIR GAMING, INC.: REVENUE SHARE BY SEGMENT, 2021 (%)
- FIGURE 60. CORSAIR GAMING, INC.: REVENUE SHARE BY REGION, 2021 (%)
- FIGURE 61. HP INC.: RESEARCH & DEVELOPMENT EXPENDITURE, 2019-2021 ($MILLION)
- FIGURE 62. HP INC.: NET REVENUE, 2019-2021 ($MILLION)
- FIGURE 63. HP INC.: REVENUE SHARE BY REGION, 2021 (%)
- FIGURE 64. HP INC.: REVENUE SHARE BY SEGMENT, 2021 (%)
- FIGURE 65. LENOVO GROUP LIMITED: NET REVENUE, 2019-2021 ($MILLION)
- FIGURE 66. LENOVO GROUP LIMITED: RESEARCH & DEVELOPMENT EXPENDITURE, 2019-2021 ($MILLION)
- FIGURE 67. LENOVO GROUP LIMITED: REVENUE SHARE BY SEGMENT, 2021 (%)
- FIGURE 68. LENOVO GROUP LIMITED: REVENUE SHARE BY REGION, 2022 (%)
- FIGURE 69. LOGITECH INTERNATIONAL S.A.: NET SALES, 2019-2021 ($MILLION)
- FIGURE 70. LOGITECH INTERNATIONAL S.A.: RESEARCH & DEVELOPMENT EXPENDITURE, 2019-2021
- FIGURE 71. LOGITECH INTERNATIONAL S.A.: REVENUE SHARE BY REGION, 2021 (%)
- FIGURE 72. TURTLE BEACH CORPORATION: NET REVENUE, 2019-2021 ($MILLION)
- FIGURE 73. TURTLE BEACH CORPORATION: RESEARCH & DEVELOPMENT EXPENDITURE, 2019-2021
- FIGURE 74. TURTLE BEACH CORPORATION: REVENUE SHARE BY REGION, 2021 (%)
The gaming keyboard market size was valued at $2,373.9 million in 2021 and is projected to reach $6,349.2 million by 2031, growing at a CAGR of 13.0% from 2022 to 2031.
Gaming has increased in popularity as a source of entertainment and a means to relieve tension and fatigue during the last several decades. Many people all around the world are ready to purchase PC games, as well as related equipment and accessories, to increase their immersion and enjoy the best gaming experience possible. Consumer access to gaming accessories was severely constrained a few years ago due to the fact that gaming devices were only available through specialized retail formats and there was a requirement mismatch, particularly in developing countries. Some conventional computer and electrical goods businesses have begun providing gaming equipment and accessories to broaden their consumer base. Furthermore, as the internet extended throughout the world, the use of online channels for selling gaming-related things increased significantly. Customers now have easier access to gaming equipment and accessories such as gaming keyboards. This led to an increase in user purchases of gaming keyboards and mice, leading to market expansion. The growing availability of gaming keyboards via various distribution channels has resulted in market growth.
Gaming devices and peripherals are highly specialized pieces of equipment that require complex hardware, software, and drivers to work properly. Market competitors are aiming to provide high-quality gaming keyboards with maximum performance to customers while also including several features to provide an amazing gaming experience. The inclusion of extra features, on the other hand, tends to boost the product's production costs, which leads to an increase in the product's ultimate selling price. Due to the unpredictability of their playtime durations and preferences, consumers in developing nations who play video games for leisure may be hesitant to invest substantial amounts of funds in expensive gaming equipment. Furthermore, in places where there are no participants in the gaming keyboard industry, gaming keyboards must be imported from other parts of the world, raising the product's price even further. The price increase is impeding the market's expansion.
The gaming keyboard market is analyzed on the basis of product type, price point, distribution channel, and region. By product type, the market is classified into mechanical and membrane. By price point, the market is categorized into low-priced, medium-priced, and high-priced. By distribution channel, the market is segmented into supermarkets/hypermarkets, specialty stores, e-commerce, and independent retail stores. Region-wise, the market is analyzed across North America (the U.S., Canada, and Mexico), Europe (UK, Germany, France, Russia, Italy, Spain, Russia, and the rest of Europe), Asia-Pacific (China, Japan, India, South Korea, Australia, and rest of Asia-Pacific), and LAMEA (Brazil, South Africa, Saudi Arabia, Argentina, and rest of LAMEA).
Players operating in the global gaming keyboard market have adopted various developmental strategies to expand their gaming keyboard share, increase profitability, and remain competitive in the market. Key players profiled in this report include Ant Esports, ASUSTeK Computer Inc, Bloody, Corsair Gaming, Inc., Eastern Times Technology Co., Ltd, HP Inc., Lenovo Group Limited, Logitech International S.A., Mad Catz Global Limited, Mionix, Razer, Inc, Roccat GmbH, Sharkoon Technologies GmbH, Shenzhen Rapoo Technology Co., LTD, and SteelSeries.
Key Benefits For Stakeholders
- This report provides a quantitative analysis of the market segments, current trends, estimations, and dynamics of the gaming keyboard market analysis from 2021 to 2031 to identify the prevailing gaming keyboard market opportunities.
- The market research is offered along with information related to key drivers, restraints, and opportunities.
- Porter's five forces analysis highlights the potency of buyers and suppliers to enable stakeholders make profit-oriented business decisions and strengthen their supplier-buyer network.
- In-depth analysis of the gaming keyboard market segmentation assists to determine the prevailing market opportunities.
- Major countries in each region are mapped according to their revenue contribution to the global market.
- Market player positioning facilitates benchmarking and provides a clear understanding of the present position of the market players.
- The report includes the analysis of the regional as well as global gaming keyboard market trends, key players, market segments, application areas, and market growth strategies.
Key Market Segments
By Product Type
- Mechanical
- Sub-type
- Wired
- Wireless
- Membrane
- Sub-type
- Wired
- Wireless
By Price point
- Low-priced
- Medium-priced
- High-priced
By Distribution Channel
- Supermarkets/hypermarkets
- Specialty Stores
- E-commerce
- Independent Retail Stores
By Region
- North America
- U.S.
- Canada
- Mexico
- Europe
- UK
- Germany
- France
- Russian Federation
- Italy
- Spain
- Rest of Europe
- Asia-Pacific
- China
- Japan
- India
- South Korea
- Australia
- Rest of Asia-Pacific
- LAMEA
- Brazil
- South Africa,
- Saudi Arabia
- Argentina
- Rest of LAMEA
Key Market Players:
- Mionix
- Razer Inc.
- SteelSeries ApS
- Mad Catz Global Limited
- Shenzhen Rapoo Technology Co., LTD
- AsusTek Computer Inc.
- HP Inc.
- Lenovo Group Limited
- Logitech International S.A.
- Bloody
- Eastern Times Technology Co., ltd
- Turtle Beach Corporation
- Ant Esports
- Corsair Gaming, Inc.
- Sharkoon Technologies GmbH
TABLE OF CONTENTS
CHAPTER 1: INTRODUCTION
- 1.1. Report description
- 1.2. Key market segments
- 1.3. Key benefits to the stakeholders
- 1.4. Research Methodology
- 1.4.1. Primary research
- 1.4.2. Secondary research
- 1.4.3. Analyst tools and models
CHAPTER 2: EXECUTIVE SUMMARY
- 2.1. CXO Perspective
CHAPTER 3: MARKET OVERVIEW
- 3.1. Market definition and scope
- 3.2. Key findings
- 3.2.1. Top impacting factors
- 3.2.2. Top investment pockets
- 3.3. Porter's five forces analysis
- 3.3.1. Bargaining power of suppliers
- 3.3.2. Bargaining power of buyers
- 3.3.3. Threat of substitutes
- 3.3.4. Threat of new entrants
- 3.3.5. Intensity of rivalry
- 3.4. Market dynamics
- 3.4.1. Drivers
- 3.4.1.1. Growth of Esports Industry
- 3.4.1.2. Improvement of the distribution channel
- 3.4.1. Drivers
- 3.4.2. Restraints
- 3.4.2.1. High prices of gaming keyboard
- 3.4.2.2. Availability of counterfeit products
- 3.4.3. Opportunities
- 3.4.3.1. Increase in government initiatives boosts the gaming industry
- 3.5. COVID-19 Impact Analysis on the market
- 3.6. Market Share Analysis
- 3.7. Parent Market Analysis
- 3.8. Pricing Analysis
- 3.9. Value Chain Analysis
CHAPTER 4: GAMING KEYBOARD MARKET, BY PRODUCT TYPE
- 4.1. Overview
- 4.1.1. Market size and forecast
- 4.2. Mechanical
- 4.2.1. Key market trends, growth factors and opportunities
- 4.2.2. Market size and forecast, by region
- 4.2.3. Market share analysis by country
- 4.2.4. Mechanical Gaming Keyboard Market by Sub-type
- 4.2.4.1. Wired Market size and forecast, by region
- 4.2.4.2. Wireless Market size and forecast, by region
- 4.3. Membrane
- 4.3.1. Key market trends, growth factors and opportunities
- 4.3.2. Market size and forecast, by region
- 4.3.3. Market share analysis by country
- 4.3.4. Membrane Gaming Keyboard Market by Sub-type
- 4.3.4.1. Wired Market size and forecast, by region
- 4.3.4.2. Wireless Market size and forecast, by region
CHAPTER 5: GAMING KEYBOARD MARKET, BY PRICE POINT
- 5.1. Overview
- 5.1.1. Market size and forecast
- 5.2. Low-priced
- 5.2.1. Key market trends, growth factors and opportunities
- 5.2.2. Market size and forecast, by region
- 5.2.3. Market share analysis by country
- 5.3. Medium-priced
- 5.3.1. Key market trends, growth factors and opportunities
- 5.3.2. Market size and forecast, by region
- 5.3.3. Market share analysis by country
- 5.4. High-priced
- 5.4.1. Key market trends, growth factors and opportunities
- 5.4.2. Market size and forecast, by region
- 5.4.3. Market share analysis by country
CHAPTER 6: GAMING KEYBOARD MARKET, BY DISTRIBUTION CHANNEL
- 6.1. Overview
- 6.1.1. Market size and forecast
- 6.2. Supermarkets/hypermarkets
- 6.2.1. Key market trends, growth factors and opportunities
- 6.2.2. Market size and forecast, by region
- 6.2.3. Market share analysis by country
- 6.3. Specialty Stores
- 6.3.1. Key market trends, growth factors and opportunities
- 6.3.2. Market size and forecast, by region
- 6.3.3. Market share analysis by country
- 6.4. E-commerce
- 6.4.1. Key market trends, growth factors and opportunities
- 6.4.2. Market size and forecast, by region
- 6.4.3. Market share analysis by country
- 6.5. Independent Retail Stores
- 6.5.1. Key market trends, growth factors and opportunities
- 6.5.2. Market size and forecast, by region
- 6.5.3. Market share analysis by country
CHAPTER 7: GAMING KEYBOARD MARKET, BY REGION
- 7.1. Overview
- 7.1.1. Market size and forecast By Region
- 7.2. North America
- 7.2.1. Key trends and opportunities
- 7.2.2. Market size and forecast, by Product Type
- 7.2.2.1. North America Mechanical Gaming Keyboard Market by Sub-type
- 7.2.2.2. North America Membrane Gaming Keyboard Market by Sub-type
- 7.2.3. Market size and forecast, by Price point
- 7.2.4. Market size and forecast, by Distribution Channel
- 7.2.5. Market size and forecast, by country
- 7.2.5.1. U.S.
- 7.2.5.1.1. Key market trends, growth factors and opportunities
- 7.2.5.1.2. Market size and forecast, by Product Type
- 7.2.5.1.3. Market size and forecast, by Price point
- 7.2.5.1.4. Market size and forecast, by Distribution Channel
- 7.2.5.2. Canada
- 7.2.5.2.1. Key market trends, growth factors and opportunities
- 7.2.5.2.2. Market size and forecast, by Product Type
- 7.2.5.2.3. Market size and forecast, by Price point
- 7.2.5.2.4. Market size and forecast, by Distribution Channel
- 7.2.5.3. Mexico
- 7.2.5.3.1. Key market trends, growth factors and opportunities
- 7.2.5.3.2. Market size and forecast, by Product Type
- 7.2.5.3.3. Market size and forecast, by Price point
- 7.2.5.3.4. Market size and forecast, by Distribution Channel
- 7.3. Europe
- 7.3.1. Key trends and opportunities
- 7.3.2. Market size and forecast, by Product Type
- 7.3.2.1. Europe Mechanical Gaming Keyboard Market by Sub-type
- 7.3.2.2. Europe Membrane Gaming Keyboard Market by Sub-type
- 7.3.3. Market size and forecast, by Price point
- 7.3.4. Market size and forecast, by Distribution Channel
- 7.3.5. Market size and forecast, by country
- 7.3.5.1. UK
- 7.3.5.1.1. Key market trends, growth factors and opportunities
- 7.3.5.1.2. Market size and forecast, by Product Type
- 7.3.5.1.3. Market size and forecast, by Price point
- 7.3.5.1.4. Market size and forecast, by Distribution Channel
- 7.3.5.2. Germany
- 7.3.5.2.1. Key market trends, growth factors and opportunities
- 7.3.5.2.2. Market size and forecast, by Product Type
- 7.3.5.2.3. Market size and forecast, by Price point
- 7.3.5.2.4. Market size and forecast, by Distribution Channel
- 7.3.5.3. France
- 7.3.5.3.1. Key market trends, growth factors and opportunities
- 7.3.5.3.2. Market size and forecast, by Product Type
- 7.3.5.3.3. Market size and forecast, by Price point
- 7.3.5.3.4. Market size and forecast, by Distribution Channel
- 7.3.5.4. Russian Federation
- 7.3.5.4.1. Key market trends, growth factors and opportunities
- 7.3.5.4.2. Market size and forecast, by Product Type
- 7.3.5.4.3. Market size and forecast, by Price point
- 7.3.5.4.4. Market size and forecast, by Distribution Channel
- 7.3.5.5. Italy
- 7.3.5.5.1. Key market trends, growth factors and opportunities
- 7.3.5.5.2. Market size and forecast, by Product Type
- 7.3.5.5.3. Market size and forecast, by Price point
- 7.3.5.5.4. Market size and forecast, by Distribution Channel
- 7.3.5.6. Spain
- 7.3.5.6.1. Key market trends, growth factors and opportunities
- 7.3.5.6.2. Market size and forecast, by Product Type
- 7.3.5.6.3. Market size and forecast, by Price point
- 7.3.5.6.4. Market size and forecast, by Distribution Channel
- 7.3.5.7. Rest of Europe
- 7.3.5.7.1. Key market trends, growth factors and opportunities
- 7.3.5.7.2. Market size and forecast, by Product Type
- 7.3.5.7.3. Market size and forecast, by Price point
- 7.3.5.7.4. Market size and forecast, by Distribution Channel
- 7.4. Asia-Pacific
- 7.4.1. Key trends and opportunities
- 7.4.2. Market size and forecast, by Product Type
- 7.4.2.1. Asia-Pacific Mechanical Gaming Keyboard Market by Sub-type
- 7.4.2.2. Asia-Pacific Membrane Gaming Keyboard Market by Sub-type
- 7.4.3. Market size and forecast, by Price point
- 7.4.4. Market size and forecast, by Distribution Channel
- 7.4.5. Market size and forecast, by country
- 7.4.5.1. China
- 7.4.5.1.1. Key market trends, growth factors and opportunities
- 7.4.5.1.2. Market size and forecast, by Product Type
- 7.4.5.1.3. Market size and forecast, by Price point
- 7.4.5.1.4. Market size and forecast, by Distribution Channel
- 7.4.5.2. Japan
- 7.4.5.2.1. Key market trends, growth factors and opportunities
- 7.4.5.2.2. Market size and forecast, by Product Type
- 7.4.5.2.3. Market size and forecast, by Price point
- 7.4.5.2.4. Market size and forecast, by Distribution Channel
- 7.4.5.3. India
- 7.4.5.3.1. Key market trends, growth factors and opportunities
- 7.4.5.3.2. Market size and forecast, by Product Type
- 7.4.5.3.3. Market size and forecast, by Price point
- 7.4.5.3.4. Market size and forecast, by Distribution Channel
- 7.4.5.4. South Korea
- 7.4.5.4.1. Key market trends, growth factors and opportunities
- 7.4.5.4.2. Market size and forecast, by Product Type
- 7.4.5.4.3. Market size and forecast, by Price point
- 7.4.5.4.4. Market size and forecast, by Distribution Channel
- 7.4.5.5. Australia
- 7.4.5.5.1. Key market trends, growth factors and opportunities
- 7.4.5.5.2. Market size and forecast, by Product Type
- 7.4.5.5.3. Market size and forecast, by Price point
- 7.4.5.5.4. Market size and forecast, by Distribution Channel
- 7.4.5.6. Rest of Asia-Pacific
- 7.4.5.6.1. Key market trends, growth factors and opportunities
- 7.4.5.6.2. Market size and forecast, by Product Type
- 7.4.5.6.3. Market size and forecast, by Price point
- 7.4.5.6.4. Market size and forecast, by Distribution Channel
- 7.5. LAMEA
- 7.5.1. Key trends and opportunities
- 7.5.2. Market size and forecast, by Product Type
- 7.5.2.1. LAMEA Mechanical Gaming Keyboard Market by Sub-type
- 7.5.2.2. LAMEA Membrane Gaming Keyboard Market by Sub-type
- 7.5.3. Market size and forecast, by Price point
- 7.5.4. Market size and forecast, by Distribution Channel
- 7.5.5. Market size and forecast, by country
- 7.5.5.1. Brazil
- 7.5.5.1.1. Key market trends, growth factors and opportunities
- 7.5.5.1.2. Market size and forecast, by Product Type
- 7.5.5.1.3. Market size and forecast, by Price point
- 7.5.5.1.4. Market size and forecast, by Distribution Channel
- 7.5.5.2. South Africa,
- 7.5.5.2.1. Key market trends, growth factors and opportunities
- 7.5.5.2.2. Market size and forecast, by Product Type
- 7.5.5.2.3. Market size and forecast, by Price point
- 7.5.5.2.4. Market size and forecast, by Distribution Channel
- 7.5.5.3. Saudi Arabia
- 7.5.5.3.1. Key market trends, growth factors and opportunities
- 7.5.5.3.2. Market size and forecast, by Product Type
- 7.5.5.3.3. Market size and forecast, by Price point
- 7.5.5.3.4. Market size and forecast, by Distribution Channel
- 7.5.5.4. Argentina
- 7.5.5.4.1. Key market trends, growth factors and opportunities
- 7.5.5.4.2. Market size and forecast, by Product Type
- 7.5.5.4.3. Market size and forecast, by Price point
- 7.5.5.4.4. Market size and forecast, by Distribution Channel
- 7.5.5.5. Rest of LAMEA
- 7.5.5.5.1. Key market trends, growth factors and opportunities
- 7.5.5.5.2. Market size and forecast, by Product Type
- 7.5.5.5.3. Market size and forecast, by Price point
- 7.5.5.5.4. Market size and forecast, by Distribution Channel
CHAPTER 8: COMPETITIVE LANDSCAPE
- 8.1. Introduction
- 8.2. Top winning strategies
- 8.3. Product Mapping of Top 10 Player
- 8.4. Competitive Dashboard
- 8.5. Competitive Heatmap
- 8.6. Top player positioning, 2021
CHAPTER 9: COMPANY PROFILES
- 9.1. Ant Esports
- 9.1.1. Company overview
- 9.1.2. Key Executives
- 9.1.3. Company snapshot
- 9.1.4. Operating business segments
- 9.1.5. Product portfolio
- 9.2. AsusTek Computer Inc.
- 9.2.1. Company overview
- 9.2.2. Key Executives
- 9.2.3. Company snapshot
- 9.2.4. Operating business segments
- 9.2.5. Product portfolio
- 9.2.6. Business performance
- 9.2.7. Key strategic moves and developments
- 9.3. Bloody
- 9.3.1. Company overview
- 9.3.2. Key Executives
- 9.3.3. Company snapshot
- 9.3.4. Operating business segments
- 9.3.5. Product portfolio
- 9.4. Corsair Gaming, Inc.
- 9.4.1. Company overview
- 9.4.2. Key Executives
- 9.4.3. Company snapshot
- 9.4.4. Operating business segments
- 9.4.5. Product portfolio
- 9.4.6. Business performance
- 9.4.7. Key strategic moves and developments
- 9.5. HP Inc.
- 9.5.1. Company overview
- 9.5.2. Key Executives
- 9.5.3. Company snapshot
- 9.5.4. Operating business segments
- 9.5.5. Product portfolio
- 9.5.6. Business performance
- 9.5.7. Key strategic moves and developments
- 9.6. Lenovo Group Limited
- 9.6.1. Company overview
- 9.6.2. Key Executives
- 9.6.3. Company snapshot
- 9.6.4. Operating business segments
- 9.6.5. Product portfolio
- 9.6.6. Business performance
- 9.7. Logitech International S.A.
- 9.7.1. Company overview
- 9.7.2. Key Executives
- 9.7.3. Company snapshot
- 9.7.4. Operating business segments
- 9.7.5. Product portfolio
- 9.7.6. Business performance
- 9.7.7. Key strategic moves and developments
- 9.8. Mad Catz Global Limited
- 9.8.1. Company overview
- 9.8.2. Key Executives
- 9.8.3. Company snapshot
- 9.8.4. Operating business segments
- 9.8.5. Product portfolio
- 9.8.6. Key strategic moves and developments
- 9.9. Mionix
- 9.9.1. Company overview
- 9.9.2. Key Executives
- 9.9.3. Company snapshot
- 9.9.4. Operating business segments
- 9.9.5. Product portfolio
- 9.10. Razer Inc.
- 9.10.1. Company overview
- 9.10.2. Key Executives
- 9.10.3. Company snapshot
- 9.10.4. Operating business segments
- 9.10.5. Product portfolio
- 9.10.6. Key strategic moves and developments
- 9.11. Sharkoon Technologies GmbH
- 9.11.1. Company overview
- 9.11.2. Key Executives
- 9.11.3. Company snapshot
- 9.11.4. Operating business segments
- 9.11.5. Product portfolio
- 9.12. Shenzhen Rapoo Technology Co., LTD
- 9.12.1. Company overview
- 9.12.2. Key Executives
- 9.12.3. Company snapshot
- 9.12.4. Operating business segments
- 9.12.5. Product portfolio
- 9.13. SteelSeries ApS
- 9.13.1. Company overview
- 9.13.2. Key Executives
- 9.13.3. Company snapshot
- 9.13.4. Operating business segments
- 9.13.5. Product portfolio
- 9.14. Eastern Times Technology Co., ltd
- 9.14.1. Company overview
- 9.14.2. Key Executives
- 9.14.3. Company snapshot
- 9.14.4. Operating business segments
- 9.14.5. Product portfolio
- 9.15. Turtle Beach Corporation
- 9.15.1. Company overview
- 9.15.2. Key Executives
- 9.15.3. Company snapshot
- 9.15.4. Operating business segments
- 9.15.5. Product portfolio
- 9.15.6. Business performance
- 9.15.7. Key strategic moves and developments