 |
市場調査レポート
商品コード
1298256
ラピッドプロトタイピング市場:材料別、技術別、エンドユーザー産業別:世界の機会分析と産業予測、2021-2031年Rapid Prototyping Market By Material, By Technology (Stereolithography, Selective Laser Sintering, Digital Light Processing, Fused Deposition Modeling, Others), By End User Industry : Global Opportunity Analysis and Industry Forecast, 2021-2031 |
||||||

| ラピッドプロトタイピング市場:材料別、技術別、エンドユーザー産業別:世界の機会分析と産業予測、2021-2031年 |
|
出版日: 2023年03月01日
発行: Allied Market Research
ページ情報: 英文 321 Pages
納期: 2~3営業日
|
- 全表示
- 概要
- 図表
- 目次
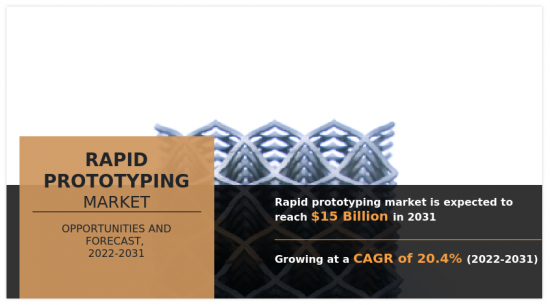
ラピッドプロトタイピング市場規模は、2021年に24億米ドルと評価され、2031年にはCAGR 20.4%を記録して149億米ドルに達すると予測されています。
ラピッドプロトタイピングは、3次元コンピュータ支援設計(CAD)を使用して物理的な部品、モデル、アセンブリを迅速に製作する方法です。ラピッドプロトタイピングは、製品開発プロセスにおけるテストや検証のための製品シミュレーションを作成するもので、ユーザーからのフィードバックや分析に基づいて短期間に何度も繰り返し作成されます。部品、モデル、またはアセンブリの作成は、一般的に3Dプリンティングとして知られる積層造形法を用いて完成させるのが普通です。しかし、ラピッドプロトタイピングに使用される他の技術には、高速機械加工、鋳造、成形、押し出し成形などがあります。
調査範囲では、主要企業がラピッドプロトタイピング市場に参入する潜在的な機会について論じています。さらに、市場の詳細な分析を行い、現在の動向、主要な促進要因、主要な投資分野について概説しています。また、ポーターのファイブフォース分析により、業界の競合シナリオとバリューチェーンにおける各利害関係者の役割を理解しています。さらに、主要市場プレーヤーが市場での足場を維持するために採用した戦略についても特集しています。
目次
第1章 イントロダクション
第2章 エグゼクティブサマリー
第3章 市場概要
- 市場の定義と範囲
- 主な調査結果
- 影響要因
- 主な投資機会
- ポーターのファイブフォース分析
- 供給企業の交渉力
- 買い手の交渉力
- 代替品の脅威
- 新規参入業者の脅威
- 競合の激しさ
- 市場力学
- 促進要因
- 競争優位性を得るための製品のカスタマイズ需要の高まり
- プロトタイピングのための複数材料の採用急増
- 阻害要因
- ラピッドプロトタイピングに関連する高コストと熟練した専門家の必要性
- 機会
- デジタル製造におけるラピッドプロトタイピングの採用が増加し、ラピッドプロトタイピング市場の進歩が増大
- 促進要因
- COVID-19:市場への影響分析
第4章 ラピッドプロトタイピング市場:材料別
- 概要
- 市場規模と予測
- 熱可塑性プラスチック
- 主な市場動向、成長要因、機会
- 市場規模・予測:地域別
- 市場シェア分析:国別
- 金属と合金
- 主な市場動向、成長要因、機会
- 市場規模・予測:地域別
- 市場シェア分析:国別
- セラミックス
- 主要市場動向、成長要因、機会
- 市場規模・予測:地域別
- 市場シェア分析:国別
- その他
- 主な市場動向、成長要因、機会
- 市場規模・予測:地域別
- 市場シェア分析:国別
第5章 ラピッドプロトタイピング市場:技術別
- 概要
- 市場規模と予測
- ステレオリソグラフィー(SLA)
- 主な市場動向、成長要因、機会
- 市場規模・予測:地域別
- 市場シェア分析:国別
- 選択的レーザー焼結(SLS)
- 主な市場動向、成長要因、機会
- 市場規模・予測:地域別
- 市場シェア分析:国別
- デジタル・ライト・プロセッシング(DLP)
- 主な市場動向、成長要因、機会
- 市場規模・予測:地域別
- 市場シェア分析:国別
- 溶融堆積モデリング(FDM)
- 主な市場動向、成長要因、機会
- 市場規模・予測:地域別
- 市場シェア分析:国別
- その他
- 主な市場動向、成長要因、機会
- 市場規模・予測:地域別
- 市場シェア分析:国別
第6章 ラピッドプロトタイピング市場:エンドユーザー産業別
- 概要
- 市場規模と予測
- 航空宇宙・防衛
- 主要市場動向、成長要因、機会
- 市場規模・予測:地域別
- 市場シェア分析:国別
- ヘルスケア
- 主要市場動向、成長要因、機会
- 市場規模・予測:地域別
- 市場シェア分析:国別
- 製造業と建設業
- 主な市場動向、成長要因、機会
- 市場規模・予測:地域別
- 市場シェア分析:国別
- 消費財・エレクトロニクス
- 主な市場動向、成長要因、機会
- 市場規模・予測:地域別
- 市場シェア分析:国別
- その他
- 主要市場動向、成長要因、機会
- 市場規模・予測:地域別
- 市場シェア分析:国別
第7章 ラピッドプロトタイピング市場:地域別
- 概要
- 市場規模・予測:地域別
- 北米
- 主要動向と機会
- 市場規模・予測:材料別
- 市場規模・予測:技術別
- 市場規模・予測:エンドユーザー産業別
- 市場規模・予測:国別
- 米国
- 主要市場動向、成長要因、機会
- 市場規模・予測:材料別
- 市場規模・予測:技術別
- 市場規模・予測:エンドユーザー産業別
- カナダ
- 主要市場動向、成長要因、機会
- 市場規模・予測:材料別
- 市場規模・予測:技術別
- 市場規模・予測:エンドユーザー産業別
- メキシコ
- 主要市場動向、成長要因、機会
- 市場規模・予測:材料別
- 市場規模・予測:技術別
- 市場規模・予測:エンドユーザー産業別
- 欧州
- 主要動向と機会
- 市場規模・予測:材料別
- 市場規模・予測:技術別
- 市場規模・予測:エンドユーザー産業別
- 市場規模・予測:国別
- 英国
- 主要市場動向、成長要因、機会
- 市場規模・予測:材料別
- 市場規模・予測:技術別
- 市場規模・予測:エンドユーザー産業別
- ドイツ
- 主要市場動向、成長要因、機会
- 市場規模・予測:材料別
- 市場規模・予測:技術別
- 市場規模・予測:エンドユーザー産業別
- フランス
- 主要市場動向、成長要因、機会
- 市場規模・予測:材料別
- 市場規模・予測:技術別
- 市場規模・予測:エンドユーザー産業別
- その他欧州
- 主要市場動向、成長要因、機会
- 市場規模・予測:材料別
- 市場規模・予測:技術別
- 市場規模・予測:エンドユーザー産業別
- アジア太平洋地域
- 主要動向と機会
- 市場規模・予測:材料別
- 市場規模・予測:技術別
- 市場規模・予測:エンドユーザー産業別
- 市場規模・予測:国別
- 中国
- 主要市場動向、成長要因、機会
- 市場規模・予測:材料別
- 市場規模・予測:技術別
- 市場規模・予測:エンドユーザー産業別
- 日本
- 主要市場動向、成長要因、機会
- 市場規模・予測:材料別
- 市場規模・予測:技術別
- 市場規模・予測:エンドユーザー産業別
- インド
- 主要市場動向、成長要因、機会
- 市場規模・予測:材料別
- 市場規模・予測:技術別
- 市場規模・予測:エンドユーザー産業別
- オーストラリア
- 主要市場動向、成長要因、機会
- 市場規模・予測:材料別
- 市場規模・予測:技術別
- 市場規模・予測:エンドユーザー産業別
- その他アジア太平洋地域
- 主要市場動向、成長要因、機会
- 市場規模・予測:材料別
- 市場規模・予測:技術別
- 市場規模・予測:エンドユーザー産業別
- ラテンアメリカ・中東・アフリカ
- 主要動向と機会
- 市場規模・予測:材料別
- 市場規模・予測:技術別
- 市場規模・予測:エンドユーザー産業別
- 市場規模・予測:国別
- ラテンアメリカ
- 主要市場動向、成長要因、機会
- 市場規模・予測:材料別
- 市場規模・予測:技術別
- 市場規模・予測:エンドユーザー産業別
- 中東
- 主要市場動向、成長要因、機会
- 市場規模・予測:材料別
- 市場規模・予測:技術別
- 市場規模・予測:エンドユーザー産業別
- アフリカ
- 主要市場動向、成長要因、機会
- 市場規模・予測:材料別
- 市場規模・予測:技術別
- 市場規模・予測:エンドユーザー産業別
第8章 競合情勢
- イントロダクション
- 主要成功戦略
- 主要10社の製品マッピング
- 競合ダッシュボード
- 競合ヒートマップ
- トップ企業のポジショニング(2021年
第9章 企業プロファイル
- 3D Systems, Inc.
- 3DFortify, Inc.
- Arcam AB(General Electric)
- Carbon 3D
- Desktop Metal, Inc.
- ExOne Company
- Hoganas AB
- Markforged
- Optomec, Inc.
- Stratasys, Ltd.
LIST OF TABLES
- TABLE 01. GLOBAL RAPID PROTOTYPING MARKET, BY MATERIAL, 2021-2031 ($MILLION)
- TABLE 02. RAPID PROTOTYPING MARKET FOR THERMOPLASTICS, BY REGION, 2021-2031 ($MILLION)
- TABLE 03. RAPID PROTOTYPING MARKET FOR METALS AND ALLOYS, BY REGION, 2021-2031 ($MILLION)
- TABLE 04. RAPID PROTOTYPING MARKET FOR CERAMICS, BY REGION, 2021-2031 ($MILLION)
- TABLE 05. RAPID PROTOTYPING MARKET FOR OTHERS, BY REGION, 2021-2031 ($MILLION)
- TABLE 06. GLOBAL RAPID PROTOTYPING MARKET, BY TECHNOLOGY, 2021-2031 ($MILLION)
- TABLE 07. RAPID PROTOTYPING MARKET FOR STEREOLITHOGRAPHY (SLA), BY REGION, 2021-2031 ($MILLION)
- TABLE 08. RAPID PROTOTYPING MARKET FOR SELECTIVE LASER SINTERING (SLS), BY REGION, 2021-2031 ($MILLION)
- TABLE 09. RAPID PROTOTYPING MARKET FOR DIGITAL LIGHT PROCESSING (DLP), BY REGION, 2021-2031 ($MILLION)
- TABLE 10. RAPID PROTOTYPING MARKET FOR FUSED DEPOSITION MODELING (FDM), BY REGION, 2021-2031 ($MILLION)
- TABLE 11. RAPID PROTOTYPING MARKET FOR OTHERS, BY REGION, 2021-2031 ($MILLION)
- TABLE 12. GLOBAL RAPID PROTOTYPING MARKET, BY END USER INDUSTRY, 2021-2031 ($MILLION)
- TABLE 13. RAPID PROTOTYPING MARKET FOR AEROSPACE AND DEFENSE, BY REGION, 2021-2031 ($MILLION)
- TABLE 14. RAPID PROTOTYPING MARKET FOR HEALTHCARE, BY REGION, 2021-2031 ($MILLION)
- TABLE 15. RAPID PROTOTYPING MARKET FOR MANUFACTURING AND CONSTRUCTION, BY REGION, 2021-2031 ($MILLION)
- TABLE 16. RAPID PROTOTYPING MARKET FOR CONSUMER GOODS AND ELECTRONICS, BY REGION, 2021-2031 ($MILLION)
- TABLE 17. RAPID PROTOTYPING MARKET FOR OTHERS, BY REGION, 2021-2031 ($MILLION)
- TABLE 18. RAPID PROTOTYPING MARKET, BY REGION, 2021-2031 ($MILLION)
- TABLE 19. NORTH AMERICA RAPID PROTOTYPING MARKET, BY MATERIAL, 2021-2031 ($MILLION)
- TABLE 20. NORTH AMERICA RAPID PROTOTYPING MARKET, BY TECHNOLOGY, 2021-2031 ($MILLION)
- TABLE 21. NORTH AMERICA RAPID PROTOTYPING MARKET, BY END USER INDUSTRY, 2021-2031 ($MILLION)
- TABLE 22. NORTH AMERICA RAPID PROTOTYPING MARKET, BY COUNTRY, 2021-2031 ($MILLION)
- TABLE 23. U.S. RAPID PROTOTYPING MARKET, BY MATERIAL, 2021-2031 ($MILLION)
- TABLE 24. U.S. RAPID PROTOTYPING MARKET, BY TECHNOLOGY, 2021-2031 ($MILLION)
- TABLE 25. U.S. RAPID PROTOTYPING MARKET, BY END USER INDUSTRY, 2021-2031 ($MILLION)
- TABLE 26. CANADA RAPID PROTOTYPING MARKET, BY MATERIAL, 2021-2031 ($MILLION)
- TABLE 27. CANADA RAPID PROTOTYPING MARKET, BY TECHNOLOGY, 2021-2031 ($MILLION)
- TABLE 28. CANADA RAPID PROTOTYPING MARKET, BY END USER INDUSTRY, 2021-2031 ($MILLION)
- TABLE 29. MEXICO RAPID PROTOTYPING MARKET, BY MATERIAL, 2021-2031 ($MILLION)
- TABLE 30. MEXICO RAPID PROTOTYPING MARKET, BY TECHNOLOGY, 2021-2031 ($MILLION)
- TABLE 31. MEXICO RAPID PROTOTYPING MARKET, BY END USER INDUSTRY, 2021-2031 ($MILLION)
- TABLE 32. EUROPE RAPID PROTOTYPING MARKET, BY MATERIAL, 2021-2031 ($MILLION)
- TABLE 33. EUROPE RAPID PROTOTYPING MARKET, BY TECHNOLOGY, 2021-2031 ($MILLION)
- TABLE 34. EUROPE RAPID PROTOTYPING MARKET, BY END USER INDUSTRY, 2021-2031 ($MILLION)
- TABLE 35. EUROPE RAPID PROTOTYPING MARKET, BY COUNTRY, 2021-2031 ($MILLION)
- TABLE 36. UK RAPID PROTOTYPING MARKET, BY MATERIAL, 2021-2031 ($MILLION)
- TABLE 37. UK RAPID PROTOTYPING MARKET, BY TECHNOLOGY, 2021-2031 ($MILLION)
- TABLE 38. UK RAPID PROTOTYPING MARKET, BY END USER INDUSTRY, 2021-2031 ($MILLION)
- TABLE 39. GERMANY RAPID PROTOTYPING MARKET, BY MATERIAL, 2021-2031 ($MILLION)
- TABLE 40. GERMANY RAPID PROTOTYPING MARKET, BY TECHNOLOGY, 2021-2031 ($MILLION)
- TABLE 41. GERMANY RAPID PROTOTYPING MARKET, BY END USER INDUSTRY, 2021-2031 ($MILLION)
- TABLE 42. FRANCE RAPID PROTOTYPING MARKET, BY MATERIAL, 2021-2031 ($MILLION)
- TABLE 43. FRANCE RAPID PROTOTYPING MARKET, BY TECHNOLOGY, 2021-2031 ($MILLION)
- TABLE 44. FRANCE RAPID PROTOTYPING MARKET, BY END USER INDUSTRY, 2021-2031 ($MILLION)
- TABLE 45. REST OF EUROPE RAPID PROTOTYPING MARKET, BY MATERIAL, 2021-2031 ($MILLION)
- TABLE 46. REST OF EUROPE RAPID PROTOTYPING MARKET, BY TECHNOLOGY, 2021-2031 ($MILLION)
- TABLE 47. REST OF EUROPE RAPID PROTOTYPING MARKET, BY END USER INDUSTRY, 2021-2031 ($MILLION)
- TABLE 48. ASIA-PACIFIC RAPID PROTOTYPING MARKET, BY MATERIAL, 2021-2031 ($MILLION)
- TABLE 49. ASIA-PACIFIC RAPID PROTOTYPING MARKET, BY TECHNOLOGY, 2021-2031 ($MILLION)
- TABLE 50. ASIA-PACIFIC RAPID PROTOTYPING MARKET, BY END USER INDUSTRY, 2021-2031 ($MILLION)
- TABLE 51. ASIA-PACIFIC RAPID PROTOTYPING MARKET, BY COUNTRY, 2021-2031 ($MILLION)
- TABLE 52. CHINA RAPID PROTOTYPING MARKET, BY MATERIAL, 2021-2031 ($MILLION)
- TABLE 53. CHINA RAPID PROTOTYPING MARKET, BY TECHNOLOGY, 2021-2031 ($MILLION)
- TABLE 54. CHINA RAPID PROTOTYPING MARKET, BY END USER INDUSTRY, 2021-2031 ($MILLION)
- TABLE 55. JAPAN RAPID PROTOTYPING MARKET, BY MATERIAL, 2021-2031 ($MILLION)
- TABLE 56. JAPAN RAPID PROTOTYPING MARKET, BY TECHNOLOGY, 2021-2031 ($MILLION)
- TABLE 57. JAPAN RAPID PROTOTYPING MARKET, BY END USER INDUSTRY, 2021-2031 ($MILLION)
- TABLE 58. INDIA RAPID PROTOTYPING MARKET, BY MATERIAL, 2021-2031 ($MILLION)
- TABLE 59. INDIA RAPID PROTOTYPING MARKET, BY TECHNOLOGY, 2021-2031 ($MILLION)
- TABLE 60. INDIA RAPID PROTOTYPING MARKET, BY END USER INDUSTRY, 2021-2031 ($MILLION)
- TABLE 61. AUSTRALIA RAPID PROTOTYPING MARKET, BY MATERIAL, 2021-2031 ($MILLION)
- TABLE 62. AUSTRALIA RAPID PROTOTYPING MARKET, BY TECHNOLOGY, 2021-2031 ($MILLION)
- TABLE 63. AUSTRALIA RAPID PROTOTYPING MARKET, BY END USER INDUSTRY, 2021-2031 ($MILLION)
- TABLE 64. REST OF ASIA-PACIFIC RAPID PROTOTYPING MARKET, BY MATERIAL, 2021-2031 ($MILLION)
- TABLE 65. REST OF ASIA-PACIFIC RAPID PROTOTYPING MARKET, BY TECHNOLOGY, 2021-2031 ($MILLION)
- TABLE 66. REST OF ASIA-PACIFIC RAPID PROTOTYPING MARKET, BY END USER INDUSTRY, 2021-2031 ($MILLION)
- TABLE 67. LAMEA RAPID PROTOTYPING MARKET, BY MATERIAL, 2021-2031 ($MILLION)
- TABLE 68. LAMEA RAPID PROTOTYPING MARKET, BY TECHNOLOGY, 2021-2031 ($MILLION)
- TABLE 69. LAMEA RAPID PROTOTYPING MARKET, BY END USER INDUSTRY, 2021-2031 ($MILLION)
- TABLE 70. LAMEA RAPID PROTOTYPING MARKET, BY COUNTRY, 2021-2031 ($MILLION)
- TABLE 71. LATIN AMERICA RAPID PROTOTYPING MARKET, BY MATERIAL, 2021-2031 ($MILLION)
- TABLE 72. LATIN AMERICA RAPID PROTOTYPING MARKET, BY TECHNOLOGY, 2021-2031 ($MILLION)
- TABLE 73. LATIN AMERICA RAPID PROTOTYPING MARKET, BY END USER INDUSTRY, 2021-2031 ($MILLION)
- TABLE 74. MIDDLE EAST RAPID PROTOTYPING MARKET, BY MATERIAL, 2021-2031 ($MILLION)
- TABLE 75. MIDDLE EAST RAPID PROTOTYPING MARKET, BY TECHNOLOGY, 2021-2031 ($MILLION)
- TABLE 76. MIDDLE EAST RAPID PROTOTYPING MARKET, BY END USER INDUSTRY, 2021-2031 ($MILLION)
- TABLE 77. AFRICA RAPID PROTOTYPING MARKET, BY MATERIAL, 2021-2031 ($MILLION)
- TABLE 78. AFRICA RAPID PROTOTYPING MARKET, BY TECHNOLOGY, 2021-2031 ($MILLION)
- TABLE 79. AFRICA RAPID PROTOTYPING MARKET, BY END USER INDUSTRY, 2021-2031 ($MILLION)
- TABLE 80. 3D SYSTEMS, INC.: KEY EXECUTIVES
- TABLE 81. 3D SYSTEMS, INC.: COMPANY SNAPSHOT
- TABLE 82. 3D SYSTEMS, INC.: PRODUCT SEGMENTS
- TABLE 83. 3D SYSTEMS, INC.: PRODUCT PORTFOLIO
- TABLE 84. 3D SYSTEMS, INC.: KEY STRATERGIES
- TABLE 85. 3DFORTIFY, INC.: KEY EXECUTIVES
- TABLE 86. 3DFORTIFY, INC.: COMPANY SNAPSHOT
- TABLE 87. 3DFORTIFY, INC.: PRODUCT SEGMENTS
- TABLE 88. 3DFORTIFY, INC.: PRODUCT PORTFOLIO
- TABLE 89. ARCAM AB (GENERAL ELECTRIC): KEY EXECUTIVES
- TABLE 90. ARCAM AB (GENERAL ELECTRIC): COMPANY SNAPSHOT
- TABLE 91. ARCAM AB (GENERAL ELECTRIC): PRODUCT SEGMENTS
- TABLE 92. ARCAM AB (GENERAL ELECTRIC): PRODUCT PORTFOLIO
- TABLE 93. ARCAM AB (GENERAL ELECTRIC): KEY STRATERGIES
- TABLE 94. CARBON 3D: KEY EXECUTIVES
- TABLE 95. CARBON 3D: COMPANY SNAPSHOT
- TABLE 96. CARBON 3D: PRODUCT SEGMENTS
- TABLE 97. CARBON 3D: PRODUCT PORTFOLIO
- TABLE 98. DESKTOP METAL, INC.: KEY EXECUTIVES
- TABLE 99. DESKTOP METAL, INC.: COMPANY SNAPSHOT
- TABLE 100. DESKTOP METAL, INC.: PRODUCT SEGMENTS
- TABLE 101. DESKTOP METAL, INC.: PRODUCT PORTFOLIO
- TABLE 102. DESKTOP METAL, INC.: KEY STRATERGIES
- TABLE 103. EXONE COMPANY: KEY EXECUTIVES
- TABLE 104. EXONE COMPANY: COMPANY SNAPSHOT
- TABLE 105. EXONE COMPANY: PRODUCT SEGMENTS
- TABLE 106. EXONE COMPANY: PRODUCT PORTFOLIO
- TABLE 107. HOGANAS AB: KEY EXECUTIVES
- TABLE 108. HOGANAS AB: COMPANY SNAPSHOT
- TABLE 109. HOGANAS AB: PRODUCT SEGMENTS
- TABLE 110. HOGANAS AB: PRODUCT PORTFOLIO
- TABLE 111. MARKFORGED: KEY EXECUTIVES
- TABLE 112. MARKFORGED: COMPANY SNAPSHOT
- TABLE 113. MARKFORGED: PRODUCT SEGMENTS
- TABLE 114. MARKFORGED: PRODUCT PORTFOLIO
- TABLE 115. OPTOMEC, INC.: KEY EXECUTIVES
- TABLE 116. OPTOMEC, INC.: COMPANY SNAPSHOT
- TABLE 117. OPTOMEC, INC.: PRODUCT SEGMENTS
- TABLE 118. OPTOMEC, INC.: PRODUCT PORTFOLIO
- TABLE 119. STRATASYS, LTD.: KEY EXECUTIVES
- TABLE 120. STRATASYS, LTD.: COMPANY SNAPSHOT
- TABLE 121. STRATASYS, LTD.: PRODUCT SEGMENTS
- TABLE 122. STRATASYS, LTD.: PRODUCT PORTFOLIO
LIST OF FIGURES
- FIGURE 01. RAPID PROTOTYPING MARKET, 2021-2031
- FIGURE 02. SEGMENTATION OF RAPID PROTOTYPING MARKET, 2021-2031
- FIGURE 03. TOP INVESTMENT POCKETS IN RAPID PROTOTYPING MARKET (2022-2031)
- FIGURE 04. MODERATE BARGAINING POWER OF SUPPLIERS
- FIGURE 05. MODERATE BARGAINING POWER OF BUYERS
- FIGURE 06. LOW THREAT OF SUBSTITUTES
- FIGURE 07. HIGH THREAT OF NEW ENTRANTS
- FIGURE 08. HIGH INTENSITY OF RIVALRY
- FIGURE 09. DRIVERS, RESTRAINTS AND OPPORTUNITIES: GLOBALRAPID PROTOTYPING MARKET
- FIGURE 10. RAPID PROTOTYPING MARKET, BY MATERIAL, 2021(%)
- FIGURE 11. COMPARATIVE SHARE ANALYSIS OF RAPID PROTOTYPING MARKET FOR THERMOPLASTICS, BY COUNTRY 2021-2031(%)
- FIGURE 12. COMPARATIVE SHARE ANALYSIS OF RAPID PROTOTYPING MARKET FOR METALS AND ALLOYS, BY COUNTRY 2021-2031(%)
- FIGURE 13. COMPARATIVE SHARE ANALYSIS OF RAPID PROTOTYPING MARKET FOR CERAMICS, BY COUNTRY 2021-2031(%)
- FIGURE 14. COMPARATIVE SHARE ANALYSIS OF RAPID PROTOTYPING MARKET FOR OTHERS, BY COUNTRY 2021-2031(%)
- FIGURE 15. RAPID PROTOTYPING MARKET, BY TECHNOLOGY, 2021(%)
- FIGURE 16. COMPARATIVE SHARE ANALYSIS OF RAPID PROTOTYPING MARKET FOR STEREOLITHOGRAPHY (SLA), BY COUNTRY 2021-2031(%)
- FIGURE 17. COMPARATIVE SHARE ANALYSIS OF RAPID PROTOTYPING MARKET FOR SELECTIVE LASER SINTERING (SLS), BY COUNTRY 2021-2031(%)
- FIGURE 18. COMPARATIVE SHARE ANALYSIS OF RAPID PROTOTYPING MARKET FOR DIGITAL LIGHT PROCESSING (DLP), BY COUNTRY 2021-2031(%)
- FIGURE 19. COMPARATIVE SHARE ANALYSIS OF RAPID PROTOTYPING MARKET FOR FUSED DEPOSITION MODELING (FDM), BY COUNTRY 2021-2031(%)
- FIGURE 20. COMPARATIVE SHARE ANALYSIS OF RAPID PROTOTYPING MARKET FOR OTHERS, BY COUNTRY 2021-2031(%)
- FIGURE 21. RAPID PROTOTYPING MARKET, BY END USER INDUSTRY, 2021(%)
- FIGURE 22. COMPARATIVE SHARE ANALYSIS OF RAPID PROTOTYPING MARKET FOR AEROSPACE AND DEFENSE, BY COUNTRY 2021-2031(%)
- FIGURE 23. COMPARATIVE SHARE ANALYSIS OF RAPID PROTOTYPING MARKET FOR HEALTHCARE, BY COUNTRY 2021-2031(%)
- FIGURE 24. COMPARATIVE SHARE ANALYSIS OF RAPID PROTOTYPING MARKET FOR MANUFACTURING AND CONSTRUCTION, BY COUNTRY 2021-2031(%)
- FIGURE 25. COMPARATIVE SHARE ANALYSIS OF RAPID PROTOTYPING MARKET FOR CONSUMER GOODS AND ELECTRONICS, BY COUNTRY 2021-2031(%)
- FIGURE 26. COMPARATIVE SHARE ANALYSIS OF RAPID PROTOTYPING MARKET FOR OTHERS, BY COUNTRY 2021-2031(%)
- FIGURE 27. RAPID PROTOTYPING MARKET BY REGION, 2021
- FIGURE 28. U.S. RAPID PROTOTYPING MARKET, 2021-2031 ($MILLION)
- FIGURE 29. CANADA RAPID PROTOTYPING MARKET, 2021-2031 ($MILLION)
- FIGURE 30. MEXICO RAPID PROTOTYPING MARKET, 2021-2031 ($MILLION)
- FIGURE 31. UK RAPID PROTOTYPING MARKET, 2021-2031 ($MILLION)
- FIGURE 32. GERMANY RAPID PROTOTYPING MARKET, 2021-2031 ($MILLION)
- FIGURE 33. FRANCE RAPID PROTOTYPING MARKET, 2021-2031 ($MILLION)
- FIGURE 34. REST OF EUROPE RAPID PROTOTYPING MARKET, 2021-2031 ($MILLION)
- FIGURE 35. CHINA RAPID PROTOTYPING MARKET, 2021-2031 ($MILLION)
- FIGURE 36. JAPAN RAPID PROTOTYPING MARKET, 2021-2031 ($MILLION)
- FIGURE 37. INDIA RAPID PROTOTYPING MARKET, 2021-2031 ($MILLION)
- FIGURE 38. AUSTRALIA RAPID PROTOTYPING MARKET, 2021-2031 ($MILLION)
- FIGURE 39. REST OF ASIA-PACIFIC RAPID PROTOTYPING MARKET, 2021-2031 ($MILLION)
- FIGURE 40. LATIN AMERICA RAPID PROTOTYPING MARKET, 2021-2031 ($MILLION)
- FIGURE 41. MIDDLE EAST RAPID PROTOTYPING MARKET, 2021-2031 ($MILLION)
- FIGURE 42. AFRICA RAPID PROTOTYPING MARKET, 2021-2031 ($MILLION)
- FIGURE 43. TOP WINNING STRATEGIES, BY YEAR
- FIGURE 44. TOP WINNING STRATEGIES, BY DEVELOPMENT
- FIGURE 45. TOP WINNING STRATEGIES, BY COMPANY
- FIGURE 46. PRODUCT MAPPING OF TOP 10 PLAYERS
- FIGURE 47. COMPETITIVE DASHBOARD
- FIGURE 48. COMPETITIVE HEATMAP: RAPID PROTOTYPING MARKET
- FIGURE 49. TOP PLAYER POSITIONING, 2021
- FIGURE 50. 3D SYSTEMS, INC.: NET REVENUE, 2019-2021 ($MILLION)
- FIGURE 51. 3D SYSTEMS, INC.: RESEARCH & DEVELOPMENT EXPENDITURE, 2019-2021 ($MILLION)
- FIGURE 52. 3D SYSTEMS, INC.: REVENUE SHARE BY SEGMENT, 2021 (%)
- FIGURE 53. 3D SYSTEMS, INC.: REVENUE SHARE BY REGION, 2021 (%)
- FIGURE 54. ARCAM AB (GENERAL ELECTRIC): NET REVENUE, 2020-2022 ($MILLION)
- FIGURE 55. ARCAM AB (GENERAL ELECTRIC): RESEARCH & DEVELOPMENT EXPENDITURE, 2020-2022 ($MILLION)
- FIGURE 56. ARCAM AB (GENERAL ELECTRIC): REVENUE SHARE BY SEGMENT, 2022 (%)
- FIGURE 57. ARCAM AB (GENERAL ELECTRIC): REVENUE SHARE BY REGION, 2022 (%)
- FIGURE 58. DESKTOP METAL, INC.: NET REVENUE, 2020-2022 ($MILLION)
- FIGURE 59. DESKTOP METAL, INC.: RESEARCH & DEVELOPMENT EXPENDITURE, 2020-2022 ($MILLION)
- FIGURE 60. DESKTOP METAL, INC.: REVENUE SHARE BY REGION, 2022 (%)
- FIGURE 61. EXONE COMPANY: NET REVENUE, 2020-2022 ($MILLION)
- FIGURE 62. EXONE COMPANY: RESEARCH & DEVELOPMENT EXPENDITURE, 2020-2022 ($MILLION)
- FIGURE 63. EXONE COMPANY: REVENUE SHARE BY REGION, 2022 (%)
- FIGURE 64. MARKFORGED: NET REVENUE, 2020-2022 ($MILLION)
- FIGURE 65. MARKFORGED: RESEARCH & DEVELOPMENT EXPENDITURE, 2020-2022 ($MILLION)
- FIGURE 66. MARKFORGED: REVENUE SHARE BY REGION, 2021 (%)
- FIGURE 67. STRATASYS, LTD.: NET REVENUE, 2020-2022 ($MILLION)
- FIGURE 68. STRATASYS, LTD.: RESEARCH & DEVELOPMENT EXPENDITURE, 2020-2022 ($MILLION)
- FIGURE 69. STRATASYS, LTD.: REVENUE SHARE BY REGION, 2022 (%)
The rapid prototyping market size was valued at $2.4 billion in 2021, and is projected to reach $14.9 billion by 2031, registering a CAGR of 20.4%. Rapid prototyping is a quick way of fabrication of a physical part, model, or assembly using 3D computer aided design (CAD). It creates product simulations for testing and validation during the product development process, with multiple iterations generated during a short period on the basis of user feedback and analysis. The creation of the part, model, or assembly is usually completed using additive manufacturing, more commonly known as 3D printing. However, other technologies used for rapid prototyping include high-speed machining, casting, molding, and extruding.
The scope of the report discusses the potential opportunities for the key players to enter the rapid prototyping market. Furthermore, it provides an in-depth analysis of the market, outlining current trends, key driving factors, and key areas of investment. The report includes Porter's five forces analysis to understand the competitive scenario of the industry and role of each stakeholder in the value chain. Moreover, it features the strategies adopted by key market players to maintain their foothold in the market.
The rapid prototyping market is segmented on the basis of material, technology, end user industry and region. On the basis of material, it is segmented into thermoplastics, metals & alloys, ceramics, and others. By technology, the market is classified into stereolithography (SLA), selective laser sintering (SLS), digital light processing (DLP), fused deposition modeling (FDM), and others. By end-user industry, the market is categorized into aerospace & defense, healthcare, manufacturing & construction, consumer goods & electronics, and others. By region, the market is analyzed across North America, Europe, Asia-Pacific, and LAMEA.
The key factors driving the growth of the rapid prototyping market include the rise in demand for customization of products to gain competitive edge and surge in adoption of multiple materials for prototyping. On the other hand, the high costs related to rapid prototyping, alongwith the requirement for skilled professionals acts as a restraint on the market. Meanwhile, the increase in adoption of rapid prototyping in digital manufacturing is an opportunity during the forecast period.
The key players operating in the rapid prototyping market are: 3D Systems, Inc., 3DFortify, Inc., Arcam AB (General Electric), Carbon 3D, Desktop Metal, Inc., ExOne Company, Hoganas AB, Markforged, Optomec, Inc. and Stratasys, Ltd. These key players adopt several strategies such as new product launch and development, acquisition, partnership and collaboration and business expansion to increase their market share in the global rapid prototyping market during the forecast period.
Key Benefits For Stakeholders
- This report provides a quantitative analysis of the market segments, current trends, estimations, and dynamics of the rapid prototyping market analysis from 2021 to 2031 to identify the prevailing rapid prototyping market opportunities.
- The market research is offered along with information related to key drivers, restraints, and opportunities.
- Porter's five forces analysis highlights the potency of buyers and suppliers to enable stakeholders make profit-oriented business decisions and strengthen their supplier-buyer network.
- In-depth analysis of the rapid prototyping market segmentation assists to determine the prevailing market opportunities.
- Major countries in each region are mapped according to their revenue contribution to the global market.
- Market player positioning facilitates benchmarking and provides a clear understanding of the present position of the market players.
- The report includes the analysis of the regional as well as global rapid prototyping market trends, key players, market segments, application areas, and market growth strategies.
Key Market Segments
By Material
- Thermoplastics
- Metals and Alloys
- Ceramics
- Others
By Technology
- Stereolithography (SLA)
- Selective Laser Sintering (SLS)
- Digital Light Processing (DLP)
- Fused Deposition Modeling (FDM)
- Others
By End User Industry
- Aerospace and Defense
- Healthcare
- Manufacturing and Construction
- Consumer Goods and Electronics
- Others
By Region
- North America
- U.S.
- Canada
- Mexico
- Europe
- UK
- Germany
- France
- Rest of Europe
- Asia-Pacific
- China
- Japan
- India
- Australia
- Rest of Asia-Pacific
- LAMEA
- Latin America
- Middle East
- Africa
Key Market Players:
- Carbon 3D
- Hoganas AB
- Optomec, Inc.
- Markforged
- Desktop Metal, Inc.
- Stratasys, Ltd.
- 3D Systems, Inc.
- 3DFortify, Inc.
- ExOne Company
- Arcam AB (General Electric)
TABLE OF CONTENTS
CHAPTER 1: INTRODUCTION
- 1.1. Report description
- 1.2. Key market segments
- 1.3. Key benefits to the stakeholders
- 1.4. Research Methodology
- 1.4.1. Primary research
- 1.4.2. Secondary research
- 1.4.3. Analyst tools and models
CHAPTER 2: EXECUTIVE SUMMARY
- 2.1. CXO Perspective
CHAPTER 3: MARKET OVERVIEW
- 3.1. Market definition and scope
- 3.2. Key findings
- 3.2.1. Top impacting factors
- 3.2.2. Top investment pockets
- 3.3. Porter's five forces analysis
- 3.3.1. Bargaining power of suppliers
- 3.3.2. Bargaining power of buyers
- 3.3.3. Threat of substitutes
- 3.3.4. Threat of new entrants
- 3.3.5. Intensity of rivalry
- 3.4. Market dynamics
- 3.4.1. Drivers
- 3.4.1.1. Rise in demand for customization of products to gain competitive edge
- 3.4.1.2. Surge in adoption of multiple materials for prototyping
- 3.4.1. Drivers
- 3.4.2. Restraints
- 3.4.2.1. High cost related to rapid prototyping, along with requirement for skilled professionals
- 3.4.3. Opportunities
- 3.4.3.1. Increase in adoption of rapid prototyping in digital manufacturing augments rapid prototyping market progress
- 3.5. COVID-19 Impact Analysis on the market
CHAPTER 4: RAPID PROTOTYPING MARKET, BY MATERIAL
- 4.1. Overview
- 4.1.1. Market size and forecast
- 4.2. Thermoplastics
- 4.2.1. Key market trends, growth factors and opportunities
- 4.2.2. Market size and forecast, by region
- 4.2.3. Market share analysis by country
- 4.3. Metals and Alloys
- 4.3.1. Key market trends, growth factors and opportunities
- 4.3.2. Market size and forecast, by region
- 4.3.3. Market share analysis by country
- 4.4. Ceramics
- 4.4.1. Key market trends, growth factors and opportunities
- 4.4.2. Market size and forecast, by region
- 4.4.3. Market share analysis by country
- 4.5. Others
- 4.5.1. Key market trends, growth factors and opportunities
- 4.5.2. Market size and forecast, by region
- 4.5.3. Market share analysis by country
CHAPTER 5: RAPID PROTOTYPING MARKET, BY TECHNOLOGY
- 5.1. Overview
- 5.1.1. Market size and forecast
- 5.2. Stereolithography (SLA)
- 5.2.1. Key market trends, growth factors and opportunities
- 5.2.2. Market size and forecast, by region
- 5.2.3. Market share analysis by country
- 5.3. Selective Laser Sintering (SLS)
- 5.3.1. Key market trends, growth factors and opportunities
- 5.3.2. Market size and forecast, by region
- 5.3.3. Market share analysis by country
- 5.4. Digital Light Processing (DLP)
- 5.4.1. Key market trends, growth factors and opportunities
- 5.4.2. Market size and forecast, by region
- 5.4.3. Market share analysis by country
- 5.5. Fused Deposition Modeling (FDM)
- 5.5.1. Key market trends, growth factors and opportunities
- 5.5.2. Market size and forecast, by region
- 5.5.3. Market share analysis by country
- 5.6. Others
- 5.6.1. Key market trends, growth factors and opportunities
- 5.6.2. Market size and forecast, by region
- 5.6.3. Market share analysis by country
CHAPTER 6: RAPID PROTOTYPING MARKET, BY END USER INDUSTRY
- 6.1. Overview
- 6.1.1. Market size and forecast
- 6.2. Aerospace and Defense
- 6.2.1. Key market trends, growth factors and opportunities
- 6.2.2. Market size and forecast, by region
- 6.2.3. Market share analysis by country
- 6.3. Healthcare
- 6.3.1. Key market trends, growth factors and opportunities
- 6.3.2. Market size and forecast, by region
- 6.3.3. Market share analysis by country
- 6.4. Manufacturing and Construction
- 6.4.1. Key market trends, growth factors and opportunities
- 6.4.2. Market size and forecast, by region
- 6.4.3. Market share analysis by country
- 6.5. Consumer Goods and Electronics
- 6.5.1. Key market trends, growth factors and opportunities
- 6.5.2. Market size and forecast, by region
- 6.5.3. Market share analysis by country
- 6.6. Others
- 6.6.1. Key market trends, growth factors and opportunities
- 6.6.2. Market size and forecast, by region
- 6.6.3. Market share analysis by country
CHAPTER 7: RAPID PROTOTYPING MARKET, BY REGION
- 7.1. Overview
- 7.1.1. Market size and forecast By Region
- 7.2. North America
- 7.2.1. Key trends and opportunities
- 7.2.2. Market size and forecast, by Material
- 7.2.3. Market size and forecast, by Technology
- 7.2.4. Market size and forecast, by End User Industry
- 7.2.5. Market size and forecast, by country
- 7.2.5.1. U.S.
- 7.2.5.1.1. Key market trends, growth factors and opportunities
- 7.2.5.1.2. Market size and forecast, by Material
- 7.2.5.1.3. Market size and forecast, by Technology
- 7.2.5.1.4. Market size and forecast, by End User Industry
- 7.2.5.2. Canada
- 7.2.5.2.1. Key market trends, growth factors and opportunities
- 7.2.5.2.2. Market size and forecast, by Material
- 7.2.5.2.3. Market size and forecast, by Technology
- 7.2.5.2.4. Market size and forecast, by End User Industry
- 7.2.5.3. Mexico
- 7.2.5.3.1. Key market trends, growth factors and opportunities
- 7.2.5.3.2. Market size and forecast, by Material
- 7.2.5.3.3. Market size and forecast, by Technology
- 7.2.5.3.4. Market size and forecast, by End User Industry
- 7.3. Europe
- 7.3.1. Key trends and opportunities
- 7.3.2. Market size and forecast, by Material
- 7.3.3. Market size and forecast, by Technology
- 7.3.4. Market size and forecast, by End User Industry
- 7.3.5. Market size and forecast, by country
- 7.3.5.1. UK
- 7.3.5.1.1. Key market trends, growth factors and opportunities
- 7.3.5.1.2. Market size and forecast, by Material
- 7.3.5.1.3. Market size and forecast, by Technology
- 7.3.5.1.4. Market size and forecast, by End User Industry
- 7.3.5.2. Germany
- 7.3.5.2.1. Key market trends, growth factors and opportunities
- 7.3.5.2.2. Market size and forecast, by Material
- 7.3.5.2.3. Market size and forecast, by Technology
- 7.3.5.2.4. Market size and forecast, by End User Industry
- 7.3.5.3. France
- 7.3.5.3.1. Key market trends, growth factors and opportunities
- 7.3.5.3.2. Market size and forecast, by Material
- 7.3.5.3.3. Market size and forecast, by Technology
- 7.3.5.3.4. Market size and forecast, by End User Industry
- 7.3.5.4. Rest of Europe
- 7.3.5.4.1. Key market trends, growth factors and opportunities
- 7.3.5.4.2. Market size and forecast, by Material
- 7.3.5.4.3. Market size and forecast, by Technology
- 7.3.5.4.4. Market size and forecast, by End User Industry
- 7.4. Asia-Pacific
- 7.4.1. Key trends and opportunities
- 7.4.2. Market size and forecast, by Material
- 7.4.3. Market size and forecast, by Technology
- 7.4.4. Market size and forecast, by End User Industry
- 7.4.5. Market size and forecast, by country
- 7.4.5.1. China
- 7.4.5.1.1. Key market trends, growth factors and opportunities
- 7.4.5.1.2. Market size and forecast, by Material
- 7.4.5.1.3. Market size and forecast, by Technology
- 7.4.5.1.4. Market size and forecast, by End User Industry
- 7.4.5.2. Japan
- 7.4.5.2.1. Key market trends, growth factors and opportunities
- 7.4.5.2.2. Market size and forecast, by Material
- 7.4.5.2.3. Market size and forecast, by Technology
- 7.4.5.2.4. Market size and forecast, by End User Industry
- 7.4.5.3. India
- 7.4.5.3.1. Key market trends, growth factors and opportunities
- 7.4.5.3.2. Market size and forecast, by Material
- 7.4.5.3.3. Market size and forecast, by Technology
- 7.4.5.3.4. Market size and forecast, by End User Industry
- 7.4.5.4. Australia
- 7.4.5.4.1. Key market trends, growth factors and opportunities
- 7.4.5.4.2. Market size and forecast, by Material
- 7.4.5.4.3. Market size and forecast, by Technology
- 7.4.5.4.4. Market size and forecast, by End User Industry
- 7.4.5.5. Rest of Asia-Pacific
- 7.4.5.5.1. Key market trends, growth factors and opportunities
- 7.4.5.5.2. Market size and forecast, by Material
- 7.4.5.5.3. Market size and forecast, by Technology
- 7.4.5.5.4. Market size and forecast, by End User Industry
- 7.5. LAMEA
- 7.5.1. Key trends and opportunities
- 7.5.2. Market size and forecast, by Material
- 7.5.3. Market size and forecast, by Technology
- 7.5.4. Market size and forecast, by End User Industry
- 7.5.5. Market size and forecast, by country
- 7.5.5.1. Latin America
- 7.5.5.1.1. Key market trends, growth factors and opportunities
- 7.5.5.1.2. Market size and forecast, by Material
- 7.5.5.1.3. Market size and forecast, by Technology
- 7.5.5.1.4. Market size and forecast, by End User Industry
- 7.5.5.2. Middle East
- 7.5.5.2.1. Key market trends, growth factors and opportunities
- 7.5.5.2.2. Market size and forecast, by Material
- 7.5.5.2.3. Market size and forecast, by Technology
- 7.5.5.2.4. Market size and forecast, by End User Industry
- 7.5.5.3. Africa
- 7.5.5.3.1. Key market trends, growth factors and opportunities
- 7.5.5.3.2. Market size and forecast, by Material
- 7.5.5.3.3. Market size and forecast, by Technology
- 7.5.5.3.4. Market size and forecast, by End User Industry
CHAPTER 8: COMPETITIVE LANDSCAPE
- 8.1. Introduction
- 8.2. Top winning strategies
- 8.3. Product Mapping of Top 10 Player
- 8.4. Competitive Dashboard
- 8.5. Competitive Heatmap
- 8.6. Top player positioning, 2021
CHAPTER 9: COMPANY PROFILES
- 9.1. 3D Systems, Inc.
- 9.1.1. Company overview
- 9.1.2. Key Executives
- 9.1.3. Company snapshot
- 9.1.4. Operating business segments
- 9.1.5. Product portfolio
- 9.1.6. Business performance
- 9.1.7. Key strategic moves and developments
- 9.2. 3DFortify, Inc.
- 9.2.1. Company overview
- 9.2.2. Key Executives
- 9.2.3. Company snapshot
- 9.2.4. Operating business segments
- 9.2.5. Product portfolio
- 9.3. Arcam AB (General Electric)
- 9.3.1. Company overview
- 9.3.2. Key Executives
- 9.3.3. Company snapshot
- 9.3.4. Operating business segments
- 9.3.5. Product portfolio
- 9.3.6. Business performance
- 9.3.7. Key strategic moves and developments
- 9.4. Carbon 3D
- 9.4.1. Company overview
- 9.4.2. Key Executives
- 9.4.3. Company snapshot
- 9.4.4. Operating business segments
- 9.4.5. Product portfolio
- 9.5. Desktop Metal, Inc.
- 9.5.1. Company overview
- 9.5.2. Key Executives
- 9.5.3. Company snapshot
- 9.5.4. Operating business segments
- 9.5.5. Product portfolio
- 9.5.6. Business performance
- 9.5.7. Key strategic moves and developments
- 9.6. ExOne Company
- 9.6.1. Company overview
- 9.6.2. Key Executives
- 9.6.3. Company snapshot
- 9.6.4. Operating business segments
- 9.6.5. Product portfolio
- 9.6.6. Business performance
- 9.7. Hoganas AB
- 9.7.1. Company overview
- 9.7.2. Key Executives
- 9.7.3. Company snapshot
- 9.7.4. Operating business segments
- 9.7.5. Product portfolio
- 9.8. Markforged
- 9.8.1. Company overview
- 9.8.2. Key Executives
- 9.8.3. Company snapshot
- 9.8.4. Operating business segments
- 9.8.5. Product portfolio
- 9.8.6. Business performance
- 9.9. Optomec, Inc.
- 9.9.1. Company overview
- 9.9.2. Key Executives
- 9.9.3. Company snapshot
- 9.9.4. Operating business segments
- 9.9.5. Product portfolio
- 9.10. Stratasys, Ltd.
- 9.10.1. Company overview
- 9.10.2. Key Executives
- 9.10.3. Company snapshot
- 9.10.4. Operating business segments
- 9.10.5. Product portfolio
- 9.10.6. Business performance