|
|
市場調査レポート
商品コード
1298241
疼痛パッチ市場:製品タイプ別、タイプ別、流通チャネル別:世界の機会分析と産業予測、2021-2031年Pain Patch Market By Product Type, By Type, By Distribution Channel : Global Opportunity Analysis and Industry Forecast, 2021-2031 |
||||||
|
|
|||||||


| 疼痛パッチ市場:製品タイプ別、タイプ別、流通チャネル別:世界の機会分析と産業予測、2021-2031年 |
|
出版日: 2023年03月01日
発行: Allied Market Research
ページ情報: 英文 374 Pages
納期: 2~3営業日
|
- 全表示
- 概要
- 図表
- 目次
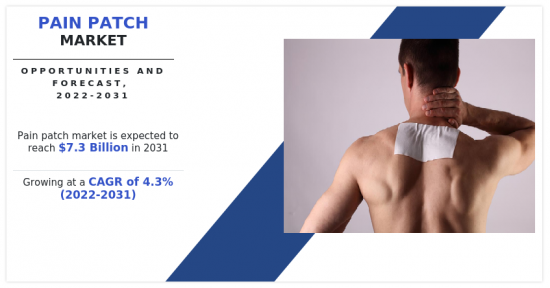
疼痛パッチ市場は2021年に48億370万米ドルと評価され、2031年には73億3,807万米ドルに達すると推定され、2022年から2031年までのCAGRは4.3%です。
疼痛パッチは経皮吸収型の鎮痛方法で、皮膚に薬剤を塗布し、皮膚から血流に吸収されます。これらのパッチは、一定期間にわたって薬剤を継続的に制御放出するように設計されており、疼痛を効果的に管理するのに役立つ。通常、関節炎、腰痛、神経障害性疼痛など、継続的な治療が必要な慢性疼痛に使用されます。薬剤は、フェンタニルやブプレノルフィンなどのオピオイドか、リドカインやジクロフェナクなどの非オピオイドのいずれかになります。これらのほとんどは処方箋のみで入手可能だが、OTC(一般用医薬品)としても販売されています。
疼痛パッチ市場の原動力は、老人人口の増加、疼痛パッチの使用量の増加、慢性疼痛患者の増加です。例えば、米国疼痛財団(U.S. Pain Foundation)の2022年報告書によると、毎年5,000万人が慢性疼痛に苦しんでいます。従って、慢性疼痛の有病率の増加は市場の成長を促進すると予想されます。また、老年人口は関節痛、神経障害性疼痛、その他の慢性疼痛に悩まされる傾向にあります。そのため、老年人口の増加が市場成長の原動力となる可能性があります。
さらに、疼痛管理のための先進的な方法に関連する意識の高まりや、サリチル酸メチルやニトログリセリンのようなOTC疼痛パッチ製品の利用可能性は、市場の成長を後押しすると予測されます。また、パッチ技術の進歩も市場成長を押し上げると予想されます。さらに、多くの主要企業が、世界の疼痛パッチ市場における存在感を高めるために、提携、事業拡大、アライアンスなどの主要戦略を採用しています。 例えば、2022年8月、Sorrento Therapeutics Inc.は、ZTlido(リドカイン外用システム)が全米最大級の薬局給付管理者(PBM)の1つと国民健康保険制度に追加され、3,000万人への保険適用が拡大すると発表しました。そのため、このような事業拡大が市場成長の成長を促進すると予想されます。
しかし、鍼治療、理学療法、カイロプラクティックなどの代替治療が利用可能であることなどが、疼痛パッチ市場の成長を抑制すると予測されています。また、オピオイド含有疼痛パッチの製造・販売に関連する厳しい政府規制が市場の成長を妨げると予想されます。
目次
第1章 イントロダクション
第2章 エグゼクティブサマリー
第3章 市場概要
- 市場の定義と範囲
- 主な調査結果
- 影響要因
- 主な投資ポケット
- ポーターのファイブフォース分析
- 供給企業の交渉力
- 買い手の交渉力
- 代替品の脅威
- 新規参入業者の脅威
- 競合の激しさ
- 市場力学
- 促進要因
- 疼痛パッチの技術進歩
- 慢性疼痛の増加
- 疼痛管理用パッチの採用増加
- 阻害要因
- 代替治療の利用可能性
- 政府の厳しい規制
- 機会
- 新興市場における成長機会
- 促進要因
- COVID-19による市場への影響分析
第4章 疼痛パッチ市場:製品タイプ別
- 概要
- 市場規模および予測
- 非オピオイドパッチ
- 主要市場動向、成長要因、機会
- 市場規模・予測:地域別
- 市場シェア分析:国別
- 非オピオイドパッチ型疼痛パッチ市場:薬剤別
- オピオイドパッチ
- 主な市場動向、成長要因、機会
- 市場規模・予測:地域別
- 市場シェア分析:国別
- オピオイドパッチ型疼痛パッチ市場: 薬剤別
第5章 疼痛パッチ市場:タイプ別
- 概要
- 市場規模と予測
- 処方薬
- 主要市場動向、成長要因、機会
- 市場規模・予測:地域別
- 市場シェア分析:国別
- OTC医薬品
- 主要市場動向、成長要因、機会
- 市場規模・予測:地域別
- 市場シェア分析:国別
第6章 疼痛パッチ市場:流通チャネル別
- 概要
- 市場規模と予測
- 病院薬局
- 主要市場動向、成長要因、機会
- 市場規模・予測:地域別
- 市場シェア分析:国別
- ドラッグストアと小売薬局
- 主な市場動向、成長要因、機会
- 市場規模・予測:地域別
- 市場シェア分析:国別
- オンラインプロバイダー
- 主な市場動向、成長要因、機会
- 市場規模・予測:地域別
- 市場シェア分析:国別
第7章 疼痛パッチ市場:地域別
- 概要
- 市場規模・予測:地域別
- 北米
- 主要動向と機会
- 市場規模・予測:製品タイプ別
- 市場規模・予測:タイプ別
- 市場規模・予測:流通チャネル別
- 市場規模・予測:国別
- 米国
- 主要市場動向、成長要因、機会
- 市場規模・予測:製品タイプ別
- 市場規模・予測:タイプ別
- 市場規模・予測:流通チャネル別
- カナダ
- 主要市場動向、成長要因、機会
- 市場規模・予測:製品タイプ別
- 市場規模・予測:タイプ別
- 市場規模・予測:流通チャネル別
- メキシコ
- 主要市場動向、成長要因、機会
- 市場規模・予測:製品タイプ別
- 市場規模・予測:タイプ別
- 市場規模・予測:流通チャネル別
- 欧州
- 主要動向と機会
- 市場規模・予測:製品タイプ別
- 市場規模・予測:タイプ別
- 市場規模・予測:流通チャネル別
- 市場規模・予測:国別
- ドイツ
- 主要市場動向、成長要因、機会
- 市場規模・予測:製品タイプ別
- 市場規模・予測:タイプ別
- 市場規模・予測:流通チャネル別
- フランス
- 主要市場動向、成長要因、機会
- 市場規模・予測:製品タイプ別
- 市場規模・予測:タイプ別
- 市場規模・予測:流通チャネル別
- 英国
- 主要市場動向、成長要因、機会
- 市場規模・予測:製品タイプ別
- 市場規模・予測:タイプ別
- 市場規模・予測:流通チャネル別
- イタリア
- 主要市場動向、成長要因、機会
- 市場規模・予測:製品タイプ別
- 市場規模・予測:タイプ別
- 市場規模・予測:流通チャネル別
- スペイン
- 主要市場動向、成長要因、機会
- 市場規模・予測:製品タイプ別
- 市場規模・予測:タイプ別
- 市場規模・予測:流通チャネル別
- その他欧州
- 主要市場動向、成長要因、機会
- 市場規模・予測:製品タイプ別
- 市場規模・予測:タイプ別
- 市場規模・予測:流通チャネル別
- アジア太平洋地域
- 主要動向と機会
- 市場規模・予測:製品タイプ別
- 市場規模・予測:タイプ別
- 市場規模・予測:流通チャネル別
- 市場規模・予測:国別
- 日本
- 主要市場動向、成長要因、機会
- 市場規模・予測:製品タイプ別
- 市場規模・予測:タイプ別
- 市場規模・予測:流通チャネル別
- 中国
- 主要市場動向、成長要因、機会
- 市場規模・予測:製品タイプ別
- 市場規模・予測:タイプ別
- 市場規模・予測:流通チャネル別
- インド
- 主要市場動向、成長要因、機会
- 市場規模・予測:製品タイプ別
- 市場規模・予測:タイプ別
- 市場規模・予測:流通チャネル別
- オーストラリア
- 主要市場動向、成長要因、機会
- 市場規模・予測:製品タイプ別
- 市場規模・予測:タイプ別
- 市場規模・予測:流通チャネル別
- 韓国
- 主要市場動向、成長要因、機会
- 市場規模・予測:製品タイプ別
- 市場規模・予測:タイプ別
- 市場規模・予測:流通チャネル別
- その他アジア太平洋地域
- 主要市場動向、成長要因、機会
- 市場規模・予測:製品タイプ別
- 市場規模・予測:タイプ別
- 市場規模・予測:流通チャネル別
- ラテンアメリカ・中東・アフリカ
- 主要動向と機会
- 市場規模・予測:製品タイプ別
- 市場規模・予測:タイプ別
- 市場規模・予測:流通チャネル別
- 市場規模・予測:国別
- ブラジル
- 主要市場動向、成長要因、機会
- 市場規模・予測:製品タイプ別
- 市場規模・予測:タイプ別
- 市場規模・予測:流通チャネル別
- サウジアラビア
- 主要市場動向、成長要因、機会
- 市場規模・予測:製品タイプ別
- 市場規模・予測:タイプ別
- 市場規模・予測:流通チャネル別
- 南アフリカ
- 主要市場動向、成長要因、機会
- 市場規模・予測:製品タイプ別
- 市場規模・予測:タイプ別
- 市場規模・予測:流通チャネル別
- その他の地域
- 主要市場動向、成長要因、機会
- 市場規模・予測:製品タイプ別
- 市場規模・予測:タイプ別
- 市場規模・予測:流通チャネル別
第8章 競合情勢
- イントロダクション
- 主要成功戦略
- 主要10社の製品マッピング
- 競合ダッシュボード
- 競合ヒートマップ
- 主要企業のポジショニング(2021年
第9章 企業プロファイル
- Viatris Inc.
- Johnson and Johnson
- Teva Pharmaceutical Industries Ltd.
- Hisamitsu Pharmaceutical Co.,Inc.
- Endo International plc.
- NEXGEL Advanced Hydrogel Solutions
- Purdue Pharma L.P.
- Sorrento Therapeutics Inc.
- Amneal Pharmaceuticals LLC
- Grunenthal
LIST OF TABLES
- TABLE 01. GLOBAL PAIN PATCH MARKET, BY PRODUCT TYPE, 2021-2031 ($MILLION)
- TABLE 02. PAIN PATCH MARKET FOR NON-OPIOID PATCHES, BY REGION, 2021-2031 ($MILLION)
- TABLE 03. GLOBAL NON-OPIOID PATCHES PAIN PATCH MARKET, BY DRUGS, 2021-2031 ($MILLION)
- TABLE 04. PAIN PATCH MARKET FOR OPIOID PATCHES, BY REGION, 2021-2031 ($MILLION)
- TABLE 05. GLOBAL OPIOID PATCHES PAIN PATCH MARKET, BY DRUGS, 2021-2031 ($MILLION)
- TABLE 06. GLOBAL PAIN PATCH MARKET, BY TYPE, 2021-2031 ($MILLION)
- TABLE 07. PAIN PATCH MARKET FOR PRESCRIPTION MEDICINES, BY REGION, 2021-2031 ($MILLION)
- TABLE 08. PAIN PATCH MARKET FOR OTC MEDICINES, BY REGION, 2021-2031 ($MILLION)
- TABLE 09. GLOBAL PAIN PATCH MARKET, BY DISTRIBUTION CHANNEL, 2021-2031 ($MILLION)
- TABLE 10. PAIN PATCH MARKET FOR HOSPITAL PHARMACIES, BY REGION, 2021-2031 ($MILLION)
- TABLE 11. PAIN PATCH MARKET FOR DRUG STORES AND RETAIL PHARMACIES, BY REGION, 2021-2031 ($MILLION)
- TABLE 12. PAIN PATCH MARKET FOR ONLINE PROVIDERS, BY REGION, 2021-2031 ($MILLION)
- TABLE 13. PAIN PATCH MARKET, BY REGION, 2021-2031 ($MILLION)
- TABLE 14. NORTH AMERICA PAIN PATCH MARKET, BY PRODUCT TYPE, 2021-2031 ($MILLION)
- TABLE 15. NORTH AMERICA PAIN PATCH MARKET, BY TYPE, 2021-2031 ($MILLION)
- TABLE 16. NORTH AMERICA PAIN PATCH MARKET, BY DISTRIBUTION CHANNEL, 2021-2031 ($MILLION)
- TABLE 17. NORTH AMERICA PAIN PATCH MARKET, BY COUNTRY, 2021-2031 ($MILLION)
- TABLE 18. U.S. PAIN PATCH MARKET, BY PRODUCT TYPE, 2021-2031 ($MILLION)
- TABLE 19. U.S. PAIN PATCH MARKET, BY TYPE, 2021-2031 ($MILLION)
- TABLE 20. U.S. PAIN PATCH MARKET, BY DISTRIBUTION CHANNEL, 2021-2031 ($MILLION)
- TABLE 21. CANADA PAIN PATCH MARKET, BY PRODUCT TYPE, 2021-2031 ($MILLION)
- TABLE 22. CANADA PAIN PATCH MARKET, BY TYPE, 2021-2031 ($MILLION)
- TABLE 23. CANADA PAIN PATCH MARKET, BY DISTRIBUTION CHANNEL, 2021-2031 ($MILLION)
- TABLE 24. MEXICO PAIN PATCH MARKET, BY PRODUCT TYPE, 2021-2031 ($MILLION)
- TABLE 25. MEXICO PAIN PATCH MARKET, BY TYPE, 2021-2031 ($MILLION)
- TABLE 26. MEXICO PAIN PATCH MARKET, BY DISTRIBUTION CHANNEL, 2021-2031 ($MILLION)
- TABLE 27. EUROPE PAIN PATCH MARKET, BY PRODUCT TYPE, 2021-2031 ($MILLION)
- TABLE 28. EUROPE PAIN PATCH MARKET, BY TYPE, 2021-2031 ($MILLION)
- TABLE 29. EUROPE PAIN PATCH MARKET, BY DISTRIBUTION CHANNEL, 2021-2031 ($MILLION)
- TABLE 30. EUROPE PAIN PATCH MARKET, BY COUNTRY, 2021-2031 ($MILLION)
- TABLE 31. GERMANY PAIN PATCH MARKET, BY PRODUCT TYPE, 2021-2031 ($MILLION)
- TABLE 32. GERMANY PAIN PATCH MARKET, BY TYPE, 2021-2031 ($MILLION)
- TABLE 33. GERMANY PAIN PATCH MARKET, BY DISTRIBUTION CHANNEL, 2021-2031 ($MILLION)
- TABLE 34. FRANCE PAIN PATCH MARKET, BY PRODUCT TYPE, 2021-2031 ($MILLION)
- TABLE 35. FRANCE PAIN PATCH MARKET, BY TYPE, 2021-2031 ($MILLION)
- TABLE 36. FRANCE PAIN PATCH MARKET, BY DISTRIBUTION CHANNEL, 2021-2031 ($MILLION)
- TABLE 37. UK PAIN PATCH MARKET, BY PRODUCT TYPE, 2021-2031 ($MILLION)
- TABLE 38. UK PAIN PATCH MARKET, BY TYPE, 2021-2031 ($MILLION)
- TABLE 39. UK PAIN PATCH MARKET, BY DISTRIBUTION CHANNEL, 2021-2031 ($MILLION)
- TABLE 40. ITALY PAIN PATCH MARKET, BY PRODUCT TYPE, 2021-2031 ($MILLION)
- TABLE 41. ITALY PAIN PATCH MARKET, BY TYPE, 2021-2031 ($MILLION)
- TABLE 42. ITALY PAIN PATCH MARKET, BY DISTRIBUTION CHANNEL, 2021-2031 ($MILLION)
- TABLE 43. SPAIN PAIN PATCH MARKET, BY PRODUCT TYPE, 2021-2031 ($MILLION)
- TABLE 44. SPAIN PAIN PATCH MARKET, BY TYPE, 2021-2031 ($MILLION)
- TABLE 45. SPAIN PAIN PATCH MARKET, BY DISTRIBUTION CHANNEL, 2021-2031 ($MILLION)
- TABLE 46. REST OF EUROPE PAIN PATCH MARKET, BY PRODUCT TYPE, 2021-2031 ($MILLION)
- TABLE 47. REST OF EUROPE PAIN PATCH MARKET, BY TYPE, 2021-2031 ($MILLION)
- TABLE 48. REST OF EUROPE PAIN PATCH MARKET, BY DISTRIBUTION CHANNEL, 2021-2031 ($MILLION)
- TABLE 49. ASIA-PACIFIC PAIN PATCH MARKET, BY PRODUCT TYPE, 2021-2031 ($MILLION)
- TABLE 50. ASIA-PACIFIC PAIN PATCH MARKET, BY TYPE, 2021-2031 ($MILLION)
- TABLE 51. ASIA-PACIFIC PAIN PATCH MARKET, BY DISTRIBUTION CHANNEL, 2021-2031 ($MILLION)
- TABLE 52. ASIA-PACIFIC PAIN PATCH MARKET, BY COUNTRY, 2021-2031 ($MILLION)
- TABLE 53. JAPAN PAIN PATCH MARKET, BY PRODUCT TYPE, 2021-2031 ($MILLION)
- TABLE 54. JAPAN PAIN PATCH MARKET, BY TYPE, 2021-2031 ($MILLION)
- TABLE 55. JAPAN PAIN PATCH MARKET, BY DISTRIBUTION CHANNEL, 2021-2031 ($MILLION)
- TABLE 56. CHINA PAIN PATCH MARKET, BY PRODUCT TYPE, 2021-2031 ($MILLION)
- TABLE 57. CHINA PAIN PATCH MARKET, BY TYPE, 2021-2031 ($MILLION)
- TABLE 58. CHINA PAIN PATCH MARKET, BY DISTRIBUTION CHANNEL, 2021-2031 ($MILLION)
- TABLE 59. INDIA PAIN PATCH MARKET, BY PRODUCT TYPE, 2021-2031 ($MILLION)
- TABLE 60. INDIA PAIN PATCH MARKET, BY TYPE, 2021-2031 ($MILLION)
- TABLE 61. INDIA PAIN PATCH MARKET, BY DISTRIBUTION CHANNEL, 2021-2031 ($MILLION)
- TABLE 62. AUSTRALIA PAIN PATCH MARKET, BY PRODUCT TYPE, 2021-2031 ($MILLION)
- TABLE 63. AUSTRALIA PAIN PATCH MARKET, BY TYPE, 2021-2031 ($MILLION)
- TABLE 64. AUSTRALIA PAIN PATCH MARKET, BY DISTRIBUTION CHANNEL, 2021-2031 ($MILLION)
- TABLE 65. SOUTH KOREA PAIN PATCH MARKET, BY PRODUCT TYPE, 2021-2031 ($MILLION)
- TABLE 66. SOUTH KOREA PAIN PATCH MARKET, BY TYPE, 2021-2031 ($MILLION)
- TABLE 67. SOUTH KOREA PAIN PATCH MARKET, BY DISTRIBUTION CHANNEL, 2021-2031 ($MILLION)
- TABLE 68. REST OF ASIA-PACIFIC PAIN PATCH MARKET, BY PRODUCT TYPE, 2021-2031 ($MILLION)
- TABLE 69. REST OF ASIA-PACIFIC PAIN PATCH MARKET, BY TYPE, 2021-2031 ($MILLION)
- TABLE 70. REST OF ASIA-PACIFIC PAIN PATCH MARKET, BY DISTRIBUTION CHANNEL, 2021-2031 ($MILLION)
- TABLE 71. LAMEA PAIN PATCH MARKET, BY PRODUCT TYPE, 2021-2031 ($MILLION)
- TABLE 72. LAMEA PAIN PATCH MARKET, BY TYPE, 2021-2031 ($MILLION)
- TABLE 73. LAMEA PAIN PATCH MARKET, BY DISTRIBUTION CHANNEL, 2021-2031 ($MILLION)
- TABLE 74. LAMEA PAIN PATCH MARKET, BY COUNTRY, 2021-2031 ($MILLION)
- TABLE 75. BRAZIL PAIN PATCH MARKET, BY PRODUCT TYPE, 2021-2031 ($MILLION)
- TABLE 76. BRAZIL PAIN PATCH MARKET, BY TYPE, 2021-2031 ($MILLION)
- TABLE 77. BRAZIL PAIN PATCH MARKET, BY DISTRIBUTION CHANNEL, 2021-2031 ($MILLION)
- TABLE 78. SAUDI ARABIA PAIN PATCH MARKET, BY PRODUCT TYPE, 2021-2031 ($MILLION)
- TABLE 79. SAUDI ARABIA PAIN PATCH MARKET, BY TYPE, 2021-2031 ($MILLION)
- TABLE 80. SAUDI ARABIA PAIN PATCH MARKET, BY DISTRIBUTION CHANNEL, 2021-2031 ($MILLION)
- TABLE 81. SOUTH AFRICA PAIN PATCH MARKET, BY PRODUCT TYPE, 2021-2031 ($MILLION)
- TABLE 82. SOUTH AFRICA PAIN PATCH MARKET, BY TYPE, 2021-2031 ($MILLION)
- TABLE 83. SOUTH AFRICA PAIN PATCH MARKET, BY DISTRIBUTION CHANNEL, 2021-2031 ($MILLION)
- TABLE 84. REST OF LAMEA PAIN PATCH MARKET, BY PRODUCT TYPE, 2021-2031 ($MILLION)
- TABLE 85. REST OF LAMEA PAIN PATCH MARKET, BY TYPE, 2021-2031 ($MILLION)
- TABLE 86. REST OF LAMEA PAIN PATCH MARKET, BY DISTRIBUTION CHANNEL, 2021-2031 ($MILLION)
- TABLE 87. VIATRIS INC.: KEY EXECUTIVES
- TABLE 88. VIATRIS INC.: COMPANY SNAPSHOT
- TABLE 89. VIATRIS INC.: PRODUCT SEGMENTS
- TABLE 90. VIATRIS INC.: PRODUCT PORTFOLIO
- TABLE 91. JOHNSON AND JOHNSON: KEY EXECUTIVES
- TABLE 92. JOHNSON AND JOHNSON: COMPANY SNAPSHOT
- TABLE 93. JOHNSON AND JOHNSON: PRODUCT SEGMENTS
- TABLE 94. JOHNSON AND JOHNSON: PRODUCT PORTFOLIO
- TABLE 95. TEVA PHARMACEUTICAL INDUSTRIES LTD.: KEY EXECUTIVES
- TABLE 96. TEVA PHARMACEUTICAL INDUSTRIES LTD.: COMPANY SNAPSHOT
- TABLE 97. TEVA PHARMACEUTICAL INDUSTRIES LTD.: PRODUCT SEGMENTS
- TABLE 98. TEVA PHARMACEUTICAL INDUSTRIES LTD.: PRODUCT PORTFOLIO
- TABLE 99. TEVA PHARMACEUTICAL INDUSTRIES LTD.: KEY STRATERGIES
- TABLE 100. HISAMITSU PHARMACEUTICAL CO.,INC.: KEY EXECUTIVES
- TABLE 101. HISAMITSU PHARMACEUTICAL CO.,INC.: COMPANY SNAPSHOT
- TABLE 102. HISAMITSU PHARMACEUTICAL CO.,INC.: PRODUCT SEGMENTS
- TABLE 103. HISAMITSU PHARMACEUTICAL CO.,INC.: PRODUCT PORTFOLIO
- TABLE 104. HISAMITSU PHARMACEUTICAL CO.,INC.: KEY STRATERGIES
- TABLE 105. ENDO INTERNATIONAL PLC.: KEY EXECUTIVES
- TABLE 106. ENDO INTERNATIONAL PLC.: COMPANY SNAPSHOT
- TABLE 107. ENDO INTERNATIONAL PLC.: PRODUCT SEGMENTS
- TABLE 108. ENDO INTERNATIONAL PLC.: PRODUCT PORTFOLIO
- TABLE 109. NEXGEL ADVANCED HYDROGEL SOLUTIONS: KEY EXECUTIVES
- TABLE 110. NEXGEL ADVANCED HYDROGEL SOLUTIONS: COMPANY SNAPSHOT
- TABLE 111. NEXGEL ADVANCED HYDROGEL SOLUTIONS: PRODUCT SEGMENTS
- TABLE 112. NEXGEL ADVANCED HYDROGEL SOLUTIONS: PRODUCT PORTFOLIO
- TABLE 113. PURDUE PHARMA L.P.: KEY EXECUTIVES
- TABLE 114. PURDUE PHARMA L.P.: COMPANY SNAPSHOT
- TABLE 115. PURDUE PHARMA L.P.: PRODUCT SEGMENTS
- TABLE 116. PURDUE PHARMA L.P.: PRODUCT PORTFOLIO
- TABLE 117. SORRENTO THERAPEUTICS INC.: KEY EXECUTIVES
- TABLE 118. SORRENTO THERAPEUTICS INC.: COMPANY SNAPSHOT
- TABLE 119. SORRENTO THERAPEUTICS INC.: PRODUCT SEGMENTS
- TABLE 120. SORRENTO THERAPEUTICS INC.: PRODUCT PORTFOLIO
- TABLE 121. SORRENTO THERAPEUTICS INC.: KEY STRATERGIES
- TABLE 122. AMNEAL PHARMACEUTICALS LLC: KEY EXECUTIVES
- TABLE 123. AMNEAL PHARMACEUTICALS LLC: COMPANY SNAPSHOT
- TABLE 124. AMNEAL PHARMACEUTICALS LLC: PRODUCT SEGMENTS
- TABLE 125. AMNEAL PHARMACEUTICALS LLC: PRODUCT PORTFOLIO
- TABLE 126. AMNEAL PHARMACEUTICALS LLC: KEY STRATERGIES
- TABLE 127. GRUNENTHAL: KEY EXECUTIVES
- TABLE 128. GRUNENTHAL: COMPANY SNAPSHOT
- TABLE 129. GRUNENTHAL: PRODUCT SEGMENTS
- TABLE 130. GRUNENTHAL: PRODUCT PORTFOLIO
- TABLE 131. GRUNENTHAL: KEY STRATERGIES
LIST OF FIGURES
- FIGURE 01. PAIN PATCH MARKET, 2021-2031
- FIGURE 02. SEGMENTATION OF PAIN PATCH MARKET, 2021-2031
- FIGURE 03. TOP INVESTMENT POCKETS IN PAIN PATCH MARKET (2022-2031)
- FIGURE 04. LOW BARGAINING POWER OF SUPPLIERS
- FIGURE 05. LOW BARGAINING POWER OF BUYERS
- FIGURE 06. LOW THREAT OF SUBSTITUTES
- FIGURE 07. LOW THREAT OF NEW ENTRANTS
- FIGURE 08. LOW INTENSITY OF RIVALRY
- FIGURE 09. DRIVERS, RESTRAINTS AND OPPORTUNITIES: GLOBALPAIN PATCH MARKET
- FIGURE 10. PAIN PATCH MARKET, BY PRODUCT TYPE, 2021(%)
- FIGURE 11. COMPARATIVE SHARE ANALYSIS OF PAIN PATCH MARKET FOR NON-OPIOID PATCHES, BY COUNTRY 2021 AND 2031(%)
- FIGURE 12. COMPARATIVE SHARE ANALYSIS OF PAIN PATCH MARKET FOR OPIOID PATCHES, BY COUNTRY 2021 AND 2031(%)
- FIGURE 13. PAIN PATCH MARKET, BY TYPE, 2021(%)
- FIGURE 14. COMPARATIVE SHARE ANALYSIS OF PAIN PATCH MARKET FOR PRESCRIPTION MEDICINES, BY COUNTRY 2021 AND 2031(%)
- FIGURE 15. COMPARATIVE SHARE ANALYSIS OF PAIN PATCH MARKET FOR OTC MEDICINES, BY COUNTRY 2021 AND 2031(%)
- FIGURE 16. PAIN PATCH MARKET, BY DISTRIBUTION CHANNEL, 2021(%)
- FIGURE 17. COMPARATIVE SHARE ANALYSIS OF PAIN PATCH MARKET FOR HOSPITAL PHARMACIES, BY COUNTRY 2021 AND 2031(%)
- FIGURE 18. COMPARATIVE SHARE ANALYSIS OF PAIN PATCH MARKET FOR DRUG STORES AND RETAIL PHARMACIES, BY COUNTRY 2021 AND 2031(%)
- FIGURE 19. COMPARATIVE SHARE ANALYSIS OF PAIN PATCH MARKET FOR ONLINE PROVIDERS, BY COUNTRY 2021 AND 2031(%)
- FIGURE 20. PAIN PATCH MARKET BY REGION, 2021
- FIGURE 21. U.S. PAIN PATCH MARKET, 2021-2031 ($MILLION)
- FIGURE 22. CANADA PAIN PATCH MARKET, 2021-2031 ($MILLION)
- FIGURE 23. MEXICO PAIN PATCH MARKET, 2021-2031 ($MILLION)
- FIGURE 24. GERMANY PAIN PATCH MARKET, 2021-2031 ($MILLION)
- FIGURE 25. FRANCE PAIN PATCH MARKET, 2021-2031 ($MILLION)
- FIGURE 26. UK PAIN PATCH MARKET, 2021-2031 ($MILLION)
- FIGURE 27. ITALY PAIN PATCH MARKET, 2021-2031 ($MILLION)
- FIGURE 28. SPAIN PAIN PATCH MARKET, 2021-2031 ($MILLION)
- FIGURE 29. REST OF EUROPE PAIN PATCH MARKET, 2021-2031 ($MILLION)
- FIGURE 30. JAPAN PAIN PATCH MARKET, 2021-2031 ($MILLION)
- FIGURE 31. CHINA PAIN PATCH MARKET, 2021-2031 ($MILLION)
- FIGURE 32. INDIA PAIN PATCH MARKET, 2021-2031 ($MILLION)
- FIGURE 33. AUSTRALIA PAIN PATCH MARKET, 2021-2031 ($MILLION)
- FIGURE 34. SOUTH KOREA PAIN PATCH MARKET, 2021-2031 ($MILLION)
- FIGURE 35. REST OF ASIA-PACIFIC PAIN PATCH MARKET, 2021-2031 ($MILLION)
- FIGURE 36. BRAZIL PAIN PATCH MARKET, 2021-2031 ($MILLION)
- FIGURE 37. SAUDI ARABIA PAIN PATCH MARKET, 2021-2031 ($MILLION)
- FIGURE 38. SOUTH AFRICA PAIN PATCH MARKET, 2021-2031 ($MILLION)
- FIGURE 39. REST OF LAMEA PAIN PATCH MARKET, 2021-2031 ($MILLION)
- FIGURE 40. TOP WINNING STRATEGIES, BY YEAR
- FIGURE 41. TOP WINNING STRATEGIES, BY DEVELOPMENT
- FIGURE 42. TOP WINNING STRATEGIES, BY COMPANY
- FIGURE 43. PRODUCT MAPPING OF TOP 10 PLAYERS
- FIGURE 44. COMPETITIVE DASHBOARD
- FIGURE 45. COMPETITIVE HEATMAP: PAIN PATCH MARKET
- FIGURE 46. TOP PLAYER POSITIONING, 2021
- FIGURE 47. VIATRIS INC.: NET SALES, 2020-2022 ($MILLION)
- FIGURE 48. VIATRIS INC.: REVENUE SHARE BY SEGMENT, 2022 (%)
- FIGURE 49. JOHNSON AND JOHNSON: SALES REVENUE, 2019-2021 ($MILLION)
- FIGURE 50. JOHNSON AND JOHNSON: REVENUE SHARE BY SEGMENT, 2021 (%)
- FIGURE 51. JOHNSON AND JOHNSON: REVENUE SHARE BY REGION, 2021 (%)
- FIGURE 52. TEVA PHARMACEUTICAL INDUSTRIES LTD.: NET REVENUE, 2019-2021 ($MILLION)
- FIGURE 53. TEVA PHARMACEUTICAL INDUSTRIES LTD.: REVENUE SHARE BY SEGMENT, 2021 (%)
- FIGURE 54. HISAMITSU PHARMACEUTICAL CO.,INC.: NET SALES, 2020-2022 ($MILLION)
- FIGURE 55. ENDO INTERNATIONAL PLC.: NET REVENUE, 2019-2021 ($MILLION)
- FIGURE 56. ENDO INTERNATIONAL PLC.: REVENUE SHARE BY SEGMENT, 2021 (%)
- FIGURE 57. AMNEAL PHARMACEUTICALS LLC: NET REVENUE, 2020-2022 ($MILLION)
- FIGURE 58. AMNEAL PHARMACEUTICALS LLC: REVENUE SHARE BY SEGMENT, 2022 (%)
- FIGURE 59. GRUNENTHAL: NET REVENUE, 2019-2021 ($MILLION)
- FIGURE 60. GRUNENTHAL: REVENUE SHARE BY SEGMENT, 2021 (%)
- FIGURE 61. GRUNENTHAL: REVENUE SHARE BY REGION, 2021 (%)
The Pain Patches Market valued for $4,803.70 million in 2021 and is estimated to reach $7,338.07 million by 2031, exhibiting a CAGR of 4.3% from 2022 to 2031.
Pain patches are a transdermal method of pain relief that involves the application of medication to the skin, where it is absorbed into the bloodstream through the skin. These patches are designed to provide continuous, controlled release of medication over a period of time, which can help manage pain effectively. They are typically used for chronic pain conditions that require ongoing treatment, such as arthritis, back pain, and neuropathic pain. The medication can be either an opioid, such as fentanyl or buprenorphine, or a non-opioid, such as lidocaine or diclofenac. They are available as over the counter (OTC) products while most of these are available through prescription only.
The driving factor for pain patch market are increase in geriatric population, rise in usage of pain patches and increase in prevalence of chronic pain cases. For instance, according to U.S. Pain Foundation 2022 report, every year 50 million people suffer from chronic pain. Thus, rise in prevalence of chronic pain cases is expected to drive the growth of the market. In addition, the geriatric population is majorly prone to suffer from joint pain, neuropathic pain and other chronic pain conditions. Thus, rise in geriatric population potentially drives the market growth.
Furthermore, increase in awareness associated with advance method for pain management and availability of OTC pain patches products such as methyl salicylate and nitroglycerin are predicted to boost the growth of the market. In addition, rise in advancement in patches technology is anticipated to boost the market growth. Furthermore, many key players have adopted key strategies such as collaboration, business expansion, or alliance to increase their market presence in the global pain patch market. For instance, in August 2022, Sorrento Therapeutics Inc., announced that, ZTlido (lidocaine topical system) will be added to one of the largest National Pharmacy Benefit Managers (PBMs) and a national health plan - thereby expanding coverage to 30 million lives. Thus, such business expansions are expected to drive the growth of the market.
However, factors such as availability of alternative treatment such as acupuncture, physical therapy, and chiropractic care are projected to restrain the growth of the pain patch market. In addition, stringent government regulations associated with manufacturing and marketing of opioid-containing pain patches is expected to hamper the growth of the market.
The pain patch market is segmented into therapeutic class, type, distribution channel, and region. On the basis of therapeutic class, the market is bifurcated into non-opioids and opioids. The non-opioid segment is further categorized into nonsteroidal anti-inflammatory drugs (NSAIDS), methyl salicylate, lidocaine and others. The opioid segment is further categorized into buprenorphine and fentanyl. On the basis of type, the market is bifurcated into prescription medicines and OTC medicines. On the basis of distribution channel, the market is segregated into hospital pharmacies, drug stores and retail pharmacies and online providers. Region wise, the market is analyzed across North America (the U.S., Canada, and Mexico), Europe (Germany, France, the UK, Italy, Spain, and rest of Europe), Asia-Pacific (Japan, China, Australia, India, South Korea, and rest of Asia-Pacific), and LAMEA (Brazil, South Africa, Saudi Arabia, and rest of LAMEA).
Major key players that operate in the global pain patch market are: NEXGEL Advanced Hydrogel Solutions, Viatris Inc., Johnson & Johnson, Teva Pharmaceutical Industries Ltd., Sorrento Therapeutics Inc., Hisamitsu Pharmaceutical Co.,Inc., Endo International plc., Purdue Pharma L.P., Amneal Pharmaceuticals LLC, and Grunenthal .
Key Benefits For Stakeholders
- This report provides a quantitative analysis of the market segments, current trends, estimations, and dynamics of the pain patch market analysis from 2021 to 2031 to identify the prevailing pain patch market opportunities.
- The market research is offered along with information related to key drivers, restraints, and opportunities.
- Porter's five forces analysis highlights the potency of buyers and suppliers to enable stakeholders make profit-oriented business decisions and strengthen their supplier-buyer network.
- In-depth analysis of the pain patch market segmentation assists to determine the prevailing market opportunities.
- Major countries in each region are mapped according to their revenue contribution to the global market.
- Market player positioning facilitates benchmarking and provides a clear understanding of the present position of the market players.
- The report includes the analysis of the regional as well as global pain patch market trends, key players, market segments, application areas, and market growth strategies.
Key Market Segments
By Product Type
- Non-Opioid Patches
- Drugs
- Nonsteroidal Anti-Inflammatory Drugs
- Methyl Salicylate
- Lidocaine
- Others
- Opioid Patches
- Drugs
- Buprenorphine
- Fentanyl
By Type
- Prescription Medicines
- OTC Medicines
By Distribution Channel
- Hospital Pharmacies
- Drug Stores and Retail Pharmacies
- Online Providers
By Region
- North America
- U.S.
- Canada
- Mexico
- Europe
- Germany
- France
- UK
- Italy
- Spain
- Rest of Europe
- Asia-Pacific
- Japan
- China
- India
- Australia
- South Korea
- Rest of Asia-Pacific
- LAMEA
- Brazil
- Saudi Arabia
- South Africa
- Rest of LAMEA
Key Market Players:
- NEXGEL Advanced Hydrogel Solutions
- Viatris Inc.
- Johnson and Johnson
- Teva Pharmaceutical Industries Ltd.
- Sorrento Therapeutics Inc.
- Hisamitsu Pharmaceutical Co.,Inc.
- Endo International plc.
- Purdue Pharma L.P.
- Amneal Pharmaceuticals LLC
- Grunenthal
TABLE OF CONTENTS
CHAPTER 1: INTRODUCTION
- 1.1. Report description
- 1.2. Key market segments
- 1.3. Key benefits to the stakeholders
- 1.4. Research Methodology
- 1.4.1. Primary research
- 1.4.2. Secondary research
- 1.4.3. Analyst tools and models
CHAPTER 2: EXECUTIVE SUMMARY
- 2.1. CXO Perspective
CHAPTER 3: MARKET OVERVIEW
- 3.1. Market definition and scope
- 3.2. Key findings
- 3.2.1. Top impacting factors
- 3.2.2. Top investment pockets
- 3.3. Porter's five forces analysis
- 3.3.1. Bargaining power of suppliers
- 3.3.2. Bargaining power of buyers
- 3.3.3. Threat of substitutes
- 3.3.4. Threat of new entrants
- 3.3.5. Intensity of rivalry
- 3.4. Market dynamics
- 3.4.1. Drivers
- 3.4.1.1. Technological advancement in pain patches
- 3.4.1.2. Rise in prevalence of Chronic Pain
- 3.4.1.3. Rising adoption of pain patch for pain management
- 3.4.1. Drivers
- 3.4.2. Restraints
- 3.4.2.1. Availability of alternate treatments
- 3.4.2.2. Stringent government regulations
- 3.4.3. Opportunities
- 3.4.3.1. Growth opportunities in emerging markets
- 3.5. COVID-19 Impact Analysis on the market
CHAPTER 4: PAIN PATCH MARKET, BY PRODUCT TYPE
- 4.1. Overview
- 4.1.1. Market size and forecast
- 4.2. Non-Opioid Patches
- 4.2.1. Key market trends, growth factors and opportunities
- 4.2.2. Market size and forecast, by region
- 4.2.3. Market share analysis by country
- 4.2.4. Non-Opioid Patches Pain Patch Market by Drugs
- 4.3. Opioid Patches
- 4.3.1. Key market trends, growth factors and opportunities
- 4.3.2. Market size and forecast, by region
- 4.3.3. Market share analysis by country
- 4.3.4. Opioid Patches Pain Patch Market by Drugs
CHAPTER 5: PAIN PATCH MARKET, BY TYPE
- 5.1. Overview
- 5.1.1. Market size and forecast
- 5.2. Prescription Medicines
- 5.2.1. Key market trends, growth factors and opportunities
- 5.2.2. Market size and forecast, by region
- 5.2.3. Market share analysis by country
- 5.3. OTC Medicines
- 5.3.1. Key market trends, growth factors and opportunities
- 5.3.2. Market size and forecast, by region
- 5.3.3. Market share analysis by country
CHAPTER 6: PAIN PATCH MARKET, BY DISTRIBUTION CHANNEL
- 6.1. Overview
- 6.1.1. Market size and forecast
- 6.2. Hospital Pharmacies
- 6.2.1. Key market trends, growth factors and opportunities
- 6.2.2. Market size and forecast, by region
- 6.2.3. Market share analysis by country
- 6.3. Drug Stores and Retail Pharmacies
- 6.3.1. Key market trends, growth factors and opportunities
- 6.3.2. Market size and forecast, by region
- 6.3.3. Market share analysis by country
- 6.4. Online Providers
- 6.4.1. Key market trends, growth factors and opportunities
- 6.4.2. Market size and forecast, by region
- 6.4.3. Market share analysis by country
CHAPTER 7: PAIN PATCH MARKET, BY REGION
- 7.1. Overview
- 7.1.1. Market size and forecast By Region
- 7.2. North America
- 7.2.1. Key trends and opportunities
- 7.2.2. Market size and forecast, by Product Type
- 7.2.3. Market size and forecast, by Type
- 7.2.4. Market size and forecast, by Distribution Channel
- 7.2.5. Market size and forecast, by country
- 7.2.5.1. U.S.
- 7.2.5.1.1. Key market trends, growth factors and opportunities
- 7.2.5.1.2. Market size and forecast, by Product Type
- 7.2.5.1.3. Market size and forecast, by Type
- 7.2.5.1.4. Market size and forecast, by Distribution Channel
- 7.2.5.2. Canada
- 7.2.5.2.1. Key market trends, growth factors and opportunities
- 7.2.5.2.2. Market size and forecast, by Product Type
- 7.2.5.2.3. Market size and forecast, by Type
- 7.2.5.2.4. Market size and forecast, by Distribution Channel
- 7.2.5.3. Mexico
- 7.2.5.3.1. Key market trends, growth factors and opportunities
- 7.2.5.3.2. Market size and forecast, by Product Type
- 7.2.5.3.3. Market size and forecast, by Type
- 7.2.5.3.4. Market size and forecast, by Distribution Channel
- 7.3. Europe
- 7.3.1. Key trends and opportunities
- 7.3.2. Market size and forecast, by Product Type
- 7.3.3. Market size and forecast, by Type
- 7.3.4. Market size and forecast, by Distribution Channel
- 7.3.5. Market size and forecast, by country
- 7.3.5.1. Germany
- 7.3.5.1.1. Key market trends, growth factors and opportunities
- 7.3.5.1.2. Market size and forecast, by Product Type
- 7.3.5.1.3. Market size and forecast, by Type
- 7.3.5.1.4. Market size and forecast, by Distribution Channel
- 7.3.5.2. France
- 7.3.5.2.1. Key market trends, growth factors and opportunities
- 7.3.5.2.2. Market size and forecast, by Product Type
- 7.3.5.2.3. Market size and forecast, by Type
- 7.3.5.2.4. Market size and forecast, by Distribution Channel
- 7.3.5.3. UK
- 7.3.5.3.1. Key market trends, growth factors and opportunities
- 7.3.5.3.2. Market size and forecast, by Product Type
- 7.3.5.3.3. Market size and forecast, by Type
- 7.3.5.3.4. Market size and forecast, by Distribution Channel
- 7.3.5.4. Italy
- 7.3.5.4.1. Key market trends, growth factors and opportunities
- 7.3.5.4.2. Market size and forecast, by Product Type
- 7.3.5.4.3. Market size and forecast, by Type
- 7.3.5.4.4. Market size and forecast, by Distribution Channel
- 7.3.5.5. Spain
- 7.3.5.5.1. Key market trends, growth factors and opportunities
- 7.3.5.5.2. Market size and forecast, by Product Type
- 7.3.5.5.3. Market size and forecast, by Type
- 7.3.5.5.4. Market size and forecast, by Distribution Channel
- 7.3.5.6. Rest of Europe
- 7.3.5.6.1. Key market trends, growth factors and opportunities
- 7.3.5.6.2. Market size and forecast, by Product Type
- 7.3.5.6.3. Market size and forecast, by Type
- 7.3.5.6.4. Market size and forecast, by Distribution Channel
- 7.4. Asia-Pacific
- 7.4.1. Key trends and opportunities
- 7.4.2. Market size and forecast, by Product Type
- 7.4.3. Market size and forecast, by Type
- 7.4.4. Market size and forecast, by Distribution Channel
- 7.4.5. Market size and forecast, by country
- 7.4.5.1. Japan
- 7.4.5.1.1. Key market trends, growth factors and opportunities
- 7.4.5.1.2. Market size and forecast, by Product Type
- 7.4.5.1.3. Market size and forecast, by Type
- 7.4.5.1.4. Market size and forecast, by Distribution Channel
- 7.4.5.2. China
- 7.4.5.2.1. Key market trends, growth factors and opportunities
- 7.4.5.2.2. Market size and forecast, by Product Type
- 7.4.5.2.3. Market size and forecast, by Type
- 7.4.5.2.4. Market size and forecast, by Distribution Channel
- 7.4.5.3. India
- 7.4.5.3.1. Key market trends, growth factors and opportunities
- 7.4.5.3.2. Market size and forecast, by Product Type
- 7.4.5.3.3. Market size and forecast, by Type
- 7.4.5.3.4. Market size and forecast, by Distribution Channel
- 7.4.5.4. Australia
- 7.4.5.4.1. Key market trends, growth factors and opportunities
- 7.4.5.4.2. Market size and forecast, by Product Type
- 7.4.5.4.3. Market size and forecast, by Type
- 7.4.5.4.4. Market size and forecast, by Distribution Channel
- 7.4.5.5. South Korea
- 7.4.5.5.1. Key market trends, growth factors and opportunities
- 7.4.5.5.2. Market size and forecast, by Product Type
- 7.4.5.5.3. Market size and forecast, by Type
- 7.4.5.5.4. Market size and forecast, by Distribution Channel
- 7.4.5.6. Rest of Asia-Pacific
- 7.4.5.6.1. Key market trends, growth factors and opportunities
- 7.4.5.6.2. Market size and forecast, by Product Type
- 7.4.5.6.3. Market size and forecast, by Type
- 7.4.5.6.4. Market size and forecast, by Distribution Channel
- 7.5. LAMEA
- 7.5.1. Key trends and opportunities
- 7.5.2. Market size and forecast, by Product Type
- 7.5.3. Market size and forecast, by Type
- 7.5.4. Market size and forecast, by Distribution Channel
- 7.5.5. Market size and forecast, by country
- 7.5.5.1. Brazil
- 7.5.5.1.1. Key market trends, growth factors and opportunities
- 7.5.5.1.2. Market size and forecast, by Product Type
- 7.5.5.1.3. Market size and forecast, by Type
- 7.5.5.1.4. Market size and forecast, by Distribution Channel
- 7.5.5.2. Saudi Arabia
- 7.5.5.2.1. Key market trends, growth factors and opportunities
- 7.5.5.2.2. Market size and forecast, by Product Type
- 7.5.5.2.3. Market size and forecast, by Type
- 7.5.5.2.4. Market size and forecast, by Distribution Channel
- 7.5.5.3. South Africa
- 7.5.5.3.1. Key market trends, growth factors and opportunities
- 7.5.5.3.2. Market size and forecast, by Product Type
- 7.5.5.3.3. Market size and forecast, by Type
- 7.5.5.3.4. Market size and forecast, by Distribution Channel
- 7.5.5.4. Rest of LAMEA
- 7.5.5.4.1. Key market trends, growth factors and opportunities
- 7.5.5.4.2. Market size and forecast, by Product Type
- 7.5.5.4.3. Market size and forecast, by Type
- 7.5.5.4.4. Market size and forecast, by Distribution Channel
CHAPTER 8: COMPETITIVE LANDSCAPE
- 8.1. Introduction
- 8.2. Top winning strategies
- 8.3. Product Mapping of Top 10 Player
- 8.4. Competitive Dashboard
- 8.5. Competitive Heatmap
- 8.6. Top player positioning, 2021
CHAPTER 9: COMPANY PROFILES
- 9.1. Viatris Inc.
- 9.1.1. Company overview
- 9.1.2. Key Executives
- 9.1.3. Company snapshot
- 9.1.4. Operating business segments
- 9.1.5. Product portfolio
- 9.1.6. Business performance
- 9.2. Johnson and Johnson
- 9.2.1. Company overview
- 9.2.2. Key Executives
- 9.2.3. Company snapshot
- 9.2.4. Operating business segments
- 9.2.5. Product portfolio
- 9.2.6. Business performance
- 9.3. Teva Pharmaceutical Industries Ltd.
- 9.3.1. Company overview
- 9.3.2. Key Executives
- 9.3.3. Company snapshot
- 9.3.4. Operating business segments
- 9.3.5. Product portfolio
- 9.3.6. Business performance
- 9.3.7. Key strategic moves and developments
- 9.4. Hisamitsu Pharmaceutical Co.,Inc.
- 9.4.1. Company overview
- 9.4.2. Key Executives
- 9.4.3. Company snapshot
- 9.4.4. Operating business segments
- 9.4.5. Product portfolio
- 9.4.6. Business performance
- 9.4.7. Key strategic moves and developments
- 9.5. Endo International plc.
- 9.5.1. Company overview
- 9.5.2. Key Executives
- 9.5.3. Company snapshot
- 9.5.4. Operating business segments
- 9.5.5. Product portfolio
- 9.5.6. Business performance
- 9.6. NEXGEL Advanced Hydrogel Solutions
- 9.6.1. Company overview
- 9.6.2. Key Executives
- 9.6.3. Company snapshot
- 9.6.4. Operating business segments
- 9.6.5. Product portfolio
- 9.7. Purdue Pharma L.P.
- 9.7.1. Company overview
- 9.7.2. Key Executives
- 9.7.3. Company snapshot
- 9.7.4. Operating business segments
- 9.7.5. Product portfolio
- 9.8. Sorrento Therapeutics Inc.
- 9.8.1. Company overview
- 9.8.2. Key Executives
- 9.8.3. Company snapshot
- 9.8.4. Operating business segments
- 9.8.5. Product portfolio
- 9.8.6. Key strategic moves and developments
- 9.9. Amneal Pharmaceuticals LLC
- 9.9.1. Company overview
- 9.9.2. Key Executives
- 9.9.3. Company snapshot
- 9.9.4. Operating business segments
- 9.9.5. Product portfolio
- 9.9.6. Business performance
- 9.9.7. Key strategic moves and developments
- 9.10. Grunenthal
- 9.10.1. Company overview
- 9.10.2. Key Executives
- 9.10.3. Company snapshot
- 9.10.4. Operating business segments
- 9.10.5. Product portfolio
- 9.10.6. Business performance
- 9.10.7. Key strategic moves and developments