 |
市場調査レポート
商品コード
1298186
インダストリー4.0市場:技術タイプ別、エンドユーザー別:世界の機会分析と産業予測、2021-2031年Industry 4.0 Market By Technology Type, By End User : Global Opportunity Analysis and Industry Forecast, 2021-2031 |
||||||

| インダストリー4.0市場:技術タイプ別、エンドユーザー別:世界の機会分析と産業予測、2021-2031年 |
|
出版日: 2023年03月01日
発行: Allied Market Research
ページ情報: 英文 411 Pages
納期: 2~3営業日
|
- 全表示
- 概要
- 図表
- 目次
インダストリー4.0は、企業が商品を生産し、強化し、普及させる方法を変革しています。
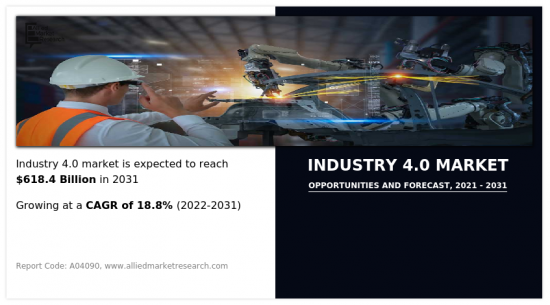
モノのインターネット(IoT)、クラウドコンピューティング、アナリティクス、AI、機械学習は、メーカーが製造プロセスに取り入れている最先端技術の1つです。高度なセンサー、組込みソフトウェア、ロボットはすべて、意思決定に役立つデータを収集・分析する「スマート工場」で採用されています。ERP、サプライチェーン、カスタマーサポート、その他の企業システムからの業務データを生産業務からのデータと組み合わせると、以前はアーカイブされていた情報からさらに大きな価値が生み出されます。さらに、工場、倉庫、製造施設における自動化ツールや自動化機器の導入の増加、積層造形への投資の増加、5G、loT、AI、MLなどの新しいデジタル技術の出現により、インダストリー4.0市場には大量の需要が見込まれています。
さらに、産業用ロボットの採用増加や積層造形の導入増加といった要因が、主にインダストリー4.0市場の成長を後押ししています。しかし、産業用ロボットの高価な導入コストや、産業用ロボットの統合・相互運用性の複雑さが、市場の成長をある程度妨げています。さらに、クラウドオートメーション分野での5G採用の増加は、予測期間中の市場成長に有利な機会を提供すると予想されます。
技術タイプ別に見ると、インダストリー4.0は、位置、長さ、高さ、外観、転位の変化など、工業生産設備における様々な変遷を検出、測定、分析、処理するために不可欠な要素であるため、2021年には産業オートメーションセグメントがインダストリー4.0市場シェアを独占し、予測期間中もこの支配が続くと予想されます。しかし、ブロックチェーン分野は、セキュリティ、プライバシー、データのオープン性の強化により、今後数年間で最も高い成長が見込まれています。さらに、ブロックチェーン技術は、サプライチェーンや製造環境に利益をもたらすと広く認識されています。
地域別では、インダストリー4.0市場は2021年に北米が支配的であり、予測期間中もその地位を維持すると予想されます。これは、継続的な技術的ブレークスルー、地域政府からの財政支援、製造部門全体でリアルタイムの品質管理とリアルタイムの可視性を達成するための取り組みによるものです。米国は大規模な産業基盤を持ち、高い生産能力を持つ企業が複数あるため、北米のインダストリー4.0市場を独占すると予想されます。しかし、アジア太平洋は、分析、自動化、機械学習アルゴリズムにより、人間のオペレーターが詳細な作業のかなりの割合を行う必要がなくなったため、今後数年間で最も高い成長が見込まれています。さらに、人工知能と機械学習は、事業運営に可視性、予測可能性、自動化を与える洞察を生み出すことができます。
セグメントレビュー
目次
第1章 イントロダクション
第2章 エグゼクティブサマリー
第3章 市場概要
- 市場の定義と範囲
- 主な調査結果
- 影響要因
- 主な投資ポケット
- ポーターのファイブフォース分析
- 供給企業の交渉力
- 買い手の交渉力
- 代替品の脅威
- 新規参入業者の脅威
- 競合の激しさ
- 市場力学
- 促進要因
- 産業用ロボット導入の増加
- 積層造形の導入の増加
- 阻害要因
- 産業用ロボットの高価な導入コスト
- 産業用ロボットの統合と相互運用性の複雑さ
- 機会
- クラウドオートメーション分野における5G導入の増加
- 促進要因
- COVID-19:市場への影響分析
第4章 インダストリー4.0市場:技術タイプ別
- 概要
- 市場規模と予測
- 産業オートメーション
- 主要市場動向、成長要因、機会
- 市場規模・予測:地域別
- 市場シェア分析:国別
- 3Dプリンティング
- 主要市場動向、成長要因、機会
- 市場規模・予測:地域別
- 市場シェア分析:国別
- デジタルツイン
- 主な市場動向、成長要因、機会
- 市場規模・予測:地域別
- 市場シェア分析:国別
- 人工知能(AI)・機械学習(ML)
- 主な市場動向、成長要因、機会
- 市場規模・予測:地域別
- 市場シェア分析:国別
- ブロックチェーン
- 主な市場動向、成長要因、機会
- 市場規模・予測:地域別
- 市場シェア分析:国別
- クロスリアリティ(XR)
- 主な市場動向、成長要因、機会
- 市場規模・予測:地域別
- 市場シェア分析:国別
- 産業用モノのインターネット(IIoT)
- 主な市場動向、成長要因、機会
- 市場規模・予測:地域別
- 市場シェア分析:国別
- その他
- 主な市場動向、成長要因、機会
- 市場規模・予測:地域別
- 市場シェア分析:国別
第5章 インダストリー4.0市場:エンドユーザー別
- 概要
- 市場規模と予測
- 製造
- 主要市場動向、成長要因、機会
- 市場規模・予測:地域別
- 市場シェア分析:国別
- 自動車
- 主要市場動向、成長要因、機会
- 市場規模・予測:地域別
- 市場シェア分析:国別
- 石油・ガス
- 主要市場動向、成長要因、機会
- 市場規模・予測:地域別
- 市場シェア分析:国別
- エネルギー・ユーティリティ
- 主な市場動向、成長要因、機会
- 市場規模・予測:地域別
- 市場シェア分析:国別
- 食品・飲料
- 主要市場動向、成長要因、機会
- 市場規模・予測:地域別
- 市場シェア分析:国別
- 航空宇宙・防衛
- 主要市場動向、成長要因、機会
- 市場規模・予測:地域別
- 市場シェア分析:国別
- その他
- 主な市場動向、成長要因、機会
- 市場規模・予測:地域別
- 市場シェア分析:国別
第6章 インダストリー4.0市場:地域別
- 概要
- 市場規模・予測:地域別
- 北米
- 主要動向と機会
- 市場規模・予測:技術タイプ別
- 市場規模・予測:エンドユーザー別
- 市場規模・予測:国別
- 米国
- 主な市場動向、成長要因、機会
- 市場規模・予測:技術タイプ別
- 市場規模・予測:エンドユーザー別
- カナダ
- 主要市場動向、成長要因、機会
- 市場規模・予測:技術タイプ別
- 市場規模・予測:エンドユーザー別
- 欧州
- 主要動向と機会
- 市場規模・予測:技術タイプ別
- 市場規模・予測:エンドユーザー別
- 市場規模・予測:国別
- 英国
- 主要市場動向、成長要因、機会
- 市場規模・予測:技術タイプ別
- 市場規模・予測:エンドユーザー別
- ドイツ
- 主要市場動向、成長要因、機会
- 市場規模・予測:技術タイプ別
- 市場規模・予測:エンドユーザー別
- フランス
- 主要市場動向、成長要因、機会
- 市場規模・予測:技術タイプ別
- 市場規模・予測:エンドユーザー別
- イタリア
- 主要市場動向、成長要因、機会
- 市場規模・予測:技術タイプ別
- 市場規模・予測:エンドユーザー別
- スペイン
- 主要市場動向、成長要因、機会
- 市場規模・予測:技術タイプ別
- 市場規模・予測:エンドユーザー別
- オランダ
- 主要市場動向、成長要因、機会
- 市場規模・予測:技術タイプ別
- 市場規模・予測:エンドユーザー別
- その他欧州
- 主要市場動向、成長要因、機会
- 市場規模・予測:技術タイプ別
- 市場規模・予測:エンドユーザー別
- アジア太平洋地域
- 主要動向と機会
- 市場規模・予測:技術タイプ別
- 市場規模・予測:エンドユーザー別
- 市場規模・予測:国別
- 中国
- 主要市場動向、成長要因、機会
- 市場規模・予測:技術タイプ別
- 市場規模・予測:エンドユーザー別
- インド
- 主要市場動向、成長要因、機会
- 市場規模・予測:技術タイプ別
- 市場規模・予測:エンドユーザー別
- 日本
- 主要市場動向、成長要因、機会
- 市場規模・予測:技術タイプ別
- 市場規模・予測:エンドユーザー別
- オーストラリア
- 主要市場動向、成長要因、機会
- 市場規模・予測:技術タイプ別
- 市場規模・予測:エンドユーザー別
- 韓国
- 主要市場動向、成長要因、機会
- 市場規模・予測:技術タイプ別
- 市場規模・予測:エンドユーザー別
- その他アジア太平洋地域
- 主要市場動向、成長要因、機会
- 市場規模・予測:技術タイプ別
- 市場規模・予測:エンドユーザー別
- ラテンアメリカ・中東・アフリカ
- 主要動向と機会
- 市場規模・予測:技術タイプ別
- 市場規模・予測:エンドユーザー別
- 市場規模・予測:国別
- ラテンアメリカ
- 主要市場動向、成長要因、機会
- 市場規模・予測:技術タイプ別
- 市場規模・予測:エンドユーザー別
- 中東
- 主要市場動向、成長要因、機会
- 市場規模・予測:技術タイプ別
- 市場規模・予測:エンドユーザー別
- アフリカ
- 主要市場動向、成長要因、機会
- 市場規模・予測:技術タイプ別
- 市場規模・予測:エンドユーザー別
第7章 競合情勢
- イントロダクション
- 主要成功戦略
- 主要10社の製品マッピング
- 競合ダッシュボード
- 競合ヒートマップ
- トップ企業のポジショニング(2021年
第8章 企業プロファイル
- ABB Ltd.
- Siemens AG
- Cognex Corporation
- Schneider Electric SE
- Honeywell International Inc.
- Emerson Electric Co.,
- Rockwell Automation Inc.
- General Electric Company
- Cisco Systems Inc.
- International Business Machines Corporation
LIST OF TABLES
- TABLE 01. GLOBAL INDUSTRY 4.0 MARKET, BY TECHNOLOGY TYPE, 2021-2031 ($BILLION)
- TABLE 02. INDUSTRY 4.0 MARKET FOR INDUSTRY AUTOMATION, BY REGION, 2021-2031 ($BILLION)
- TABLE 03. INDUSTRY 4.0 MARKET FOR 3D PRINTING, BY REGION, 2021-2031 ($BILLION)
- TABLE 04. INDUSTRY 4.0 MARKET FOR DIGITAL TWIN, BY REGION, 2021-2031 ($BILLION)
- TABLE 05. INDUSTRY 4.0 MARKET FOR ARTIFICIAL INTELLIGENCE (AI) AND MACHINE LEARNING (ML), BY REGION, 2021-2031 ($BILLION)
- TABLE 06. INDUSTRY 4.0 MARKET FOR BLOCKCHAIN, BY REGION, 2021-2031 ($BILLION)
- TABLE 07. INDUSTRY 4.0 MARKET FOR EXTENDED REALITY (XR), BY REGION, 2021-2031 ($BILLION)
- TABLE 08. INDUSTRY 4.0 MARKET FOR INDUSTRIAL INTERNET OF THINGS (IIOT), BY REGION, 2021-2031 ($BILLION)
- TABLE 09. INDUSTRY 4.0 MARKET FOR OTHERS, BY REGION, 2021-2031 ($BILLION)
- TABLE 10. GLOBAL INDUSTRY 4.0 MARKET, BY END USER, 2021-2031 ($BILLION)
- TABLE 11. INDUSTRY 4.0 MARKET FOR MANUFACTURING, BY REGION, 2021-2031 ($BILLION)
- TABLE 12. INDUSTRY 4.0 MARKET FOR AUTOMOTIVE, BY REGION, 2021-2031 ($BILLION)
- TABLE 13. INDUSTRY 4.0 MARKET FOR OIL AND GAS, BY REGION, 2021-2031 ($BILLION)
- TABLE 14. INDUSTRY 4.0 MARKET FOR ENERGY AND UTILITIES, BY REGION, 2021-2031 ($BILLION)
- TABLE 15. INDUSTRY 4.0 MARKET FOR FOOD AND BEVERAGES, BY REGION, 2021-2031 ($BILLION)
- TABLE 16. INDUSTRY 4.0 MARKET FOR AEROSPACE AND DEFENSE, BY REGION, 2021-2031 ($BILLION)
- TABLE 17. INDUSTRY 4.0 MARKET FOR OTHERS, BY REGION, 2021-2031 ($BILLION)
- TABLE 18. INDUSTRY 4.0 MARKET, BY REGION, 2021-2031 ($BILLION)
- TABLE 19. NORTH AMERICA INDUSTRY 4.0 MARKET, BY TECHNOLOGY TYPE, 2021-2031 ($BILLION)
- TABLE 20. NORTH AMERICA INDUSTRY 4.0 MARKET, BY END USER, 2021-2031 ($BILLION)
- TABLE 21. NORTH AMERICA INDUSTRY 4.0 MARKET, BY COUNTRY, 2021-2031 ($BILLION)
- TABLE 22. U.S. INDUSTRY 4.0 MARKET, BY TECHNOLOGY TYPE, 2021-2031 ($BILLION)
- TABLE 23. U.S. INDUSTRY 4.0 MARKET, BY END USER, 2021-2031 ($BILLION)
- TABLE 24. CANADA INDUSTRY 4.0 MARKET, BY TECHNOLOGY TYPE, 2021-2031 ($BILLION)
- TABLE 25. CANADA INDUSTRY 4.0 MARKET, BY END USER, 2021-2031 ($BILLION)
- TABLE 26. EUROPE INDUSTRY 4.0 MARKET, BY TECHNOLOGY TYPE, 2021-2031 ($BILLION)
- TABLE 27. EUROPE INDUSTRY 4.0 MARKET, BY END USER, 2021-2031 ($BILLION)
- TABLE 28. EUROPE INDUSTRY 4.0 MARKET, BY COUNTRY, 2021-2031 ($BILLION)
- TABLE 29. UK INDUSTRY 4.0 MARKET, BY TECHNOLOGY TYPE, 2021-2031 ($BILLION)
- TABLE 30. UK INDUSTRY 4.0 MARKET, BY END USER, 2021-2031 ($BILLION)
- TABLE 31. GERMANY INDUSTRY 4.0 MARKET, BY TECHNOLOGY TYPE, 2021-2031 ($BILLION)
- TABLE 32. GERMANY INDUSTRY 4.0 MARKET, BY END USER, 2021-2031 ($BILLION)
- TABLE 33. FRANCE INDUSTRY 4.0 MARKET, BY TECHNOLOGY TYPE, 2021-2031 ($BILLION)
- TABLE 34. FRANCE INDUSTRY 4.0 MARKET, BY END USER, 2021-2031 ($BILLION)
- TABLE 35. ITALY INDUSTRY 4.0 MARKET, BY TECHNOLOGY TYPE, 2021-2031 ($BILLION)
- TABLE 36. ITALY INDUSTRY 4.0 MARKET, BY END USER, 2021-2031 ($BILLION)
- TABLE 37. SPAIN INDUSTRY 4.0 MARKET, BY TECHNOLOGY TYPE, 2021-2031 ($BILLION)
- TABLE 38. SPAIN INDUSTRY 4.0 MARKET, BY END USER, 2021-2031 ($BILLION)
- TABLE 39. NETHERLANDS INDUSTRY 4.0 MARKET, BY TECHNOLOGY TYPE, 2021-2031 ($BILLION)
- TABLE 40. NETHERLANDS INDUSTRY 4.0 MARKET, BY END USER, 2021-2031 ($BILLION)
- TABLE 41. REST OF EUROPE INDUSTRY 4.0 MARKET, BY TECHNOLOGY TYPE, 2021-2031 ($BILLION)
- TABLE 42. REST OF EUROPE INDUSTRY 4.0 MARKET, BY END USER, 2021-2031 ($BILLION)
- TABLE 43. ASIA-PACIFIC INDUSTRY 4.0 MARKET, BY TECHNOLOGY TYPE, 2021-2031 ($BILLION)
- TABLE 44. ASIA-PACIFIC INDUSTRY 4.0 MARKET, BY END USER, 2021-2031 ($BILLION)
- TABLE 45. ASIA-PACIFIC INDUSTRY 4.0 MARKET, BY COUNTRY, 2021-2031 ($BILLION)
- TABLE 46. CHINA INDUSTRY 4.0 MARKET, BY TECHNOLOGY TYPE, 2021-2031 ($BILLION)
- TABLE 47. CHINA INDUSTRY 4.0 MARKET, BY END USER, 2021-2031 ($BILLION)
- TABLE 48. INDIA INDUSTRY 4.0 MARKET, BY TECHNOLOGY TYPE, 2021-2031 ($BILLION)
- TABLE 49. INDIA INDUSTRY 4.0 MARKET, BY END USER, 2021-2031 ($BILLION)
- TABLE 50. JAPAN INDUSTRY 4.0 MARKET, BY TECHNOLOGY TYPE, 2021-2031 ($BILLION)
- TABLE 51. JAPAN INDUSTRY 4.0 MARKET, BY END USER, 2021-2031 ($BILLION)
- TABLE 52. AUSTRALIA INDUSTRY 4.0 MARKET, BY TECHNOLOGY TYPE, 2021-2031 ($BILLION)
- TABLE 53. AUSTRALIA INDUSTRY 4.0 MARKET, BY END USER, 2021-2031 ($BILLION)
- TABLE 54. SOUTH KOREA INDUSTRY 4.0 MARKET, BY TECHNOLOGY TYPE, 2021-2031 ($BILLION)
- TABLE 55. SOUTH KOREA INDUSTRY 4.0 MARKET, BY END USER, 2021-2031 ($BILLION)
- TABLE 56. REST OF ASIA-PACIFIC INDUSTRY 4.0 MARKET, BY TECHNOLOGY TYPE, 2021-2031 ($BILLION)
- TABLE 57. REST OF ASIA-PACIFIC INDUSTRY 4.0 MARKET, BY END USER, 2021-2031 ($BILLION)
- TABLE 58. LAMEA INDUSTRY 4.0 MARKET, BY TECHNOLOGY TYPE, 2021-2031 ($BILLION)
- TABLE 59. LAMEA INDUSTRY 4.0 MARKET, BY END USER, 2021-2031 ($BILLION)
- TABLE 60. LAMEA INDUSTRY 4.0 MARKET, BY COUNTRY, 2021-2031 ($BILLION)
- TABLE 61. LATIN AMERICA INDUSTRY 4.0 MARKET, BY TECHNOLOGY TYPE, 2021-2031 ($BILLION)
- TABLE 62. LATIN AMERICA INDUSTRY 4.0 MARKET, BY END USER, 2021-2031 ($BILLION)
- TABLE 63. MIDDLE EAST INDUSTRY 4.0 MARKET, BY TECHNOLOGY TYPE, 2021-2031 ($BILLION)
- TABLE 64. MIDDLE EAST INDUSTRY 4.0 MARKET, BY END USER, 2021-2031 ($BILLION)
- TABLE 65. AFRICA INDUSTRY 4.0 MARKET, BY TECHNOLOGY TYPE, 2021-2031 ($BILLION)
- TABLE 66. AFRICA INDUSTRY 4.0 MARKET, BY END USER, 2021-2031 ($BILLION)
- TABLE 67. ABB LTD.: KEY EXECUTIVES
- TABLE 68. ABB LTD.: COMPANY SNAPSHOT
- TABLE 69. ABB LTD.: SERVICE SEGMENTS
- TABLE 70. ABB LTD.: PRODUCT PORTFOLIO
- TABLE 71. ABB LTD.: KEY STRATERGIES
- TABLE 72. SIEMENS AG: KEY EXECUTIVES
- TABLE 73. SIEMENS AG: COMPANY SNAPSHOT
- TABLE 74. SIEMENS AG: PRODUCT SEGMENTS
- TABLE 75. SIEMENS AG: PRODUCT PORTFOLIO
- TABLE 76. SIEMENS AG: KEY STRATERGIES
- TABLE 77. COGNEX CORPORATION: KEY EXECUTIVES
- TABLE 78. COGNEX CORPORATION: COMPANY SNAPSHOT
- TABLE 79. COGNEX CORPORATION: SERVICE SEGMENTS
- TABLE 80. COGNEX CORPORATION: PRODUCT PORTFOLIO
- TABLE 81. COGNEX CORPORATION: KEY STRATERGIES
- TABLE 82. SCHNEIDER ELECTRIC SE: KEY EXECUTIVES
- TABLE 83. SCHNEIDER ELECTRIC SE: COMPANY SNAPSHOT
- TABLE 84. SCHNEIDER ELECTRIC SE: SERVICE SEGMENTS
- TABLE 85. SCHNEIDER ELECTRIC SE: PRODUCT PORTFOLIO
- TABLE 86. SCHNEIDER ELECTRIC SE: KEY STRATERGIES
- TABLE 87. HONEYWELL INTERNATIONAL INC.: KEY EXECUTIVES
- TABLE 88. HONEYWELL INTERNATIONAL INC.: COMPANY SNAPSHOT
- TABLE 89. HONEYWELL INTERNATIONAL INC.: PRODUCT SEGMENTS
- TABLE 90. HONEYWELL INTERNATIONAL INC.: PRODUCT PORTFOLIO
- TABLE 91. HONEYWELL INTERNATIONAL INC.: KEY STRATERGIES
- TABLE 92. EMERSON ELECTRIC CO.,: KEY EXECUTIVES
- TABLE 93. EMERSON ELECTRIC CO.,: COMPANY SNAPSHOT
- TABLE 94. EMERSON ELECTRIC CO.,: SERVICE SEGMENTS
- TABLE 95. EMERSON ELECTRIC CO.,: PRODUCT PORTFOLIO
- TABLE 96. EMERSON ELECTRIC CO.,: KEY STRATERGIES
- TABLE 97. ROCKWELL AUTOMATION INC.: KEY EXECUTIVES
- TABLE 98. ROCKWELL AUTOMATION INC.: COMPANY SNAPSHOT
- TABLE 99. ROCKWELL AUTOMATION INC.: SERVICE SEGMENTS
- TABLE 100. ROCKWELL AUTOMATION INC.: PRODUCT PORTFOLIO
- TABLE 101. ROCKWELL AUTOMATION INC.: KEY STRATERGIES
- TABLE 102. GENERAL ELECTRIC COMPANY: KEY EXECUTIVES
- TABLE 103. GENERAL ELECTRIC COMPANY: COMPANY SNAPSHOT
- TABLE 104. GENERAL ELECTRIC COMPANY: PRODUCT SEGMENTS
- TABLE 105. GENERAL ELECTRIC COMPANY: PRODUCT PORTFOLIO
- TABLE 106. GENERAL ELECTRIC COMPANY: KEY STRATERGIES
- TABLE 107. CISCO SYSTEMS INC.: KEY EXECUTIVES
- TABLE 108. CISCO SYSTEMS INC.: COMPANY SNAPSHOT
- TABLE 109. CISCO SYSTEMS INC.: PRODUCT SEGMENTS
- TABLE 110. CISCO SYSTEMS INC.: PRODUCT PORTFOLIO
- TABLE 111. CISCO SYSTEMS INC.: KEY STRATERGIES
- TABLE 112. INTERNATIONAL BUSINESS MACHINES CORPORATION: KEY EXECUTIVES
- TABLE 113. INTERNATIONAL BUSINESS MACHINES CORPORATION: COMPANY SNAPSHOT
- TABLE 114. INTERNATIONAL BUSINESS MACHINES CORPORATION: SERVICE SEGMENTS
- TABLE 115. INTERNATIONAL BUSINESS MACHINES CORPORATION: PRODUCT PORTFOLIO
- TABLE 116. INTERNATIONAL BUSINESS MACHINES CORPORATION: KEY STRATERGIES
LIST OF FIGURES
- FIGURE 01. INDUSTRY 4.0 MARKET, 2021-2031
- FIGURE 02. SEGMENTATION OF INDUSTRY 4.0 MARKET, 2021-2031
- FIGURE 03. TOP INVESTMENT POCKETS IN INDUSTRY 4.0 MARKET (2022-2031)
- FIGURE 04. LOW BARGAINING POWER OF SUPPLIERS
- FIGURE 05. LOW BARGAINING POWER OF BUYERS
- FIGURE 06. LOW THREAT OF SUBSTITUTES
- FIGURE 07. LOW THREAT OF NEW ENTRANTS
- FIGURE 08. LOW INTENSITY OF RIVALRY
- FIGURE 09. DRIVERS, RESTRAINTS AND OPPORTUNITIES: GLOBALINDUSTRY 4.0 MARKET
- FIGURE 10. INDUSTRY 4.0 MARKET, BY TECHNOLOGY TYPE, 2021(%)
- FIGURE 11. COMPARATIVE SHARE ANALYSIS OF INDUSTRY 4.0 MARKET FOR INDUSTRY AUTOMATION, BY COUNTRY 2021 AND 2031(%)
- FIGURE 12. COMPARATIVE SHARE ANALYSIS OF INDUSTRY 4.0 MARKET FOR 3D PRINTING, BY COUNTRY 2021 AND 2031(%)
- FIGURE 13. COMPARATIVE SHARE ANALYSIS OF INDUSTRY 4.0 MARKET FOR DIGITAL TWIN, BY COUNTRY 2021 AND 2031(%)
- FIGURE 14. COMPARATIVE SHARE ANALYSIS OF INDUSTRY 4.0 MARKET FOR ARTIFICIAL INTELLIGENCE (AI) AND MACHINE LEARNING (ML), BY COUNTRY 2021 AND 2031(%)
- FIGURE 15. COMPARATIVE SHARE ANALYSIS OF INDUSTRY 4.0 MARKET FOR BLOCKCHAIN, BY COUNTRY 2021 AND 2031(%)
- FIGURE 16. COMPARATIVE SHARE ANALYSIS OF INDUSTRY 4.0 MARKET FOR EXTENDED REALITY (XR), BY COUNTRY 2021 AND 2031(%)
- FIGURE 17. COMPARATIVE SHARE ANALYSIS OF INDUSTRY 4.0 MARKET FOR INDUSTRIAL INTERNET OF THINGS (IIOT), BY COUNTRY 2021 AND 2031(%)
- FIGURE 18. COMPARATIVE SHARE ANALYSIS OF INDUSTRY 4.0 MARKET FOR OTHERS, BY COUNTRY 2021 AND 2031(%)
- FIGURE 19. INDUSTRY 4.0 MARKET, BY END USER, 2021(%)
- FIGURE 20. COMPARATIVE SHARE ANALYSIS OF INDUSTRY 4.0 MARKET FOR MANUFACTURING, BY COUNTRY 2021 AND 2031(%)
- FIGURE 21. COMPARATIVE SHARE ANALYSIS OF INDUSTRY 4.0 MARKET FOR AUTOMOTIVE, BY COUNTRY 2021 AND 2031(%)
- FIGURE 22. COMPARATIVE SHARE ANALYSIS OF INDUSTRY 4.0 MARKET FOR OIL AND GAS, BY COUNTRY 2021 AND 2031(%)
- FIGURE 23. COMPARATIVE SHARE ANALYSIS OF INDUSTRY 4.0 MARKET FOR ENERGY AND UTILITIES, BY COUNTRY 2021 AND 2031(%)
- FIGURE 24. COMPARATIVE SHARE ANALYSIS OF INDUSTRY 4.0 MARKET FOR FOOD AND BEVERAGES, BY COUNTRY 2021 AND 2031(%)
- FIGURE 25. COMPARATIVE SHARE ANALYSIS OF INDUSTRY 4.0 MARKET FOR AEROSPACE AND DEFENSE, BY COUNTRY 2021 AND 2031(%)
- FIGURE 26. COMPARATIVE SHARE ANALYSIS OF INDUSTRY 4.0 MARKET FOR OTHERS, BY COUNTRY 2021 AND 2031(%)
- FIGURE 27. INDUSTRY 4.0 MARKET BY REGION, 2021
- FIGURE 28. U.S. INDUSTRY 4.0 MARKET, 2021-2031 ($BILLION)
- FIGURE 29. CANADA INDUSTRY 4.0 MARKET, 2021-2031 ($BILLION)
- FIGURE 30. UK INDUSTRY 4.0 MARKET, 2021-2031 ($BILLION)
- FIGURE 31. GERMANY INDUSTRY 4.0 MARKET, 2021-2031 ($BILLION)
- FIGURE 32. FRANCE INDUSTRY 4.0 MARKET, 2021-2031 ($BILLION)
- FIGURE 33. ITALY INDUSTRY 4.0 MARKET, 2021-2031 ($BILLION)
- FIGURE 34. SPAIN INDUSTRY 4.0 MARKET, 2021-2031 ($BILLION)
- FIGURE 35. NETHERLANDS INDUSTRY 4.0 MARKET, 2021-2031 ($BILLION)
- FIGURE 36. REST OF EUROPE INDUSTRY 4.0 MARKET, 2021-2031 ($BILLION)
- FIGURE 37. CHINA INDUSTRY 4.0 MARKET, 2021-2031 ($BILLION)
- FIGURE 38. INDIA INDUSTRY 4.0 MARKET, 2021-2031 ($BILLION)
- FIGURE 39. JAPAN INDUSTRY 4.0 MARKET, 2021-2031 ($BILLION)
- FIGURE 40. AUSTRALIA INDUSTRY 4.0 MARKET, 2021-2031 ($BILLION)
- FIGURE 41. SOUTH KOREA INDUSTRY 4.0 MARKET, 2021-2031 ($BILLION)
- FIGURE 42. REST OF ASIA-PACIFIC INDUSTRY 4.0 MARKET, 2021-2031 ($BILLION)
- FIGURE 43. LATIN AMERICA INDUSTRY 4.0 MARKET, 2021-2031 ($BILLION)
- FIGURE 44. MIDDLE EAST INDUSTRY 4.0 MARKET, 2021-2031 ($BILLION)
- FIGURE 45. AFRICA INDUSTRY 4.0 MARKET, 2021-2031 ($BILLION)
- FIGURE 46. TOP WINNING STRATEGIES, BY YEAR
- FIGURE 47. TOP WINNING STRATEGIES, BY DEVELOPMENT
- FIGURE 48. TOP WINNING STRATEGIES, BY COMPANY
- FIGURE 49. PRODUCT MAPPING OF TOP 10 PLAYERS
- FIGURE 50. COMPETITIVE DASHBOARD
- FIGURE 51. COMPETITIVE HEATMAP: INDUSTRY 4.0 MARKET
- FIGURE 52. TOP PLAYER POSITIONING, 2021
- FIGURE 53. ABB LTD.: NET REVENUE, 2020-2022 ($MILLION)
- FIGURE 54. ABB LTD.: RESEARCH & DEVELOPMENT EXPENDITURE, 2020-2022 ($MILLION)
- FIGURE 55. ABB LTD.: REVENUE SHARE BY REGION, 2021 (%)
- FIGURE 56. ABB LTD.: REVENUE SHARE BY SEGMENT, 2021 (%)
- FIGURE 57. SIEMENS AG: NET REVENUE, 2020-2022 ($MILLION)
- FIGURE 58. SIEMENS AG: REVENUE SHARE BY SEGMENT, 2022 (%)
- FIGURE 59. SIEMENS AG: REVENUE SHARE BY REGION, 2022 (%)
- FIGURE 60. COGNEX CORPORATION: NET REVENUE, 2019-2021 ($MILLION)
- FIGURE 61. COGNEX CORPORATION: RESEARCH & DEVELOPMENT EXPENDITURE, 2019-2021
- FIGURE 62. COGNEX CORPORATION: REVENUE SHARE BY REGION, 2021 (%)
- FIGURE 63. COGNEX CORPORATION: REVENUE SHARE BY SEGMENT, 2021 (%)
- FIGURE 64. SCHNEIDER ELECTRIC SE.: NET REVENUE, 2020-2022 ($MILLION)
- FIGURE 65. SCHNEIDER ELECTRIC SE.: REVENUE SHARE BY SEGMENT, 2022 (%)
- FIGURE 66. HONEYWELL INTERNATIONAL INC.: NET REVENUE, 2020-2022 ($MILLION)
- FIGURE 67. HONEYWELL INTERNATIONAL INC.: REVENUE SHARE BY SEGMENT, 2022 (%)
- FIGURE 68. EMERSON ELECTRIC CO.: NET SALES, 2020-2022 ($MILLION)
- FIGURE 69. EMERSON ELECTRIC CO.: REVENUE SHARE BY SEGMENT, 2021 (%)
- FIGURE 70. EMERSON ELECTRIC CO.: REVENUE SHARE BY REGION, 2021 (%)
- FIGURE 71. ROCKWELL AUTOMATION INC.: NET SALES, 2020-2022 ($MILLION)
- FIGURE 72. ROCKWELL AUTOMATION INC.: REVENUE SHARE BY SEGMENT, 2022 (%)
- FIGURE 73. ROCKWELL AUTOMATION INC.: REVENUE SHARE BY REGION, 2021 (%)
- FIGURE 74. GENERAL ELECTRIC COMPANY: NET REVENUE, 2020-2022 ($MILLION)
- FIGURE 75. GENERAL ELECTRIC COMPANY: REVENUE SHARE BY SEGMENT, 2022 (%)
- FIGURE 76. GENERAL ELECTRIC COMPANY: REVENUE SHARE BY REGION, 2022 (%)
- FIGURE 77. CISCO SYSTEMS INC.: RESEARCH & DEVELOPMENT EXPENDITURE, 2020-2022 ($MILLION)
- FIGURE 78. CISCO SYSTEMS INC.: NET SALES, 2020-2022 ($MILLION)
- FIGURE 79. CISCO SYSTEMS INC.: REVENUE SHARE BY SEGMENT, 2022 (%)
- FIGURE 80. CISCO SYSTEMS INC.: REVENUE SHARE BY REGION, 2022 (%)
- FIGURE 81. INTERNATIONAL BUSINESS MACHINES CORPORATION: NET REVENUE, 2020-2022 ($MILLION)
- FIGURE 82. INTERNATIONAL BUSINESS MACHINES CORPORATION: REVENUE SHARE BY SEGMENT, 2022 (%)
- FIGURE 83. INTERNATIONAL BUSINESS MACHINES CORPORATION: REVENUE SHARE BY REGION, 2021 (%)
Industry 4.0 is transforming how businesses produce, enhance, and disseminate their goods. The Internet of Things (IoT), cloud computing, analytics, AI, and machine learning are among the cutting-edge technologies that manufacturers are incorporating into their manufacturing processes. Advanced sensors, embedded software, and robotics are all featured in these "smart factories," which gather and analyze data to help with decision-making. When operational data from ERP, supply chain, customer support, and other enterprise systems is combined with data from production operations, even greater value from previously archived information is produced. Moreover, a significant amount of demand is anticipated for the industry 4.0 market as a result of the rise in adoption of automated tools and equipment in factories, warehouses, and manufacturing facilities, as well as increased investment in additive manufacturing and the emergence of new digital technologies like 5G, loT, AI, and ML.
Furthermore, factors such as rise in adoption of industrial robots and increase in deployment of additive manufacturing primarily drive the growth of the industry 4.0 market. However, expensive deployment costs of industrial robots and complications in integration and interoperability of Industrial robot hamper the market growth to some extent. Moreover, an increase in adoption of 5G in the field of cloud automation is expected to provide lucrative opportunities for the market growth during the forecast period.
Depending on the technology type, the industry automation segment dominated the industry 4.0 market share in 2021 and is expected to continue this dominance during the forecast period, owing to essential elements of Industry 4.0 to detect, measure, analyze, and process various transitions in industrial production facilities, such as changes in positions, length, height, exterior, and dislocations. However, the blockchain segment is expected to witness the highest growth in the upcoming years, owing to enhanced security, privacy, and data openness. Moreover, blockchain technology is widely recognized to benefit the supply chain and manufacturing environments.
Region wise, the industry 4.0 market was dominated by North America in 2021 and is expected to retain its position during the forecast period, owing to to ongoing technical breakthroughs, financial assistance from regional governments, and initiatives to achieve real-time quality control and real-time visibility across the manufacturing sector. The U.S. has a sizable industrial base and several businesses with high production capacities; hence it is anticipated to dominate the North America industry 4.0 market. However, Asia-Pacific is expected to witness the highest growth in the upcoming years, owing to the analytics, automation, and machine-learning algorithms that have released human operators from performing a significant percentage of the detailed work. Moreover, Artificial intelligence and machine learning can generate insights that give business operations visibility, predictability, and automation.
Segment Review
The industry 4.0 market is segmented on the basis of technology, end user, and region. On the basis of technology, it is segregated into industry automation, 3D printing, digital twin, artificial intelligence (AI) and machine learning (ML), blockchain, extended reality (XR), industrial internet of things (IIoT), others. On the basis of end user, it is divided into manufacturing, automotive, oil and gas, energy and utilities, food and beverages, aerospace and defense, others. On the basis of region, it is analyzed across North America, Europe, Asia-Pacific, and LAMEA.
The global industry 4.0 market is dominated by key players such as Cognex Corporation, Schneider Electric SE, Emerson Electric Co., Rockwell Automation Inc., Cisco Systems Inc., ABB Ltd., Siemens AG, Honeywell International Inc., General Electric Company, International Business Machines Corporation. These players have adopted various strategies to increase their market penetration and strengthen their position in the industry.
Key Benefits For Stakeholders
- This report provides a quantitative analysis of the market segments, current trends, estimations, and dynamics of the industry 4.0 market analysis from 2021 to 2031 to identify the prevailing industry 4.0 market opportunities.
- The market research is offered along with information related to key drivers, restraints, and opportunities.
- Porter's five forces analysis highlights the potency of buyers and suppliers to enable stakeholders make profit-oriented business decisions and strengthen their supplier-buyer network.
- In-depth analysis of the industry 4.0 market segmentation assists to determine the prevailing market opportunities.
- Major countries in each region are mapped according to their revenue contribution to the global market.
- Market player positioning facilitates benchmarking and provides a clear understanding of the present position of the market players.
- The report includes the analysis of the regional as well as global industry 4.0 market trends, key players, market segments, application areas, and market growth strategies.
Key Market Segments
By Technology Type
- Industry Automation
- 3D Printing
- Digital Twin
- Artificial Intelligence (AI) and Machine Learning (ML)
- BlockChain
- Extended Reality (XR)
- Industrial Internet of Things (IIoT)
- Others
By End User
- Manufacturing
- Automotive
- Oil and Gas
- Energy and Utilities
- Food and Beverages
- Aerospace and Defense
- Others
By Region
- North America
- U.S.
- Canada
- Europe
- UK
- Germany
- France
- Italy
- Spain
- Netherlands
- Rest of Europe
- Asia-Pacific
- China
- India
- Japan
- Australia
- South Korea
- Rest of Asia-Pacific
- LAMEA
- Latin America
- Middle East
- Africa
Key Market Players:
- Cognex Corporation
- Schneider Electric SE
- Emerson Electric Co.,
- Rockwell Automation Inc.
- Cisco Systems Inc.
- ABB Ltd.
- Siemens AG
- Honeywell International Inc.
- General Electric Company
- International Business Machines Corporation
TABLE OF CONTENTS
CHAPTER 1: INTRODUCTION
- 1.1. Report description
- 1.2. Key market segments
- 1.3. Key benefits to the stakeholders
- 1.4. Research Methodology
- 1.4.1. Primary research
- 1.4.2. Secondary research
- 1.4.3. Analyst tools and models
CHAPTER 2: EXECUTIVE SUMMARY
- 2.1. CXO Perspective
CHAPTER 3: MARKET OVERVIEW
- 3.1. Market definition and scope
- 3.2. Key findings
- 3.2.1. Top impacting factors
- 3.2.2. Top investment pockets
- 3.3. Porter's five forces analysis
- 3.3.1. Bargaining power of suppliers
- 3.3.2. Bargaining power of buyers
- 3.3.3. Threat of substitutes
- 3.3.4. Threat of new entrants
- 3.3.5. Intensity of rivalry
- 3.4. Market dynamics
- 3.4.1. Drivers
- 3.4.1.1. Rise in adoption of industrial robots
- 3.4.1.2. Rise in deployment of additive manufacturing
- 3.4.1. Drivers
- 3.4.2. Restraints
- 3.4.2.1. Expensive deployment costs of industrial robots
- 3.4.2.2. Complications in integration and interoperability of Industrial robot
- 3.4.3. Opportunities
- 3.4.3.1. Increase in adoption of 5G in the field of cloud automation
- 3.5. COVID-19 Impact Analysis on the market
CHAPTER 4: INDUSTRY 4.0 MARKET, BY TECHNOLOGY TYPE
- 4.1. Overview
- 4.1.1. Market size and forecast
- 4.2. Industry Automation
- 4.2.1. Key market trends, growth factors and opportunities
- 4.2.2. Market size and forecast, by region
- 4.2.3. Market share analysis by country
- 4.3. 3D Printing
- 4.3.1. Key market trends, growth factors and opportunities
- 4.3.2. Market size and forecast, by region
- 4.3.3. Market share analysis by country
- 4.4. Digital Twin
- 4.4.1. Key market trends, growth factors and opportunities
- 4.4.2. Market size and forecast, by region
- 4.4.3. Market share analysis by country
- 4.5. Artificial Intelligence (AI) and Machine Learning (ML)
- 4.5.1. Key market trends, growth factors and opportunities
- 4.5.2. Market size and forecast, by region
- 4.5.3. Market share analysis by country
- 4.6. BlockChain
- 4.6.1. Key market trends, growth factors and opportunities
- 4.6.2. Market size and forecast, by region
- 4.6.3. Market share analysis by country
- 4.7. Extended Reality (XR)
- 4.7.1. Key market trends, growth factors and opportunities
- 4.7.2. Market size and forecast, by region
- 4.7.3. Market share analysis by country
- 4.8. Industrial Internet of Things (IIoT)
- 4.8.1. Key market trends, growth factors and opportunities
- 4.8.2. Market size and forecast, by region
- 4.8.3. Market share analysis by country
- 4.9. Others
- 4.9.1. Key market trends, growth factors and opportunities
- 4.9.2. Market size and forecast, by region
- 4.9.3. Market share analysis by country
CHAPTER 5: INDUSTRY 4.0 MARKET, BY END USER
- 5.1. Overview
- 5.1.1. Market size and forecast
- 5.2. Manufacturing
- 5.2.1. Key market trends, growth factors and opportunities
- 5.2.2. Market size and forecast, by region
- 5.2.3. Market share analysis by country
- 5.3. Automotive
- 5.3.1. Key market trends, growth factors and opportunities
- 5.3.2. Market size and forecast, by region
- 5.3.3. Market share analysis by country
- 5.4. Oil and Gas
- 5.4.1. Key market trends, growth factors and opportunities
- 5.4.2. Market size and forecast, by region
- 5.4.3. Market share analysis by country
- 5.5. Energy and Utilities
- 5.5.1. Key market trends, growth factors and opportunities
- 5.5.2. Market size and forecast, by region
- 5.5.3. Market share analysis by country
- 5.6. Food and Beverages
- 5.6.1. Key market trends, growth factors and opportunities
- 5.6.2. Market size and forecast, by region
- 5.6.3. Market share analysis by country
- 5.7. Aerospace and Defense
- 5.7.1. Key market trends, growth factors and opportunities
- 5.7.2. Market size and forecast, by region
- 5.7.3. Market share analysis by country
- 5.8. Others
- 5.8.1. Key market trends, growth factors and opportunities
- 5.8.2. Market size and forecast, by region
- 5.8.3. Market share analysis by country
CHAPTER 6: INDUSTRY 4.0 MARKET, BY REGION
- 6.1. Overview
- 6.1.1. Market size and forecast By Region
- 6.2. North America
- 6.2.1. Key trends and opportunities
- 6.2.2. Market size and forecast, by Technology Type
- 6.2.3. Market size and forecast, by End User
- 6.2.4. Market size and forecast, by country
- 6.2.4.1. U.S.
- 6.2.4.1.1. Key market trends, growth factors and opportunities
- 6.2.4.1.2. Market size and forecast, by Technology Type
- 6.2.4.1.3. Market size and forecast, by End User
- 6.2.4.2. Canada
- 6.2.4.2.1. Key market trends, growth factors and opportunities
- 6.2.4.2.2. Market size and forecast, by Technology Type
- 6.2.4.2.3. Market size and forecast, by End User
- 6.3. Europe
- 6.3.1. Key trends and opportunities
- 6.3.2. Market size and forecast, by Technology Type
- 6.3.3. Market size and forecast, by End User
- 6.3.4. Market size and forecast, by country
- 6.3.4.1. UK
- 6.3.4.1.1. Key market trends, growth factors and opportunities
- 6.3.4.1.2. Market size and forecast, by Technology Type
- 6.3.4.1.3. Market size and forecast, by End User
- 6.3.4.2. Germany
- 6.3.4.2.1. Key market trends, growth factors and opportunities
- 6.3.4.2.2. Market size and forecast, by Technology Type
- 6.3.4.2.3. Market size and forecast, by End User
- 6.3.4.3. France
- 6.3.4.3.1. Key market trends, growth factors and opportunities
- 6.3.4.3.2. Market size and forecast, by Technology Type
- 6.3.4.3.3. Market size and forecast, by End User
- 6.3.4.4. Italy
- 6.3.4.4.1. Key market trends, growth factors and opportunities
- 6.3.4.4.2. Market size and forecast, by Technology Type
- 6.3.4.4.3. Market size and forecast, by End User
- 6.3.4.5. Spain
- 6.3.4.5.1. Key market trends, growth factors and opportunities
- 6.3.4.5.2. Market size and forecast, by Technology Type
- 6.3.4.5.3. Market size and forecast, by End User
- 6.3.4.6. Netherlands
- 6.3.4.6.1. Key market trends, growth factors and opportunities
- 6.3.4.6.2. Market size and forecast, by Technology Type
- 6.3.4.6.3. Market size and forecast, by End User
- 6.3.4.7. Rest of Europe
- 6.3.4.7.1. Key market trends, growth factors and opportunities
- 6.3.4.7.2. Market size and forecast, by Technology Type
- 6.3.4.7.3. Market size and forecast, by End User
- 6.4. Asia-Pacific
- 6.4.1. Key trends and opportunities
- 6.4.2. Market size and forecast, by Technology Type
- 6.4.3. Market size and forecast, by End User
- 6.4.4. Market size and forecast, by country
- 6.4.4.1. China
- 6.4.4.1.1. Key market trends, growth factors and opportunities
- 6.4.4.1.2. Market size and forecast, by Technology Type
- 6.4.4.1.3. Market size and forecast, by End User
- 6.4.4.2. India
- 6.4.4.2.1. Key market trends, growth factors and opportunities
- 6.4.4.2.2. Market size and forecast, by Technology Type
- 6.4.4.2.3. Market size and forecast, by End User
- 6.4.4.3. Japan
- 6.4.4.3.1. Key market trends, growth factors and opportunities
- 6.4.4.3.2. Market size and forecast, by Technology Type
- 6.4.4.3.3. Market size and forecast, by End User
- 6.4.4.4. Australia
- 6.4.4.4.1. Key market trends, growth factors and opportunities
- 6.4.4.4.2. Market size and forecast, by Technology Type
- 6.4.4.4.3. Market size and forecast, by End User
- 6.4.4.5. South Korea
- 6.4.4.5.1. Key market trends, growth factors and opportunities
- 6.4.4.5.2. Market size and forecast, by Technology Type
- 6.4.4.5.3. Market size and forecast, by End User
- 6.4.4.6. Rest of Asia-Pacific
- 6.4.4.6.1. Key market trends, growth factors and opportunities
- 6.4.4.6.2. Market size and forecast, by Technology Type
- 6.4.4.6.3. Market size and forecast, by End User
- 6.5. LAMEA
- 6.5.1. Key trends and opportunities
- 6.5.2. Market size and forecast, by Technology Type
- 6.5.3. Market size and forecast, by End User
- 6.5.4. Market size and forecast, by country
- 6.5.4.1. Latin America
- 6.5.4.1.1. Key market trends, growth factors and opportunities
- 6.5.4.1.2. Market size and forecast, by Technology Type
- 6.5.4.1.3. Market size and forecast, by End User
- 6.5.4.2. Middle East
- 6.5.4.2.1. Key market trends, growth factors and opportunities
- 6.5.4.2.2. Market size and forecast, by Technology Type
- 6.5.4.2.3. Market size and forecast, by End User
- 6.5.4.3. Africa
- 6.5.4.3.1. Key market trends, growth factors and opportunities
- 6.5.4.3.2. Market size and forecast, by Technology Type
- 6.5.4.3.3. Market size and forecast, by End User
CHAPTER 7: COMPETITIVE LANDSCAPE
- 7.1. Introduction
- 7.2. Top winning strategies
- 7.3. Product Mapping of Top 10 Player
- 7.4. Competitive Dashboard
- 7.5. Competitive Heatmap
- 7.6. Top player positioning, 2021
CHAPTER 8: COMPANY PROFILES
- 8.1. ABB Ltd.
- 8.1.1. Company overview
- 8.1.2. Key Executives
- 8.1.3. Company snapshot
- 8.1.4. Operating business segments
- 8.1.5. Product portfolio
- 8.1.6. Business performance
- 8.1.7. Key strategic moves and developments
- 8.2. Siemens AG
- 8.2.1. Company overview
- 8.2.2. Key Executives
- 8.2.3. Company snapshot
- 8.2.4. Operating business segments
- 8.2.5. Product portfolio
- 8.2.6. Business performance
- 8.2.7. Key strategic moves and developments
- 8.3. Cognex Corporation
- 8.3.1. Company overview
- 8.3.2. Key Executives
- 8.3.3. Company snapshot
- 8.3.4. Operating business segments
- 8.3.5. Product portfolio
- 8.3.6. Business performance
- 8.3.7. Key strategic moves and developments
- 8.4. Schneider Electric SE
- 8.4.1. Company overview
- 8.4.2. Key Executives
- 8.4.3. Company snapshot
- 8.4.4. Operating business segments
- 8.4.5. Product portfolio
- 8.4.6. Business performance
- 8.4.7. Key strategic moves and developments
- 8.5. Honeywell International Inc.
- 8.5.1. Company overview
- 8.5.2. Key Executives
- 8.5.3. Company snapshot
- 8.5.4. Operating business segments
- 8.5.5. Product portfolio
- 8.5.6. Business performance
- 8.5.7. Key strategic moves and developments
- 8.6. Emerson Electric Co.,
- 8.6.1. Company overview
- 8.6.2. Key Executives
- 8.6.3. Company snapshot
- 8.6.4. Operating business segments
- 8.6.5. Product portfolio
- 8.6.6. Business performance
- 8.6.7. Key strategic moves and developments
- 8.7. Rockwell Automation Inc.
- 8.7.1. Company overview
- 8.7.2. Key Executives
- 8.7.3. Company snapshot
- 8.7.4. Operating business segments
- 8.7.5. Product portfolio
- 8.7.6. Business performance
- 8.7.7. Key strategic moves and developments
- 8.8. General Electric Company
- 8.8.1. Company overview
- 8.8.2. Key Executives
- 8.8.3. Company snapshot
- 8.8.4. Operating business segments
- 8.8.5. Product portfolio
- 8.8.6. Business performance
- 8.8.7. Key strategic moves and developments
- 8.9. Cisco Systems Inc.
- 8.9.1. Company overview
- 8.9.2. Key Executives
- 8.9.3. Company snapshot
- 8.9.4. Operating business segments
- 8.9.5. Product portfolio
- 8.9.6. Business performance
- 8.9.7. Key strategic moves and developments
- 8.10. International Business Machines Corporation
- 8.10.1. Company overview
- 8.10.2. Key Executives
- 8.10.3. Company snapshot
- 8.10.4. Operating business segments
- 8.10.5. Product portfolio
- 8.10.6. Business performance
- 8.10.7. Key strategic moves and developments