 |
市場調査レポート
商品コード
1298185
多発性骨髄腫市場:薬剤タイプ別、疾患タイプ別、エンドユーザー別:世界の機会分析と産業予測、2021-2031年Multiple Myeloma Market By Drug Type, By Disease Type, By End User : Global Opportunity Analysis and Industry Forecast, 2021-2031 |
||||||

| 多発性骨髄腫市場:薬剤タイプ別、疾患タイプ別、エンドユーザー別:世界の機会分析と産業予測、2021-2031年 |
|
出版日: 2023年03月01日
発行: Allied Market Research
ページ情報: 英文 411 Pages
納期: 2~3営業日
|
- 全表示
- 概要
- 図表
- 目次
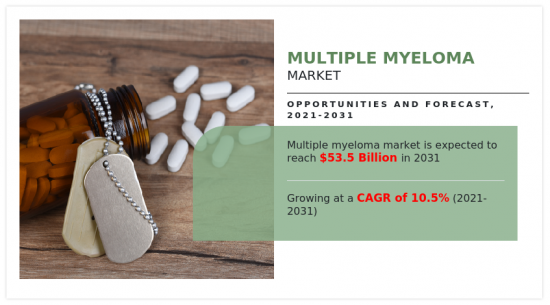
多発性骨髄腫市場の2021年の市場規模は196億6,674万米ドルで、2031年には535億2,176万米ドルに達すると推定され、2022年から2031年までのCAGRは10.5%です。
多発性骨髄腫は、形質細胞と呼ばれる白血球の一種にできるがんです。健康な形質細胞は、微生物を認識して増殖を抑制する抗体を合成することで、感染症との闘いに貢献しています。多発性骨髄腫では、がん化した形質細胞が骨髄に蓄積し、健康な血液細胞を押し出します。多発性骨髄腫の治療には、標的療法、免疫療法、化学療法、副腎皮質ステロイド、骨髄移植、放射線療法など様々な治療法があります。
世界の多発性骨髄腫市場の成長を牽引しているのは、多発性骨髄腫治療薬を製造する市場プレイヤーの増加です。加えて、多発性骨髄腫治療薬の上市数や承認数の増加が市場の成長を促進すると予想されます。例えば、2022年1月、製薬会社のBristol-Myers Squibb社は、B細胞成熟抗原(BCMA)指向性キメラ抗原受容体(CAR)T細胞免疫療法であるアベックマ(イデカブタジェンビクリューセル)を、再発または難治性(R/R)の多発性骨髄腫の成人患者の治療薬として厚生労働省が承認したと発表しました。加えて、多発性骨髄腫の有病率の上昇が多発性骨髄腫治療薬の需要を押し上げ、市場の成長に拍車をかけています。例えば、国際がん研究機関によると、2020年には世界中で約1,76,404例の多発性骨髄腫が報告されています。
さらに、ヘルスケアサービスに対する政府の支出が増加することで、病院や診療所によるがん治療やがん治療薬の導入が促進され、市場の成長に拍車がかかると予想されます。例えば、国家統計局によると、2021年の英国の総医療費は30兆70億米ドルと報告されており、これは2020年の支出に比べ名目ベースで7.4%増加しています。また、メディケア医療サービス政府センター(CMS)によると、2021年の国民医療費(NHE)は2.7%増の4兆3,000億米ドル、1人当たり12,914ドルで、GDPの18.3%を占めると報告されている)。
一方、多発性骨髄腫治療薬、放射線療法、幹細胞移植の高額な費用や、治療薬に伴う副作用が多発性骨髄腫市場の成長を阻害しています。
しかし、米国、カナダ、ドイツなどの新興経済諸国では医療サービスに対する需要が増加しており、市場成長の可能性が高いことから、予測期間中に市場に大きな機会が生まれると期待されています。
世界の多発性骨髄腫市場は、薬剤タイプ、疾患タイプ、エンドユーザー、地域に区分されます。薬剤タイプにより、市場は化学療法、プロテアーゼ阻害剤、モノクローナル抗体、その他に分けられます。疾患タイプ別では、活動性多発性骨髄腫とくすぶり型多発性骨髄腫に二分されます。エンドユーザー別では、病院、診療所、その他に分けられます。
目次
第1章 イントロダクション
第2章 エグゼクティブサマリー
第3章 市場概要
- 市場の定義と範囲
- 主な調査結果
- 影響要因
- 主な投資ポケット
- ポーターのファイブフォース分析
- 供給企業の交渉力
- 買い手の交渉力
- 代替品の脅威
- 新規参入業者の脅威
- 競合の激しさ
- 市場力学
- 促進要因
- 多発性骨髄腫の有病率の上昇
- 多発性骨髄腫治療に対する政府のイニシアチブの増加
- 多発性骨髄腫治療薬を製造する市場プレイヤーの増加
- 抑制要因
- 多発性骨髄腫治療の高額な費用
- 多発性骨髄腫治療の副作用
- 機会
- 多発性骨髄腫治療薬の上市と承認の増加
- 促進要因
- COVID-19による市場への影響分析
第4章 多発性骨髄腫市場:薬剤タイプ別
- 概要
- 市場規模および予測
- 化学療法
- 主要市場動向、成長要因、機会
- 市場規模・予測:地域別
- 市場シェア分析:国別
- プロテアーゼ阻害剤
- 主な市場動向、成長要因、機会
- 市場規模・予測:地域別
- 市場シェア分析:国別
- モノクローナル抗体
- 主要市場動向、成長要因、機会
- 市場規模・予測:地域別
- 市場シェア分析:国別
- その他
- 主な市場動向、成長要因、機会
- 市場規模・予測:地域別
- 市場シェア分析:国別
第5章 多発性骨髄腫市場:疾患タイプ別
- 概要
- 市場規模および予測
- 活動性多発性骨髄腫
- 主要市場動向、成長要因、機会
- 市場規模・予測:地域別
- 市場シェア分析:国別
- くすぶっている多発性骨髄腫
- 主な市場動向、成長要因、機会
- 市場規模・予測:地域別
- 市場シェア分析: 国別
第6章 多発性骨髄腫市場:エンドユーザー別
- 概要
- 市場規模および予測
- 病院
- 主な市場動向、成長要因、機会
- 市場規模・予測:地域別
- 市場シェア分析:国別
- 診療所
- 主な市場動向、成長要因、機会
- 市場規模・予測:地域別
- 市場シェア分析:国別
- その他
- 主な市場動向、成長要因、機会
- 市場規模・予測:地域別
- 市場シェア分析:国別
第7章 多発性骨髄腫市場:地域別
- 概要
- 市場規模・予測:地域別
- 北米
- 主要動向と機会
- 市場規模・予測:薬剤タイプ別
- 市場規模・予測:疾患タイプ別
- 市場規模・予測:エンドユーザー別
- 市場規模・予測:国別
- 米国
- 主要市場動向、成長要因、機会
- 市場規模・予測:薬剤タイプ別
- 市場規模・予測:疾患タイプ別
- 市場規模・予測:エンドユーザー別
- カナダ
- 主要市場動向、成長要因、機会
- 市場規模・予測:薬剤タイプ別
- 市場規模・予測:疾患タイプ別
- 市場規模・予測:エンドユーザー別
- メキシコ
- 主要市場動向、成長要因、機会
- 市場規模・予測:薬物タイプ別
- 市場規模・予測:疾患タイプ別
- 市場規模・予測:エンドユーザー別
- 欧州
- 主要動向と機会
- 市場規模・予測:薬剤タイプ別
- 市場規模・予測:疾患タイプ別
- 市場規模・予測:エンドユーザー別
- 市場規模・予測:国別
- ドイツ
- 主要市場動向、成長要因、機会
- 市場規模・予測:薬剤タイプ別
- 市場規模・予測:疾患タイプ別
- 市場規模・予測:エンドユーザー別
- フランス
- 主要市場動向、成長要因、機会
- 市場規模・予測:薬剤タイプ別
- 市場規模・予測:疾患タイプ別
- 市場規模・予測:エンドユーザー別
- 英国
- 主要市場動向、成長要因、機会
- 市場規模・予測:薬剤タイプ別
- 市場規模・予測:疾患タイプ別
- 市場規模・予測:エンドユーザー別
- イタリア
- 主要市場動向、成長要因、機会
- 市場規模・予測:薬剤タイプ別
- 市場規模・予測:疾患タイプ別
- 市場規模・予測:エンドユーザー別
- スペイン
- 主要市場動向、成長要因、機会
- 市場規模・予測:薬剤タイプ別
- 市場規模・予測:疾患タイプ別
- 市場規模・予測:エンドユーザー別
- その他欧州
- 主要市場動向、成長要因、機会
- 市場規模・予測:薬剤タイプ別
- 市場規模・予測:疾患タイプ別
- 市場規模・予測:エンドユーザー別
- アジア太平洋地域
- 主要動向と機会
- 市場規模・予測:薬物タイプ別
- 市場規模・予測:疾患タイプ別
- 市場規模・予測:エンドユーザー別
- 市場規模・予測:国別
- 日本
- 主要市場動向、成長要因、機会
- 市場規模・予測:薬剤タイプ別
- 市場規模・予測:疾患タイプ別
- 市場規模・予測:エンドユーザー別
- 中国
- 主要市場動向、成長要因、機会
- 市場規模・予測:薬剤タイプ別
- 市場規模・予測:疾患タイプ別
- 市場規模・予測:エンドユーザー別
- インド
- 主要市場動向、成長要因、機会
- 市場規模・予測:薬剤タイプ別
- 市場規模・予測:疾患タイプ別
- 市場規模・予測:エンドユーザー別
- オーストラリア
- 主要市場動向、成長要因、機会
- 市場規模・予測:薬剤タイプ別
- 市場規模・予測:疾患タイプ別
- 市場規模・予測:エンドユーザー別
- 韓国
- 主要市場動向、成長要因、機会
- 市場規模・予測:薬剤タイプ別
- 市場規模・予測:疾患タイプ別
- 市場規模・予測:エンドユーザー別
- その他アジア太平洋地域
- 主要市場動向、成長要因、機会
- 市場規模・予測:薬剤タイプ別
- 市場規模・予測:疾患タイプ別
- 市場規模・予測:エンドユーザー別
- ラテンアメリカ・中東・アフリカ
- 主要動向と機会
- 市場規模・予測:薬剤タイプ別
- 市場規模・予測:疾患タイプ別
- 市場規模・予測:エンドユーザー別
- 市場規模・予測:国別
- ブラジル
- 主要市場動向、成長要因、機会
- 市場規模・予測:薬剤タイプ別
- 市場規模・予測:疾患タイプ別
- 市場規模・予測:エンドユーザー別
- サウジアラビア
- 主要市場動向、成長要因、機会
- 市場規模・予測:薬剤タイプ別
- 市場規模・予測:疾患タイプ別
- 市場規模・予測:エンドユーザー別
- 南アフリカ
- 主要市場動向、成長要因、機会
- 市場規模・予測:薬物タイプ別
- 市場規模・予測:疾患タイプ別
- 市場規模・予測:エンドユーザー別
- その他の地域
- 主要市場動向、成長要因、機会
- 市場規模・予測:薬剤タイプ別
- 市場規模・予測:疾患タイプ別
- 市場規模・予測:エンドユーザー別
第8章 競合情勢
- イントロダクション
- 主要成功戦略
- 主要10社の製品マッピング
- 競合ダッシュボード
- 競合ヒートマップ
- トップ企業のポジショニング(2021年
第9章 企業プロファイル
- Novartis AG
- Bristol-Myers Squibb Company
- Amgen Inc.
- Abbvie Inc
- Sanofi
- Johnson and Johnson
- Baxter International Inc.
- Takeda Pharmaceutical Company Ltd
- Teva Pharmaceutical Industries
- Pfizer Inc.
LIST OF TABLES
- TABLE 01. GLOBAL MULTIPLE MYELOMA MARKET, BY DRUG TYPE, 2021-2031 ($MILLION)
- TABLE 02. MULTIPLE MYELOMA MARKET FOR CHEMOTHERAPY, BY REGION, 2021-2031 ($MILLION)
- TABLE 03. MULTIPLE MYELOMA MARKET FOR PROTEASE INHIBITORS, BY REGION, 2021-2031 ($MILLION)
- TABLE 04. MULTIPLE MYELOMA MARKET FOR MONOCLONAL ANTIBODY, BY REGION, 2021-2031 ($MILLION)
- TABLE 05. MULTIPLE MYELOMA MARKET FOR OTHERS, BY REGION, 2021-2031 ($MILLION)
- TABLE 06. GLOBAL MULTIPLE MYELOMA MARKET, BY DISEASE TYPE, 2021-2031 ($MILLION)
- TABLE 07. MULTIPLE MYELOMA MARKET FOR ACTIVE MULTIPLE MYELOMA, BY REGION, 2021-2031 ($MILLION)
- TABLE 08. MULTIPLE MYELOMA MARKET FOR SMOLDERING MULTIPLE MYELOMA, BY REGION, 2021-2031 ($MILLION)
- TABLE 09. GLOBAL MULTIPLE MYELOMA MARKET, BY END USER, 2021-2031 ($MILLION)
- TABLE 10. MULTIPLE MYELOMA MARKET FOR HOSPITALS, BY REGION, 2021-2031 ($MILLION)
- TABLE 11. MULTIPLE MYELOMA MARKET FOR CLINICS, BY REGION, 2021-2031 ($MILLION)
- TABLE 12. MULTIPLE MYELOMA MARKET FOR OTHERS, BY REGION, 2021-2031 ($MILLION)
- TABLE 13. MULTIPLE MYELOMA MARKET, BY REGION, 2021-2031 ($MILLION)
- TABLE 14. NORTH AMERICA MULTIPLE MYELOMA MARKET, BY DRUG TYPE, 2021-2031 ($MILLION)
- TABLE 15. NORTH AMERICA MULTIPLE MYELOMA MARKET, BY DISEASE TYPE, 2021-2031 ($MILLION)
- TABLE 16. NORTH AMERICA MULTIPLE MYELOMA MARKET, BY END USER, 2021-2031 ($MILLION)
- TABLE 17. NORTH AMERICA MULTIPLE MYELOMA MARKET, BY COUNTRY, 2021-2031 ($MILLION)
- TABLE 18. U.S. MULTIPLE MYELOMA MARKET, BY DRUG TYPE, 2021-2031 ($MILLION)
- TABLE 19. U.S. MULTIPLE MYELOMA MARKET, BY DISEASE TYPE, 2021-2031 ($MILLION)
- TABLE 20. U.S. MULTIPLE MYELOMA MARKET, BY END USER, 2021-2031 ($MILLION)
- TABLE 21. CANADA MULTIPLE MYELOMA MARKET, BY DRUG TYPE, 2021-2031 ($MILLION)
- TABLE 22. CANADA MULTIPLE MYELOMA MARKET, BY DISEASE TYPE, 2021-2031 ($MILLION)
- TABLE 23. CANADA MULTIPLE MYELOMA MARKET, BY END USER, 2021-2031 ($MILLION)
- TABLE 24. MEXICO MULTIPLE MYELOMA MARKET, BY DRUG TYPE, 2021-2031 ($MILLION)
- TABLE 25. MEXICO MULTIPLE MYELOMA MARKET, BY DISEASE TYPE, 2021-2031 ($MILLION)
- TABLE 26. MEXICO MULTIPLE MYELOMA MARKET, BY END USER, 2021-2031 ($MILLION)
- TABLE 27. EUROPE MULTIPLE MYELOMA MARKET, BY DRUG TYPE, 2021-2031 ($MILLION)
- TABLE 28. EUROPE MULTIPLE MYELOMA MARKET, BY DISEASE TYPE, 2021-2031 ($MILLION)
- TABLE 29. EUROPE MULTIPLE MYELOMA MARKET, BY END USER, 2021-2031 ($MILLION)
- TABLE 30. EUROPE MULTIPLE MYELOMA MARKET, BY COUNTRY, 2021-2031 ($MILLION)
- TABLE 31. GERMANY MULTIPLE MYELOMA MARKET, BY DRUG TYPE, 2021-2031 ($MILLION)
- TABLE 32. GERMANY MULTIPLE MYELOMA MARKET, BY DISEASE TYPE, 2021-2031 ($MILLION)
- TABLE 33. GERMANY MULTIPLE MYELOMA MARKET, BY END USER, 2021-2031 ($MILLION)
- TABLE 34. FRANCE MULTIPLE MYELOMA MARKET, BY DRUG TYPE, 2021-2031 ($MILLION)
- TABLE 35. FRANCE MULTIPLE MYELOMA MARKET, BY DISEASE TYPE, 2021-2031 ($MILLION)
- TABLE 36. FRANCE MULTIPLE MYELOMA MARKET, BY END USER, 2021-2031 ($MILLION)
- TABLE 37. UK MULTIPLE MYELOMA MARKET, BY DRUG TYPE, 2021-2031 ($MILLION)
- TABLE 38. UK MULTIPLE MYELOMA MARKET, BY DISEASE TYPE, 2021-2031 ($MILLION)
- TABLE 39. UK MULTIPLE MYELOMA MARKET, BY END USER, 2021-2031 ($MILLION)
- TABLE 40. ITALY MULTIPLE MYELOMA MARKET, BY DRUG TYPE, 2021-2031 ($MILLION)
- TABLE 41. ITALY MULTIPLE MYELOMA MARKET, BY DISEASE TYPE, 2021-2031 ($MILLION)
- TABLE 42. ITALY MULTIPLE MYELOMA MARKET, BY END USER, 2021-2031 ($MILLION)
- TABLE 43. SPAIN MULTIPLE MYELOMA MARKET, BY DRUG TYPE, 2021-2031 ($MILLION)
- TABLE 44. SPAIN MULTIPLE MYELOMA MARKET, BY DISEASE TYPE, 2021-2031 ($MILLION)
- TABLE 45. SPAIN MULTIPLE MYELOMA MARKET, BY END USER, 2021-2031 ($MILLION)
- TABLE 46. REST OF EUROPE MULTIPLE MYELOMA MARKET, BY DRUG TYPE, 2021-2031 ($MILLION)
- TABLE 47. REST OF EUROPE MULTIPLE MYELOMA MARKET, BY DISEASE TYPE, 2021-2031 ($MILLION)
- TABLE 48. REST OF EUROPE MULTIPLE MYELOMA MARKET, BY END USER, 2021-2031 ($MILLION)
- TABLE 49. ASIA-PACIFIC MULTIPLE MYELOMA MARKET, BY DRUG TYPE, 2021-2031 ($MILLION)
- TABLE 50. ASIA-PACIFIC MULTIPLE MYELOMA MARKET, BY DISEASE TYPE, 2021-2031 ($MILLION)
- TABLE 51. ASIA-PACIFIC MULTIPLE MYELOMA MARKET, BY END USER, 2021-2031 ($MILLION)
- TABLE 52. ASIA-PACIFIC MULTIPLE MYELOMA MARKET, BY COUNTRY, 2021-2031 ($MILLION)
- TABLE 53. JAPAN MULTIPLE MYELOMA MARKET, BY DRUG TYPE, 2021-2031 ($MILLION)
- TABLE 54. JAPAN MULTIPLE MYELOMA MARKET, BY DISEASE TYPE, 2021-2031 ($MILLION)
- TABLE 55. JAPAN MULTIPLE MYELOMA MARKET, BY END USER, 2021-2031 ($MILLION)
- TABLE 56. CHINA MULTIPLE MYELOMA MARKET, BY DRUG TYPE, 2021-2031 ($MILLION)
- TABLE 57. CHINA MULTIPLE MYELOMA MARKET, BY DISEASE TYPE, 2021-2031 ($MILLION)
- TABLE 58. CHINA MULTIPLE MYELOMA MARKET, BY END USER, 2021-2031 ($MILLION)
- TABLE 59. INDIA MULTIPLE MYELOMA MARKET, BY DRUG TYPE, 2021-2031 ($MILLION)
- TABLE 60. INDIA MULTIPLE MYELOMA MARKET, BY DISEASE TYPE, 2021-2031 ($MILLION)
- TABLE 61. INDIA MULTIPLE MYELOMA MARKET, BY END USER, 2021-2031 ($MILLION)
- TABLE 62. AUSTRALIA MULTIPLE MYELOMA MARKET, BY DRUG TYPE, 2021-2031 ($MILLION)
- TABLE 63. AUSTRALIA MULTIPLE MYELOMA MARKET, BY DISEASE TYPE, 2021-2031 ($MILLION)
- TABLE 64. AUSTRALIA MULTIPLE MYELOMA MARKET, BY END USER, 2021-2031 ($MILLION)
- TABLE 65. SOUTH KOREA MULTIPLE MYELOMA MARKET, BY DRUG TYPE, 2021-2031 ($MILLION)
- TABLE 66. SOUTH KOREA MULTIPLE MYELOMA MARKET, BY DISEASE TYPE, 2021-2031 ($MILLION)
- TABLE 67. SOUTH KOREA MULTIPLE MYELOMA MARKET, BY END USER, 2021-2031 ($MILLION)
- TABLE 68. REST OF ASIA-PACIFIC MULTIPLE MYELOMA MARKET, BY DRUG TYPE, 2021-2031 ($MILLION)
- TABLE 69. REST OF ASIA-PACIFIC MULTIPLE MYELOMA MARKET, BY DISEASE TYPE, 2021-2031 ($MILLION)
- TABLE 70. REST OF ASIA-PACIFIC MULTIPLE MYELOMA MARKET, BY END USER, 2021-2031 ($MILLION)
- TABLE 71. LAMEA MULTIPLE MYELOMA MARKET, BY DRUG TYPE, 2021-2031 ($MILLION)
- TABLE 72. LAMEA MULTIPLE MYELOMA MARKET, BY DISEASE TYPE, 2021-2031 ($MILLION)
- TABLE 73. LAMEA MULTIPLE MYELOMA MARKET, BY END USER, 2021-2031 ($MILLION)
- TABLE 74. LAMEA MULTIPLE MYELOMA MARKET, BY COUNTRY, 2021-2031 ($MILLION)
- TABLE 75. BRAZIL MULTIPLE MYELOMA MARKET, BY DRUG TYPE, 2021-2031 ($MILLION)
- TABLE 76. BRAZIL MULTIPLE MYELOMA MARKET, BY DISEASE TYPE, 2021-2031 ($MILLION)
- TABLE 77. BRAZIL MULTIPLE MYELOMA MARKET, BY END USER, 2021-2031 ($MILLION)
- TABLE 78. SAUDI ARABIA MULTIPLE MYELOMA MARKET, BY DRUG TYPE, 2021-2031 ($MILLION)
- TABLE 79. SAUDI ARABIA MULTIPLE MYELOMA MARKET, BY DISEASE TYPE, 2021-2031 ($MILLION)
- TABLE 80. SAUDI ARABIA MULTIPLE MYELOMA MARKET, BY END USER, 2021-2031 ($MILLION)
- TABLE 81. SOUTH AFRICA MULTIPLE MYELOMA MARKET, BY DRUG TYPE, 2021-2031 ($MILLION)
- TABLE 82. SOUTH AFRICA MULTIPLE MYELOMA MARKET, BY DISEASE TYPE, 2021-2031 ($MILLION)
- TABLE 83. SOUTH AFRICA MULTIPLE MYELOMA MARKET, BY END USER, 2021-2031 ($MILLION)
- TABLE 84. REST OF LAMEA MULTIPLE MYELOMA MARKET, BY DRUG TYPE, 2021-2031 ($MILLION)
- TABLE 85. REST OF LAMEA MULTIPLE MYELOMA MARKET, BY DISEASE TYPE, 2021-2031 ($MILLION)
- TABLE 86. REST OF LAMEA MULTIPLE MYELOMA MARKET, BY END USER, 2021-2031 ($MILLION)
- TABLE 87. NOVARTIS AG: KEY EXECUTIVES
- TABLE 88. NOVARTIS AG: COMPANY SNAPSHOT
- TABLE 89. NOVARTIS AG: PRODUCT SEGMENTS
- TABLE 90. NOVARTIS AG: PRODUCT PORTFOLIO
- TABLE 91. BRISTOL-MYERS SQUIBB COMPANY: KEY EXECUTIVES
- TABLE 92. BRISTOL-MYERS SQUIBB COMPANY: COMPANY SNAPSHOT
- TABLE 93. BRISTOL-MYERS SQUIBB COMPANY: PRODUCT SEGMENTS
- TABLE 94. BRISTOL-MYERS SQUIBB COMPANY: PRODUCT PORTFOLIO
- TABLE 95. BRISTOL-MYERS SQUIBB COMPANY: KEY STRATERGIES
- TABLE 96. AMGEN INC.: KEY EXECUTIVES
- TABLE 97. AMGEN INC.: COMPANY SNAPSHOT
- TABLE 98. AMGEN INC.: PRODUCT SEGMENTS
- TABLE 99. AMGEN INC.: PRODUCT PORTFOLIO
- TABLE 100. AMGEN INC.: KEY STRATERGIES
- TABLE 101. ABBVIE INC: KEY EXECUTIVES
- TABLE 102. ABBVIE INC: COMPANY SNAPSHOT
- TABLE 103. ABBVIE INC: PRODUCT SEGMENTS
- TABLE 104. ABBVIE INC: PRODUCT PORTFOLIO
- TABLE 105. ABBVIE INC: KEY STRATERGIES
- TABLE 106. SANOFI: KEY EXECUTIVES
- TABLE 107. SANOFI: COMPANY SNAPSHOT
- TABLE 108. SANOFI: PRODUCT SEGMENTS
- TABLE 109. SANOFI: PRODUCT PORTFOLIO
- TABLE 110. SANOFI: KEY STRATERGIES
- TABLE 111. JOHNSON AND JOHNSON: KEY EXECUTIVES
- TABLE 112. JOHNSON AND JOHNSON: COMPANY SNAPSHOT
- TABLE 113. JOHNSON AND JOHNSON: PRODUCT SEGMENTS
- TABLE 114. JOHNSON AND JOHNSON: PRODUCT PORTFOLIO
- TABLE 115. JOHNSON AND JOHNSON: KEY STRATERGIES
- TABLE 116. BAXTER INTERNATIONAL INC.: KEY EXECUTIVES
- TABLE 117. BAXTER INTERNATIONAL INC.: COMPANY SNAPSHOT
- TABLE 118. BAXTER INTERNATIONAL INC.: PRODUCT SEGMENTS
- TABLE 119. BAXTER INTERNATIONAL INC.: PRODUCT PORTFOLIO
- TABLE 120. TAKEDA PHARMACEUTICAL COMPANY LTD: KEY EXECUTIVES
- TABLE 121. TAKEDA PHARMACEUTICAL COMPANY LTD: COMPANY SNAPSHOT
- TABLE 122. TAKEDA PHARMACEUTICAL COMPANY LTD: PRODUCT SEGMENTS
- TABLE 123. TAKEDA PHARMACEUTICAL COMPANY LTD: PRODUCT PORTFOLIO
- TABLE 124. TAKEDA PHARMACEUTICAL COMPANY LTD: KEY STRATERGIES
- TABLE 125. TEVA PHARMACEUTICAL INDUSTRIES: KEY EXECUTIVES
- TABLE 126. TEVA PHARMACEUTICAL INDUSTRIES: COMPANY SNAPSHOT
- TABLE 127. TEVA PHARMACEUTICAL INDUSTRIES: PRODUCT SEGMENTS
- TABLE 128. TEVA PHARMACEUTICAL INDUSTRIES: PRODUCT PORTFOLIO
- TABLE 129. PFIZER INC.: KEY EXECUTIVES
- TABLE 130. PFIZER INC.: COMPANY SNAPSHOT
- TABLE 131. PFIZER INC.: PRODUCT SEGMENTS
- TABLE 132. PFIZER INC.: PRODUCT PORTFOLIO
LIST OF FIGURES
- FIGURE 01. MULTIPLE MYELOMA MARKET, 2021-2031
- FIGURE 02. SEGMENTATION OF MULTIPLE MYELOMA MARKET, 2021-2031
- FIGURE 03. TOP INVESTMENT POCKETS IN MULTIPLE MYELOMA MARKET (2021-2031)
- FIGURE 04. LOW BARGAINING POWER OF SUPPLIERS
- FIGURE 05. LOW BARGAINING POWER OF BUYERS
- FIGURE 06. LOW THREAT OF SUBSTITUTES
- FIGURE 07. LOW THREAT OF NEW ENTRANTS
- FIGURE 08. LOW INTENSITY OF RIVALRY
- FIGURE 09. DRIVERS, RESTRAINTS AND OPPORTUNITIES: GLOBALMULTIPLE MYELOMA MARKET
- FIGURE 10. MULTIPLE MYELOMA MARKET, BY DRUG TYPE, 2021(%)
- FIGURE 11. COMPARATIVE SHARE ANALYSIS OF MULTIPLE MYELOMA MARKET FOR CHEMOTHERAPY, BY COUNTRY 2021-2031(%)
- FIGURE 12. COMPARATIVE SHARE ANALYSIS OF MULTIPLE MYELOMA MARKET FOR PROTEASE INHIBITORS, BY COUNTRY 2021-2031(%)
- FIGURE 13. COMPARATIVE SHARE ANALYSIS OF MULTIPLE MYELOMA MARKET FOR MONOCLONAL ANTIBODY, BY COUNTRY 2021-2031(%)
- FIGURE 14. COMPARATIVE SHARE ANALYSIS OF MULTIPLE MYELOMA MARKET FOR OTHERS, BY COUNTRY 2021-2031(%)
- FIGURE 15. MULTIPLE MYELOMA MARKET, BY DISEASE TYPE, 2021(%)
- FIGURE 16. COMPARATIVE SHARE ANALYSIS OF MULTIPLE MYELOMA MARKET FOR ACTIVE MULTIPLE MYELOMA, BY COUNTRY 2021-2031(%)
- FIGURE 17. COMPARATIVE SHARE ANALYSIS OF MULTIPLE MYELOMA MARKET FOR SMOLDERING MULTIPLE MYELOMA, BY COUNTRY 2021-2031(%)
- FIGURE 18. MULTIPLE MYELOMA MARKET, BY END USER, 2021(%)
- FIGURE 19. COMPARATIVE SHARE ANALYSIS OF MULTIPLE MYELOMA MARKET FOR HOSPITALS, BY COUNTRY 2021-2031(%)
- FIGURE 20. COMPARATIVE SHARE ANALYSIS OF MULTIPLE MYELOMA MARKET FOR CLINICS, BY COUNTRY 2021-2031(%)
- FIGURE 21. COMPARATIVE SHARE ANALYSIS OF MULTIPLE MYELOMA MARKET FOR OTHERS, BY COUNTRY 2021-2031(%)
- FIGURE 22. MULTIPLE MYELOMA MARKET BY REGION, 2021
- FIGURE 23. U.S. MULTIPLE MYELOMA MARKET, 2021-2031 ($MILLION)
- FIGURE 24. CANADA MULTIPLE MYELOMA MARKET, 2021-2031 ($MILLION)
- FIGURE 25. MEXICO MULTIPLE MYELOMA MARKET, 2021-2031 ($MILLION)
- FIGURE 26. GERMANY MULTIPLE MYELOMA MARKET, 2021-2031 ($MILLION)
- FIGURE 27. FRANCE MULTIPLE MYELOMA MARKET, 2021-2031 ($MILLION)
- FIGURE 28. UK MULTIPLE MYELOMA MARKET, 2021-2031 ($MILLION)
- FIGURE 29. ITALY MULTIPLE MYELOMA MARKET, 2021-2031 ($MILLION)
- FIGURE 30. SPAIN MULTIPLE MYELOMA MARKET, 2021-2031 ($MILLION)
- FIGURE 31. REST OF EUROPE MULTIPLE MYELOMA MARKET, 2021-2031 ($MILLION)
- FIGURE 32. JAPAN MULTIPLE MYELOMA MARKET, 2021-2031 ($MILLION)
- FIGURE 33. CHINA MULTIPLE MYELOMA MARKET, 2021-2031 ($MILLION)
- FIGURE 34. INDIA MULTIPLE MYELOMA MARKET, 2021-2031 ($MILLION)
- FIGURE 35. AUSTRALIA MULTIPLE MYELOMA MARKET, 2021-2031 ($MILLION)
- FIGURE 36. SOUTH KOREA MULTIPLE MYELOMA MARKET, 2021-2031 ($MILLION)
- FIGURE 37. REST OF ASIA-PACIFIC MULTIPLE MYELOMA MARKET, 2021-2031 ($MILLION)
- FIGURE 38. BRAZIL MULTIPLE MYELOMA MARKET, 2021-2031 ($MILLION)
- FIGURE 39. SAUDI ARABIA MULTIPLE MYELOMA MARKET, 2021-2031 ($MILLION)
- FIGURE 40. SOUTH AFRICA MULTIPLE MYELOMA MARKET, 2021-2031 ($MILLION)
- FIGURE 41. REST OF LAMEA MULTIPLE MYELOMA MARKET, 2021-2031 ($MILLION)
- FIGURE 42. TOP WINNING STRATEGIES, BY YEAR
- FIGURE 43. TOP WINNING STRATEGIES, BY DEVELOPMENT
- FIGURE 44. TOP WINNING STRATEGIES, BY COMPANY
- FIGURE 45. PRODUCT MAPPING OF TOP 10 PLAYERS
- FIGURE 46. COMPETITIVE DASHBOARD
- FIGURE 47. COMPETITIVE HEATMAP: MULTIPLE MYELOMA MARKET
- FIGURE 48. TOP PLAYER POSITIONING, 2021
- FIGURE 49. NOVARTIS AG: NET SALES, 2020-2022 ($MILLION)
- FIGURE 50. NOVARTIS AG: REVENUE SHARE BY SEGMENT, 2022 (%)
- FIGURE 51. NOVARTIS AG: REVENUE SHARE BY REGION, 2022 (%)
- FIGURE 52. BRISTOL-MYERS SQUIBB COMPANY: NET SALES, 2019-2021 ($MILLION)
- FIGURE 53. BRISTOL-MYERS SQUIBB COMPANY: REVENUE SHARE BY REGION, 2021 (%)
- FIGURE 54. AMGEN INC.: NET REVENUE, 2019-2021 ($MILLION)
- FIGURE 55. AMGEN INC.: REVENUE SHARE BY REGION, 2021 (%)
- FIGURE 56. ABBVIE INC: NET REVENUE, 2019-2021 ($MILLION)
- FIGURE 57. ABBVIE INC: REVENUE SHARE BY SEGMENT, 2021 (%)
- FIGURE 58. ABBVIE INC: REVENUE SHARE BY REGION, 2021 (%)
- FIGURE 59. SANOFI: NET REVENUE, 2019-2021 ($MILLION)
- FIGURE 60. SANOFI: RESEARCH & DEVELOPMENT EXPENDITURE, 2019-2021
- FIGURE 61. SANOFI: REVENUE SHARE BY SEGMENT, 2021 (%)
- FIGURE 62. SANOFI: REVENUE SHARE BY REGION, 2021 (%)
- FIGURE 63. JOHNSON AND JOHNSON: SALES REVENUE, 2019-2021 ($MILLION)
- FIGURE 64. JOHNSON AND JOHNSON: REVENUE SHARE BY SEGMENT, 2021 (%)
- FIGURE 65. JOHNSON AND JOHNSON: REVENUE SHARE BY REGION, 2021 (%)
- FIGURE 66. BAXTER INTERNATIONAL INC.: NET SALES, 2019-2021 ($MILLION)
- FIGURE 67. BAXTER INTERNATIONAL INC.: REVENUE SHARE BY SEGMENT, 2021 (%)
- FIGURE 68. BAXTER INTERNATIONAL INC.: REVENUE SHARE BY REGION, 2021 (%)
- FIGURE 69. TAKEDA PHARMACEUTICAL COMPANY LTD: NET REVENUE, 2019-2021 ($MILLION)
- FIGURE 70. TAKEDA PHARMACEUTICAL COMPANY LTD: REVENUE SHARE BY REGION, 2021 (%)
- FIGURE 71. TAKEDA PHARMACEUTICAL COMPANY LTD: REVENUE SHARE BY SEGMENT, 2021 (%)
- FIGURE 72. TEVA PHARMACEUTICAL INDUSTRIES: NET REVENUE, 2019-2021 ($MILLION)
- FIGURE 73. TEVA PHARMACEUTICAL INDUSTRIES: RESEARCH & DEVELOPMENT EXPENDITURE, 2019-2021 ($MILLION)
- FIGURE 74. TEVA PHARMACEUTICAL INDUSTRIES: REVENUE SHARE BY REGION, 2021 (%)
- FIGURE 75. PFIZER INC.: NET REVENUE, 2020-2022 ($MILLION)
- FIGURE 76. PFIZER INC.: REVENUE SHARE BY REGION, 2022 (%)
- FIGURE 77. PFIZER INC.: REVENUE SHARE BY SEGMENT, 2021 (%)
The multiple myeloma market valued for $19,666.74 million in 2021 and is estimated to reach $53,521.76 million by 2031, exhibiting a CAGR of 10.5% from 2022 to 2031. Multiple myeloma is a cancer that forms in a type of white blood cell called a plasma cell. Healthy plasma cells contribute to combat infections by synthesizing antibodies that can recognize and inhibit the growth of microorganisms. Cancerous plasma cells build up in the bone marrow and push out healthy blood cells in multiple myeloma. Various therapies are available to treat multiple myeloma, which includes targeted therapy, immunotherapy, chemotherapy, corticosteroids, bone marrow transplant, and radiation therapy.
The growth of the global multiple myeloma market is driven by increase in number of market players who manufacture drugs for multiple myeloma. In addition, rise in number of product launch and product approvals for multiple myeloma drugs is expected to propel the growth of market. For instance, in January 2022, Bristol-Myers Squibb, a pharmaceutical company, announced that Japan's Ministry of Health, Labour and Welfare approved Abecma (idecabtagene vicleucel), a B-cell maturation antigen (BCMA)-directed chimeric antigen receptor (CAR) T cell immunotherapy, for the treatment of adult patients with relapsed or refractory (R/R) multiple myeloma. In addition, rise in prevalence of multiple myeloma boosts the demand for multiple myeloma drugs, thereby fueling the market growth. For instance, in 2020, according to the International Agency for Research on Cancer, around 1,76,404 cases of multiple myeloma were reported across the globe.
Moreover, increase in expenditure by government for healthcare services is expected to propel the adoption of cancer therapies and cancer medication by hospitals and clinics, thereby fueling the market growth. For instance, as per the Office for National Statistics, in 2021, it was reported that total healthcare expenditure in the UK was $300,07 billion, which is an increase in nominal terms of 7.4% on spending in 2020. Moreover, according to the Centers for Medicare and Medical Services Government (CMS), it was reported that the national healthcare expenditure (NHE) grew by 2.7% to $4.3 trillion in 2021, or $12,914 per person, and accounted for 18.3% of the GDP).
On the other hand, high cost of multiple myeloma drugs, radiation therapy, and stem cell transplantation as well as side effects associated with the drugs hinder the growth of the multiple myeloma market.
However, increased demand for medical services in the developed countries such as U.S., Canada, & Germany and high market growth potential in emerging economies are expected to create immense opportunities for the market during the forecast period.
The global multiple myeloma market is segmented into drug type, disease type, end user, and region. Depending on drug type, the market is divided into chemotherapy, protease inhibitors, monoclonal antibody, and others. On the basis of disease type, it is bifurcated into active multiple myeloma and smoldering multiple myeloma. By end user, it is segregated into hospitals, clinics, and others.
Region wise, the market is analyzed across North America (U.S., Canada, and Mexico), Europe (Germany, France, UK, Italy, Spain, and rest of Europe), Asia-Pacific (China, Japan, India, Australia, South Korea, and rest of Asia-Pacific), and LAMEA (Brazil, Saudi Arabia, South Africa, and rest of LAMEA).
Major key players that operate in the global multiple myeloma market are: Novartis AG, Bristol-Myers Squibb Company, Amgen Inc., AbbVie Inc., Johnson & Johnson, Teva Pharmaceutical Industries Ltd., ONO Pharmaceutical Co., Ltd., Takeda Pharmaceutical Company Ltd., and Roche Group.
Key Benefits For Stakeholders
- This report provides a quantitative analysis of the market segments, current trends, estimations, and dynamics of the multiple myeloma market analysis from 2021 to 2031 to identify the prevailing multiple myeloma market opportunities.
- The market research is offered along with information related to key drivers, restraints, and opportunities.
- Porter's five forces analysis highlights the potency of buyers and suppliers to enable stakeholders make profit-oriented business decisions and strengthen their supplier-buyer network.
- In-depth analysis of the multiple myeloma market segmentation assists to determine the prevailing market opportunities.
- Major countries in each region are mapped according to their revenue contribution to the global market.
- Market player positioning facilitates benchmarking and provides a clear understanding of the present position of the market players.
- The report includes the analysis of the regional as well as global multiple myeloma market trends, key players, market segments, application areas, and market growth strategies.
Key Market Segments
By Drug Type
- Chemotherapy
- Protease Inhibitors
- Monoclonal Antibody
- Others
By End User
- Hospitals
- Clinics
- Others
By Disease Type
- Active Multiple Myeloma
- Smoldering Multiple Myeloma
By Region
- North America
- U.S.
- Canada
- Mexico
- Europe
- Germany
- France
- UK
- Italy
- Spain
- Rest of Europe
- Asia-Pacific
- Japan
- China
- India
- Australia
- South Korea
- Rest of Asia-Pacific
- LAMEA
- Brazil
- Saudi Arabia
- South Africa
- Rest of LAMEA
Key Market Players:
- Bristol-Myers Squibb Company
- Amgen Inc.
- Abbvie Inc
- Johnson and Johnson
- Baxter International Inc.
- Takeda Pharmaceutical Company Ltd
- Teva Pharmaceutical Industries
- Pfizer Inc.
- Sanofi
- Novartis AG
TABLE OF CONTENTS
CHAPTER 1: INTRODUCTION
- 1.1. Report description
- 1.2. Key market segments
- 1.3. Key benefits to the stakeholders
- 1.4. Research Methodology
- 1.4.1. Primary research
- 1.4.2. Secondary research
- 1.4.3. Analyst tools and models
CHAPTER 2: EXECUTIVE SUMMARY
- 2.1. CXO Perspective
CHAPTER 3: MARKET OVERVIEW
- 3.1. Market definition and scope
- 3.2. Key findings
- 3.2.1. Top impacting factors
- 3.2.2. Top investment pockets
- 3.3. Porter's five forces analysis
- 3.3.1. Bargaining power of suppliers
- 3.3.2. Bargaining power of buyers
- 3.3.3. Threat of substitutes
- 3.3.4. Threat of new entrants
- 3.3.5. Intensity of rivalry
- 3.4. Market dynamics
- 3.4.1. Drivers
- 3.4.1.1. Rise in prevalence of multiple myeloma
- 3.4.1.2. Increase in initiative taken by government for treatment of multiple myeloma
- 3.4.1.3. Rise in number of market players who manufactures multiple myeloma drugs
- 3.4.1. Drivers
- 3.4.2. Restraints
- 3.4.2.1. High cost of multiple myeloma treatment
- 3.4.2.2. Side effects of multiple myeloma treatment
- 3.4.3. Opportunities
- 3.4.3.1. Increase in product launches and product approvals for multiple myeloma drugs
- 3.5. COVID-19 Impact Analysis on the market
CHAPTER 4: MULTIPLE MYELOMA MARKET, BY DRUG TYPE
- 4.1. Overview
- 4.1.1. Market size and forecast
- 4.2. Chemotherapy
- 4.2.1. Key market trends, growth factors and opportunities
- 4.2.2. Market size and forecast, by region
- 4.2.3. Market share analysis by country
- 4.3. Protease Inhibitors
- 4.3.1. Key market trends, growth factors and opportunities
- 4.3.2. Market size and forecast, by region
- 4.3.3. Market share analysis by country
- 4.4. Monoclonal Antibody
- 4.4.1. Key market trends, growth factors and opportunities
- 4.4.2. Market size and forecast, by region
- 4.4.3. Market share analysis by country
- 4.5. Others
- 4.5.1. Key market trends, growth factors and opportunities
- 4.5.2. Market size and forecast, by region
- 4.5.3. Market share analysis by country
CHAPTER 5: MULTIPLE MYELOMA MARKET, BY DISEASE TYPE
- 5.1. Overview
- 5.1.1. Market size and forecast
- 5.2. Active Multiple Myeloma
- 5.2.1. Key market trends, growth factors and opportunities
- 5.2.2. Market size and forecast, by region
- 5.2.3. Market share analysis by country
- 5.3. Smoldering Multiple Myeloma
- 5.3.1. Key market trends, growth factors and opportunities
- 5.3.2. Market size and forecast, by region
- 5.3.3. Market share analysis by country
CHAPTER 6: MULTIPLE MYELOMA MARKET, BY END USER
- 6.1. Overview
- 6.1.1. Market size and forecast
- 6.2. Hospitals
- 6.2.1. Key market trends, growth factors and opportunities
- 6.2.2. Market size and forecast, by region
- 6.2.3. Market share analysis by country
- 6.3. Clinics
- 6.3.1. Key market trends, growth factors and opportunities
- 6.3.2. Market size and forecast, by region
- 6.3.3. Market share analysis by country
- 6.4. Others
- 6.4.1. Key market trends, growth factors and opportunities
- 6.4.2. Market size and forecast, by region
- 6.4.3. Market share analysis by country
CHAPTER 7: MULTIPLE MYELOMA MARKET, BY REGION
- 7.1. Overview
- 7.1.1. Market size and forecast By Region
- 7.2. North America
- 7.2.1. Key trends and opportunities
- 7.2.2. Market size and forecast, by Drug Type
- 7.2.3. Market size and forecast, by Disease Type
- 7.2.4. Market size and forecast, by End User
- 7.2.5. Market size and forecast, by country
- 7.2.5.1. U.S.
- 7.2.5.1.1. Key market trends, growth factors and opportunities
- 7.2.5.1.2. Market size and forecast, by Drug Type
- 7.2.5.1.3. Market size and forecast, by Disease Type
- 7.2.5.1.4. Market size and forecast, by End User
- 7.2.5.2. Canada
- 7.2.5.2.1. Key market trends, growth factors and opportunities
- 7.2.5.2.2. Market size and forecast, by Drug Type
- 7.2.5.2.3. Market size and forecast, by Disease Type
- 7.2.5.2.4. Market size and forecast, by End User
- 7.2.5.3. Mexico
- 7.2.5.3.1. Key market trends, growth factors and opportunities
- 7.2.5.3.2. Market size and forecast, by Drug Type
- 7.2.5.3.3. Market size and forecast, by Disease Type
- 7.2.5.3.4. Market size and forecast, by End User
- 7.3. Europe
- 7.3.1. Key trends and opportunities
- 7.3.2. Market size and forecast, by Drug Type
- 7.3.3. Market size and forecast, by Disease Type
- 7.3.4. Market size and forecast, by End User
- 7.3.5. Market size and forecast, by country
- 7.3.5.1. Germany
- 7.3.5.1.1. Key market trends, growth factors and opportunities
- 7.3.5.1.2. Market size and forecast, by Drug Type
- 7.3.5.1.3. Market size and forecast, by Disease Type
- 7.3.5.1.4. Market size and forecast, by End User
- 7.3.5.2. France
- 7.3.5.2.1. Key market trends, growth factors and opportunities
- 7.3.5.2.2. Market size and forecast, by Drug Type
- 7.3.5.2.3. Market size and forecast, by Disease Type
- 7.3.5.2.4. Market size and forecast, by End User
- 7.3.5.3. UK
- 7.3.5.3.1. Key market trends, growth factors and opportunities
- 7.3.5.3.2. Market size and forecast, by Drug Type
- 7.3.5.3.3. Market size and forecast, by Disease Type
- 7.3.5.3.4. Market size and forecast, by End User
- 7.3.5.4. Italy
- 7.3.5.4.1. Key market trends, growth factors and opportunities
- 7.3.5.4.2. Market size and forecast, by Drug Type
- 7.3.5.4.3. Market size and forecast, by Disease Type
- 7.3.5.4.4. Market size and forecast, by End User
- 7.3.5.5. Spain
- 7.3.5.5.1. Key market trends, growth factors and opportunities
- 7.3.5.5.2. Market size and forecast, by Drug Type
- 7.3.5.5.3. Market size and forecast, by Disease Type
- 7.3.5.5.4. Market size and forecast, by End User
- 7.3.5.6. Rest of Europe
- 7.3.5.6.1. Key market trends, growth factors and opportunities
- 7.3.5.6.2. Market size and forecast, by Drug Type
- 7.3.5.6.3. Market size and forecast, by Disease Type
- 7.3.5.6.4. Market size and forecast, by End User
- 7.4. Asia-Pacific
- 7.4.1. Key trends and opportunities
- 7.4.2. Market size and forecast, by Drug Type
- 7.4.3. Market size and forecast, by Disease Type
- 7.4.4. Market size and forecast, by End User
- 7.4.5. Market size and forecast, by country
- 7.4.5.1. Japan
- 7.4.5.1.1. Key market trends, growth factors and opportunities
- 7.4.5.1.2. Market size and forecast, by Drug Type
- 7.4.5.1.3. Market size and forecast, by Disease Type
- 7.4.5.1.4. Market size and forecast, by End User
- 7.4.5.2. China
- 7.4.5.2.1. Key market trends, growth factors and opportunities
- 7.4.5.2.2. Market size and forecast, by Drug Type
- 7.4.5.2.3. Market size and forecast, by Disease Type
- 7.4.5.2.4. Market size and forecast, by End User
- 7.4.5.3. India
- 7.4.5.3.1. Key market trends, growth factors and opportunities
- 7.4.5.3.2. Market size and forecast, by Drug Type
- 7.4.5.3.3. Market size and forecast, by Disease Type
- 7.4.5.3.4. Market size and forecast, by End User
- 7.4.5.4. Australia
- 7.4.5.4.1. Key market trends, growth factors and opportunities
- 7.4.5.4.2. Market size and forecast, by Drug Type
- 7.4.5.4.3. Market size and forecast, by Disease Type
- 7.4.5.4.4. Market size and forecast, by End User
- 7.4.5.5. South Korea
- 7.4.5.5.1. Key market trends, growth factors and opportunities
- 7.4.5.5.2. Market size and forecast, by Drug Type
- 7.4.5.5.3. Market size and forecast, by Disease Type
- 7.4.5.5.4. Market size and forecast, by End User
- 7.4.5.6. Rest of Asia-Pacific
- 7.4.5.6.1. Key market trends, growth factors and opportunities
- 7.4.5.6.2. Market size and forecast, by Drug Type
- 7.4.5.6.3. Market size and forecast, by Disease Type
- 7.4.5.6.4. Market size and forecast, by End User
- 7.5. LAMEA
- 7.5.1. Key trends and opportunities
- 7.5.2. Market size and forecast, by Drug Type
- 7.5.3. Market size and forecast, by Disease Type
- 7.5.4. Market size and forecast, by End User
- 7.5.5. Market size and forecast, by country
- 7.5.5.1. Brazil
- 7.5.5.1.1. Key market trends, growth factors and opportunities
- 7.5.5.1.2. Market size and forecast, by Drug Type
- 7.5.5.1.3. Market size and forecast, by Disease Type
- 7.5.5.1.4. Market size and forecast, by End User
- 7.5.5.2. Saudi Arabia
- 7.5.5.2.1. Key market trends, growth factors and opportunities
- 7.5.5.2.2. Market size and forecast, by Drug Type
- 7.5.5.2.3. Market size and forecast, by Disease Type
- 7.5.5.2.4. Market size and forecast, by End User
- 7.5.5.3. South Africa
- 7.5.5.3.1. Key market trends, growth factors and opportunities
- 7.5.5.3.2. Market size and forecast, by Drug Type
- 7.5.5.3.3. Market size and forecast, by Disease Type
- 7.5.5.3.4. Market size and forecast, by End User
- 7.5.5.4. Rest of LAMEA
- 7.5.5.4.1. Key market trends, growth factors and opportunities
- 7.5.5.4.2. Market size and forecast, by Drug Type
- 7.5.5.4.3. Market size and forecast, by Disease Type
- 7.5.5.4.4. Market size and forecast, by End User
CHAPTER 8: COMPETITIVE LANDSCAPE
- 8.1. Introduction
- 8.2. Top winning strategies
- 8.3. Product Mapping of Top 10 Player
- 8.4. Competitive Dashboard
- 8.5. Competitive Heatmap
- 8.6. Top player positioning, 2021
CHAPTER 9: COMPANY PROFILES
- 9.1. Novartis AG
- 9.1.1. Company overview
- 9.1.2. Key Executives
- 9.1.3. Company snapshot
- 9.1.4. Operating business segments
- 9.1.5. Product portfolio
- 9.1.6. Business performance
- 9.2. Bristol-Myers Squibb Company
- 9.2.1. Company overview
- 9.2.2. Key Executives
- 9.2.3. Company snapshot
- 9.2.4. Operating business segments
- 9.2.5. Product portfolio
- 9.2.6. Business performance
- 9.2.7. Key strategic moves and developments
- 9.3. Amgen Inc.
- 9.3.1. Company overview
- 9.3.2. Key Executives
- 9.3.3. Company snapshot
- 9.3.4. Operating business segments
- 9.3.5. Product portfolio
- 9.3.6. Business performance
- 9.3.7. Key strategic moves and developments
- 9.4. Abbvie Inc
- 9.4.1. Company overview
- 9.4.2. Key Executives
- 9.4.3. Company snapshot
- 9.4.4. Operating business segments
- 9.4.5. Product portfolio
- 9.4.6. Business performance
- 9.4.7. Key strategic moves and developments
- 9.5. Sanofi
- 9.5.1. Company overview
- 9.5.2. Key Executives
- 9.5.3. Company snapshot
- 9.5.4. Operating business segments
- 9.5.5. Product portfolio
- 9.5.6. Business performance
- 9.5.7. Key strategic moves and developments
- 9.6. Johnson and Johnson
- 9.6.1. Company overview
- 9.6.2. Key Executives
- 9.6.3. Company snapshot
- 9.6.4. Operating business segments
- 9.6.5. Product portfolio
- 9.6.6. Business performance
- 9.6.7. Key strategic moves and developments
- 9.7. Baxter International Inc.
- 9.7.1. Company overview
- 9.7.2. Key Executives
- 9.7.3. Company snapshot
- 9.7.4. Operating business segments
- 9.7.5. Product portfolio
- 9.7.6. Business performance
- 9.8. Takeda Pharmaceutical Company Ltd
- 9.8.1. Company overview
- 9.8.2. Key Executives
- 9.8.3. Company snapshot
- 9.8.4. Operating business segments
- 9.8.5. Product portfolio
- 9.8.6. Business performance
- 9.8.7. Key strategic moves and developments
- 9.9. Teva Pharmaceutical Industries
- 9.9.1. Company overview
- 9.9.2. Key Executives
- 9.9.3. Company snapshot
- 9.9.4. Operating business segments
- 9.9.5. Product portfolio
- 9.9.6. Business performance
- 9.10. Pfizer Inc.
- 9.10.1. Company overview
- 9.10.2. Key Executives
- 9.10.3. Company snapshot
- 9.10.4. Operating business segments
- 9.10.5. Product portfolio
- 9.10.6. Business performance