|
|
市場調査レポート
商品コード
1239592
ライドオンバイク市場:年齢層別(1~6歳、7~12歳、12歳以上)、販売チャネル別(オフライン、オンライン)、推進力別(非モーター式、モーター式):世界の機会分析と産業予測、2021年~2031年Ride on Bikes Market By Age Group (1 to 6 years, 7 to 12 years, Greater than 12 years), By Sales Channel (Offline, Online), By Propulsion (Non-motorized, Motorized): Global Opportunity Analysis and Industry Forecast, 2021-2031 |
||||||
|
|
|||||||


| ライドオンバイク市場:年齢層別(1~6歳、7~12歳、12歳以上)、販売チャネル別(オフライン、オンライン)、推進力別(非モーター式、モーター式):世界の機会分析と産業予測、2021年~2031年 |
|
出版日: 2023年01月01日
発行: Allied Market Research
ページ情報: 英文 347 Pages
納期: 2~3営業日
|
- 全表示
- 概要
- 図表
- 目次
スマートデバイスやガジェットから離れ、楽しく体を動かすことを促すために、ライドオンバイクの活用が進んでいます。
協調性、持久力、強化に取り組み、総運動能力を向上させるための子供用ライドオンバイクの需要が増加しています。バイクの需要の増加により、メーカーはますます新製品を発表しています。例えば、2022年9月、ホンダは、2025年までに少なくとも10台のオール電化バイクを発売する計画を発表し、その中には子供向けに設計された電動バイクも含まれています。こうした新興国市場の開拓は、市場の成長を後押しすると期待されます。
電動ライドオンバイクの中には、リチウムイオンバッテリーで動作するものがあります。充電式バッテリーは、電力を供給するためにバイクに搭載されます。メーカーは、バッテリーを充電するために、ライドオンバイクに充電器を提供しています。一般的に、バッテリーは2つのインジケータを備えています:1つは充電中であることを示し、もう1つは使用可能な状態にあることを示します。子供用自転車は5年以上使用でき、バッテリーは常時使用で2年程度持ちます。ライドオンバイクは、エンジンによって推進され、ガスで駆動するタイプもあります。これらのライドオンバイクは、2ストロークまたは4ストークのエンジンを備えています。エンジンで動くライドオンバイクは、若いレーサーがダートバイクで走るのによく使われます。
オフラインの流通チャネルは、顧客にライドオンバイクを販売する伝統的な方法です。オフラインの販売チャネルは、簡単にアクセスでき、すぐに製品を入手できるため、世界中で支配的です。販売者の存在は、消費者が最適な製品を選択するのに役立ちます。購入前にさまざまな製品を直接比較することができるため、オフラインチャネルは好ましい選択肢となります。子供たちは、お気に入りのライドオンバイクを購入することを楽しみにしています。オフライン・チャネルでのタッチ&フィール体験の需要は、このセグメントの市場成長を促進すると予想されます。
電動バランスバイクの人気が高まっています。電動バランスバイクは、地面に楽に届くので、ライダーはトレーニングホイールなしで学ぶことができます。市場開拓者は、拡大する市場需要に対応するため、さまざまなモードを搭載した軽量な電動バランスバイクを開発しています。例えば、2022年6月、オートバイメーカーのGASGASは、2022年モデルに向けて12eDriveと16eDriveバランスバイクをアップデートするために、ebike専門メーカーのStacycとのパートナーシップを開発しました。このeバランスバイクは、幼い子供たちに安全で楽しい二輪車の初体験をさせるために設計されています。
さらに、新製品の発売により、電動バランスバイクの需要が高まると予想されます。例えば、2019年9月、ハーレーダビッドソンは、3歳から7歳の子供向けに設計された子供用電動バランスバイクの最初のデュオを発売しました。電動バランスバイクは、小さい子用(IRONe12)と大きい子用(IRONe16)の2つのモデルで登場しました。このような要因が、市場の成長に大きな機会をもたらすと期待されます。
目次
第1章 イントロダクション
第2章 エグゼクティブサマリー
第3章 市場の概要
- 市場の定義と範囲
- 主な調査結果
- トップインパクトファクター
- トップインベストメントポケット
- ポーターのファイブフォース分析
- 供給企業の適度な交渉力
- 買い手の交渉力の低さ
- 代替品の脅威は中程度です
- 新規参入業者の脅威は中程度です
- ライバルの強さは中程度
- 市場力学
- 促進要因
- ライドオンバイクの新機能の紹介
- 子供の総体的な運動能力の発達を目的としたライドオンバイクの需要増
- レースやオフロード走行用のライドオンバイクの需要増
- 抑制要因
- 子どものオンラインゲーム人気急増
- 電池の価格上昇
- 機会
- 身体活動としての自転車への傾倒が高まる
- 軽量な電動バランスバイクの普及が進む
- 促進要因
- COVID-19市場への影響度分析
第4章 ライドオンバイク市場:年齢層別
- 概要
- 市場規模・予測
- 1~6歳
- 主な市場動向、成長要因、機会について
- 市場規模・予測:地域別
- 市場シェア分析:国別分析
- 7~12歳
- 主な市場動向、成長要因、機会について
- 市場規模・予測:地域別
- 市場シェア分析:国別分析
- 12歳以上
- 主な市場動向、成長要因、機会について
- 市場規模・予測:地域別
- 市場シェア分析:国別分析
第5章 ライドオンバイク市場:販売チャネル別
- 概要
- 市場規模・予測
- オフライン
- 主な市場動向、成長要因、機会について
- 市場規模・予測:地域別
- 市場シェア分析:国別分析
- オンライン
- 主な市場動向、成長要因、機会について
- 市場規模・予測:地域別
- 市場シェア分析:国別分析
第6章 ライドオンバイク市場:推進力別
- 概要
- 市場規模・予測
- 非モーター式
- 主な市場動向、成長要因、機会について
- 市場規模・予測:地域別
- 市場シェア分析:国別分析
- 非モーター式
- 主な市場動向、成長要因、機会について
- 市場規模・予測:地域別
- 市場シェア分析:国別分析
第7章 ライドオンバイク市場:地域別
- 概要
- 市場規模・予測:地域別
- 北米
- 主な動向と機会
- 市場規模・予測:年齢層別
- 市場規模・予測:販売チャネル別
- 市場規模・予測:推進力別
- 市場規模・予測:国別
- 米国
- 主な市場動向、成長要因、機会について
- 市場規模・予測:年齢層別
- 市場規模・予測:販売チャネル別
- 市場規模・予測:推進力別
- カナダ
- 主な市場動向、成長要因、機会について
- 市場規模・予測:年齢層別
- 市場規模・予測:販売チャネル別
- 市場規模・予測:推進力別
- メキシコ
- 主な市場動向、成長要因、機会について
- 市場規模・予測:年齢層別
- 市場規模・予測:販売チャネル別
- 市場規模・予測:推進力別
- 欧州
- 主な動向と機会
- 市場規模・予測:年齢層別
- 市場規模・予測:販売チャネル別
- 市場規模・予測:推進力別
- 市場規模・予測:国別
- 英国
- 主な市場動向、成長要因、機会について
- 市場規模・予測:年齢層別
- 市場規模・予測:販売チャネル別
- 市場規模・予測:推進力別
- ドイツ
- 主な市場動向、成長要因、機会について
- 市場規模・予測:年齢層別
- 市場規模・予測:販売チャネル別
- 市場規模・予測:推進力別
- フランス
- 主な市場動向、成長要因、機会について
- 市場規模・予測:年齢層別
- 市場規模・予測:販売チャネル別
- 市場規模・予測:推進力別
- イタリア
- 主な市場動向、成長要因、機会について
- 市場規模・予測:年齢層別
- 市場規模・予測:販売チャネル別
- 市場規模・予測:推進力別
- その他欧州
- 主な市場動向、成長要因、機会について
- 市場規模・予測:年齢層別
- 市場規模・予測:販売チャネル別
- 市場規模・予測:推進力別
- アジア太平洋地域
- 主な動向と機会
- 市場規模・予測:年齢層別
- 市場規模・予測:販売チャネル別
- 市場規模・予測:推進力別
- 市場規模・予測:国別
- 中国
- 主な市場動向、成長要因、機会について
- 市場規模・予測:年齢層別
- 市場規模・予測:販売チャネル別
- 市場規模・予測:推進力別
- インド
- 主な市場動向、成長要因、機会について
- 市場規模・予測:年齢層別
- 市場規模・予測:販売チャネル別
- 市場規模・予測:推進力別
- 日本
- 主な市場動向、成長要因、機会について
- 市場規模・予測:年齢層別
- 市場規模・予測:販売チャネル別
- 市場規模・予測:推進力別
- 韓国
- 主な市場動向、成長要因、機会について
- 市場規模・予測:年齢層別
- 市場規模・予測:販売チャネル別
- 市場規模・予測:推進力別
- その他アジア太平洋地域
- 主な市場動向、成長要因、機会について
- 市場規模・予測:年齢層別
- 市場規模・予測:販売チャネル別
- 市場規模・予測:推進力別
- LAMEA
- 主な動向と機会
- 市場規模・予測:年齢層別
- 市場規模・予測:販売チャネル別
- 市場規模・予測:推進力別
- 市場規模・予測:国別
- ラテンアメリカ
- 主な市場動向、成長要因、機会について
- 市場規模・予測:年齢層別
- 市場規模・予測:販売チャネル別
- 市場規模・予測:推進力別
- 中東
- 主な市場動向、成長要因、機会について
- 市場規模・予測:年齢層別
- 市場規模・予測:販売チャネル別
- 市場規模・予測:推進力別
- アフリカ
- 主な市場動向、成長要因、機会について
- 市場規模・予測:年齢層別
- 市場規模・予測:販売チャネル別
- 市場規模・予測:推進力別
第8章 競合情勢
- イントロダクション
- 主要成功戦略
- 主要10社の製品マッピング
- 競合ダッシュボード
- 競合ヒートマップ
- トップ企業のポジショニング、2021年
第9章 企業プロファイル
- Costzon
- Huffy Corporation
- Razor USA LLC
- TOBBI
- Suzuki Motor Corporation
- Honda Motor Co., Ltd.
- Yamaha Motor Co., Ltd.
- Kawasaki Heavy Industries, Ltd.
- KTM AG
- woom GmbH
LIST OF TABLES
- TABLE 01. GLOBAL RIDE ON BIKES MARKET, BY AGE GROUP, 2021-2031 (REVENUE, $MILLION)
- TABLE 02. RIDE ON BIKES MARKET FOR 1 TO 6 YEARS, BY REGION, 2021-2031 (REVENUE, $MILLION)
- TABLE 03. RIDE ON BIKES MARKET FOR 7 TO 12 YEARS, BY REGION, 2021-2031 (REVENUE, $MILLION)
- TABLE 04. RIDE ON BIKES MARKET FOR GREATER THAN 12 YEARS, BY REGION, 2021-2031 (REVENUE, $MILLION)
- TABLE 05. GLOBAL RIDE ON BIKES MARKET, BY SALES CHANNEL, 2021-2031 (REVENUE, $MILLION)
- TABLE 06. RIDE ON BIKES MARKET FOR OFFLINE, BY REGION, 2021-2031 (REVENUE, $MILLION)
- TABLE 07. RIDE ON BIKES MARKET FOR ONLINE, BY REGION, 2021-2031 (REVENUE, $MILLION)
- TABLE 08. GLOBAL RIDE ON BIKES MARKET, BY PROPULSION, 2021-2031 (REVENUE, $MILLION)
- TABLE 09. RIDE ON BIKES MARKET FOR NON-MOTORIZED, BY REGION, 2021-2031 (REVENUE, $MILLION)
- TABLE 10. RIDE ON BIKES MARKET FOR MOTORIZED, BY REGION, 2021-2031 (REVENUE, $MILLION)
- TABLE 11. RIDE ON BIKES MARKET, BY REGION, 2021-2031 (REVENUE, $MILLION)
- TABLE 12. NORTH AMERICA RIDE ON BIKES MARKET, BY AGE GROUP, 2021-2031 (REVENUE, $MILLION)
- TABLE 13. NORTH AMERICA RIDE ON BIKES MARKET, BY SALES CHANNEL, 2021-2031 (REVENUE, $MILLION)
- TABLE 14. NORTH AMERICA RIDE ON BIKES MARKET, BY PROPULSION, 2021-2031 (REVENUE, $MILLION)
- TABLE 15. NORTH AMERICA RIDE ON BIKES MARKET, BY COUNTRY, 2021-2031 (REVENUE, $MILLION)
- TABLE 16. U.S. RIDE ON BIKES MARKET, BY AGE GROUP, 2021-2031 (REVENUE, $MILLION)
- TABLE 17. U.S. RIDE ON BIKES MARKET, BY SALES CHANNEL, 2021-2031 (REVENUE, $MILLION)
- TABLE 18. U.S. RIDE ON BIKES MARKET, BY PROPULSION, 2021-2031 (REVENUE, $MILLION)
- TABLE 19. CANADA RIDE ON BIKES MARKET, BY AGE GROUP, 2021-2031 (REVENUE, $MILLION)
- TABLE 20. CANADA RIDE ON BIKES MARKET, BY SALES CHANNEL, 2021-2031 (REVENUE, $MILLION)
- TABLE 21. CANADA RIDE ON BIKES MARKET, BY PROPULSION, 2021-2031 (REVENUE, $MILLION)
- TABLE 22. MEXICO RIDE ON BIKES MARKET, BY AGE GROUP, 2021-2031 (REVENUE, $MILLION)
- TABLE 23. MEXICO RIDE ON BIKES MARKET, BY SALES CHANNEL, 2021-2031 (REVENUE, $MILLION)
- TABLE 24. MEXICO RIDE ON BIKES MARKET, BY PROPULSION, 2021-2031 (REVENUE, $MILLION)
- TABLE 25. EUROPE RIDE ON BIKES MARKET, BY AGE GROUP, 2021-2031 (REVENUE, $MILLION)
- TABLE 26. EUROPE RIDE ON BIKES MARKET, BY SALES CHANNEL, 2021-2031 (REVENUE, $MILLION)
- TABLE 27. EUROPE RIDE ON BIKES MARKET, BY PROPULSION, 2021-2031 (REVENUE, $MILLION)
- TABLE 28. EUROPE RIDE ON BIKES MARKET, BY COUNTRY, 2021-2031 (REVENUE, $MILLION)
- TABLE 29. UK RIDE ON BIKES MARKET, BY AGE GROUP, 2021-2031 (REVENUE, $MILLION)
- TABLE 30. UK RIDE ON BIKES MARKET, BY SALES CHANNEL, 2021-2031 (REVENUE, $MILLION)
- TABLE 31. UK RIDE ON BIKES MARKET, BY PROPULSION, 2021-2031 (REVENUE, $MILLION)
- TABLE 32. GERMANY RIDE ON BIKES MARKET, BY AGE GROUP, 2021-2031 (REVENUE, $MILLION)
- TABLE 33. GERMANY RIDE ON BIKES MARKET, BY SALES CHANNEL, 2021-2031 (REVENUE, $MILLION)
- TABLE 34. GERMANY RIDE ON BIKES MARKET, BY PROPULSION, 2021-2031 (REVENUE, $MILLION)
- TABLE 35. FRANCE RIDE ON BIKES MARKET, BY AGE GROUP, 2021-2031 (REVENUE, $MILLION)
- TABLE 36. FRANCE RIDE ON BIKES MARKET, BY SALES CHANNEL, 2021-2031 (REVENUE, $MILLION)
- TABLE 37. FRANCE RIDE ON BIKES MARKET, BY PROPULSION, 2021-2031 (REVENUE, $MILLION)
- TABLE 38. ITALY RIDE ON BIKES MARKET, BY AGE GROUP, 2021-2031 (REVENUE, $MILLION)
- TABLE 39. ITALY RIDE ON BIKES MARKET, BY SALES CHANNEL, 2021-2031 (REVENUE, $MILLION)
- TABLE 40. ITALY RIDE ON BIKES MARKET, BY PROPULSION, 2021-2031 (REVENUE, $MILLION)
- TABLE 41. REST OF EUROPE RIDE ON BIKES MARKET, BY AGE GROUP, 2021-2031 (REVENUE, $MILLION)
- TABLE 42. REST OF EUROPE RIDE ON BIKES MARKET, BY SALES CHANNEL, 2021-2031 (REVENUE, $MILLION)
- TABLE 43. REST OF EUROPE RIDE ON BIKES MARKET, BY PROPULSION, 2021-2031 (REVENUE, $MILLION)
- TABLE 44. ASIA-PACIFIC RIDE ON BIKES MARKET, BY AGE GROUP, 2021-2031 (REVENUE, $MILLION)
- TABLE 45. ASIA-PACIFIC RIDE ON BIKES MARKET, BY SALES CHANNEL, 2021-2031 (REVENUE, $MILLION)
- TABLE 46. ASIA-PACIFIC RIDE ON BIKES MARKET, BY PROPULSION, 2021-2031 (REVENUE, $MILLION)
- TABLE 47. ASIA-PACIFIC RIDE ON BIKES MARKET, BY COUNTRY, 2021-2031 (REVENUE, $MILLION)
- TABLE 48. CHINA RIDE ON BIKES MARKET, BY AGE GROUP, 2021-2031 (REVENUE, $MILLION)
- TABLE 49. CHINA RIDE ON BIKES MARKET, BY SALES CHANNEL, 2021-2031 (REVENUE, $MILLION)
- TABLE 50. CHINA RIDE ON BIKES MARKET, BY PROPULSION, 2021-2031 (REVENUE, $MILLION)
- TABLE 51. INDIA RIDE ON BIKES MARKET, BY AGE GROUP, 2021-2031 (REVENUE, $MILLION)
- TABLE 52. INDIA RIDE ON BIKES MARKET, BY SALES CHANNEL, 2021-2031 (REVENUE, $MILLION)
- TABLE 53. INDIA RIDE ON BIKES MARKET, BY PROPULSION, 2021-2031 (REVENUE, $MILLION)
- TABLE 54. JAPAN RIDE ON BIKES MARKET, BY AGE GROUP, 2021-2031 (REVENUE, $MILLION)
- TABLE 55. JAPAN RIDE ON BIKES MARKET, BY SALES CHANNEL, 2021-2031 (REVENUE, $MILLION)
- TABLE 56. JAPAN RIDE ON BIKES MARKET, BY PROPULSION, 2021-2031 (REVENUE, $MILLION)
- TABLE 57. SOUTH KOREA RIDE ON BIKES MARKET, BY AGE GROUP, 2021-2031 (REVENUE, $MILLION)
- TABLE 58. SOUTH KOREA RIDE ON BIKES MARKET, BY SALES CHANNEL, 2021-2031 (REVENUE, $MILLION)
- TABLE 59. SOUTH KOREA RIDE ON BIKES MARKET, BY PROPULSION, 2021-2031 (REVENUE, $MILLION)
- TABLE 60. REST OF ASIA-PACIFIC RIDE ON BIKES MARKET, BY AGE GROUP, 2021-2031 (REVENUE, $MILLION)
- TABLE 61. REST OF ASIA-PACIFIC RIDE ON BIKES MARKET, BY SALES CHANNEL, 2021-2031 (REVENUE, $MILLION)
- TABLE 62. REST OF ASIA-PACIFIC RIDE ON BIKES MARKET, BY PROPULSION, 2021-2031 (REVENUE, $MILLION)
- TABLE 63. LAMEA RIDE ON BIKES MARKET, BY AGE GROUP, 2021-2031 (REVENUE, $MILLION)
- TABLE 64. LAMEA RIDE ON BIKES MARKET, BY SALES CHANNEL, 2021-2031 (REVENUE, $MILLION)
- TABLE 65. LAMEA RIDE ON BIKES MARKET, BY PROPULSION, 2021-2031 (REVENUE, $MILLION)
- TABLE 66. LAMEA RIDE ON BIKES MARKET, BY COUNTRY, 2021-2031 (REVENUE, $MILLION)
- TABLE 67. LATIN AMERICA RIDE ON BIKES MARKET, BY AGE GROUP, 2021-2031 (REVENUE, $MILLION)
- TABLE 68. LATIN AMERICA RIDE ON BIKES MARKET, BY SALES CHANNEL, 2021-2031 (REVENUE, $MILLION)
- TABLE 69. LATIN AMERICA RIDE ON BIKES MARKET, BY PROPULSION, 2021-2031 (REVENUE, $MILLION)
- TABLE 70. MIDDLE EAST RIDE ON BIKES MARKET, BY AGE GROUP, 2021-2031 (REVENUE, $MILLION)
- TABLE 71. MIDDLE EAST RIDE ON BIKES MARKET, BY SALES CHANNEL, 2021-2031 (REVENUE, $MILLION)
- TABLE 72. MIDDLE EAST RIDE ON BIKES MARKET, BY PROPULSION, 2021-2031 (REVENUE, $MILLION)
- TABLE 73. AFRICA RIDE ON BIKES MARKET, BY AGE GROUP, 2021-2031 (REVENUE, $MILLION)
- TABLE 74. AFRICA RIDE ON BIKES MARKET, BY SALES CHANNEL, 2021-2031 (REVENUE, $MILLION)
- TABLE 75. AFRICA RIDE ON BIKES MARKET, BY PROPULSION, 2021-2031 (REVENUE, $MILLION)
- TABLE 76. COSTZON: KEY EXECUTIVES
- TABLE 77. COSTZON: COMPANY SNAPSHOT
- TABLE 78. COSTZON: PRODUCT SEGMENTS
- TABLE 79. COSTZON: PRODUCT PORTFOLIO
- TABLE 80. HUFFY CORPORATION: KEY EXECUTIVES
- TABLE 81. HUFFY CORPORATION: COMPANY SNAPSHOT
- TABLE 82. HUFFY CORPORATION: PRODUCT SEGMENTS
- TABLE 83. HUFFY CORPORATION: PRODUCT PORTFOLIO
- TABLE 84. HUFFY CORPORATION: KEY STRATERGIES
- TABLE 85. RAZOR USA LLC: KEY EXECUTIVES
- TABLE 86. RAZOR USA LLC: COMPANY SNAPSHOT
- TABLE 87. RAZOR USA LLC: PRODUCT SEGMENTS
- TABLE 88. RAZOR USA LLC: PRODUCT PORTFOLIO
- TABLE 89. TOBBI: KEY EXECUTIVES
- TABLE 90. TOBBI: COMPANY SNAPSHOT
- TABLE 91. TOBBI: PRODUCT SEGMENTS
- TABLE 92. TOBBI: PRODUCT PORTFOLIO
- TABLE 93. SUZUKI MOTOR CORPORATION: KEY EXECUTIVES
- TABLE 94. SUZUKI MOTOR CORPORATION: COMPANY SNAPSHOT
- TABLE 95. SUZUKI MOTOR CORPORATION: PRODUCT SEGMENTS
- TABLE 96. SUZUKI MOTOR CORPORATION: PRODUCT PORTFOLIO
- TABLE 97. SUZUKI MOTOR CORPORATION: KEY STRATERGIES
- TABLE 98. HONDA MOTOR CO., LTD.: KEY EXECUTIVES
- TABLE 99. HONDA MOTOR CO., LTD.: COMPANY SNAPSHOT
- TABLE 100. HONDA MOTOR CO., LTD.: PRODUCT SEGMENTS
- TABLE 101. HONDA MOTOR CO., LTD.: PRODUCT PORTFOLIO
- TABLE 102. YAMAHA MOTOR CO., LTD.: KEY EXECUTIVES
- TABLE 103. YAMAHA MOTOR CO., LTD.: COMPANY SNAPSHOT
- TABLE 104. YAMAHA MOTOR CO., LTD.: PRODUCT SEGMENTS
- TABLE 105. YAMAHA MOTOR CO., LTD.: PRODUCT PORTFOLIO
- TABLE 106. KAWASAKI HEAVY INDUSTRIES, LTD.: KEY EXECUTIVES
- TABLE 107. KAWASAKI HEAVY INDUSTRIES, LTD.: COMPANY SNAPSHOT
- TABLE 108. KAWASAKI HEAVY INDUSTRIES, LTD.: PRODUCT SEGMENTS
- TABLE 109. KAWASAKI HEAVY INDUSTRIES, LTD.: PRODUCT PORTFOLIO
- TABLE 110. KTM AG: KEY EXECUTIVES
- TABLE 111. KTM AG: COMPANY SNAPSHOT
- TABLE 112. KTM AG: PRODUCT SEGMENTS
- TABLE 113. KTM AG: PRODUCT PORTFOLIO
- TABLE 114. KTM AG: KEY STRATERGIES
- TABLE 115. WOOM GMBH: KEY EXECUTIVES
- TABLE 116. WOOM GMBH: COMPANY SNAPSHOT
- TABLE 117. WOOM GMBH: PRODUCT SEGMENTS
- TABLE 118. WOOM GMBH: PRODUCT PORTFOLIO
- TABLE 119. WOOM GMBH: KEY STRATERGIES
LIST OF FIGURES
- FIGURE 01. RIDE ON BIKES MARKET, 2021-2031
- FIGURE 02. SEGMENTATION OF RIDE ON BIKES MARKET, 2021-2031
- FIGURE 03. TOP INVESTMENT POCKETS IN RIDE ON BIKES MARKET (2022-2031)
- FIGURE 04. MODERATE BARGAINING POWER OF SUPPLIERS
- FIGURE 05. LOW BARGAINING POWER OF BUYERS
- FIGURE 06. MODERATE THREAT OF SUBSTITUTES
- FIGURE 07. MODERATE THREAT OF NEW ENTRANTS
- FIGURE 08. MODERATE INTENSITY OF RIVALRY
- FIGURE 09. DRIVERS, RESTRAINTS AND OPPORTUNITIES: GLOBALRIDE ON BIKES MARKET
- FIGURE 10. RIDE ON BIKES MARKET, BY AGE GROUP, 2021(%)
- FIGURE 11. COMPARATIVE SHARE ANALYSIS OF RIDE ON BIKES MARKET FOR 1 TO 6 YEARS, BY COUNTRY 2021-2031(%)
- FIGURE 12. COMPARATIVE SHARE ANALYSIS OF RIDE ON BIKES MARKET FOR 7 TO 12 YEARS, BY COUNTRY 2021-2031(%)
- FIGURE 13. COMPARATIVE SHARE ANALYSIS OF RIDE ON BIKES MARKET FOR GREATER THAN 12 YEARS, BY COUNTRY 2021-2031(%)
- FIGURE 14. RIDE ON BIKES MARKET, BY SALES CHANNEL, 2021(%)
- FIGURE 15. COMPARATIVE SHARE ANALYSIS OF RIDE ON BIKES MARKET FOR OFFLINE, BY COUNTRY 2021-2031(%)
- FIGURE 16. COMPARATIVE SHARE ANALYSIS OF RIDE ON BIKES MARKET FOR ONLINE, BY COUNTRY 2021-2031(%)
- FIGURE 17. RIDE ON BIKES MARKET, BY PROPULSION, 2021(%)
- FIGURE 18. COMPARATIVE SHARE ANALYSIS OF RIDE ON BIKES MARKET FOR NON-MOTORIZED, BY COUNTRY 2021-2031(%)
- FIGURE 19. COMPARATIVE SHARE ANALYSIS OF RIDE ON BIKES MARKET FOR MOTORIZED, BY COUNTRY 2021-2031(%)
- FIGURE 20. RIDE ON BIKES MARKET BY REGION, 2021
- FIGURE 21. U.S. RIDE ON BIKES MARKET, 2021-2031 ($MILLION)
- FIGURE 22. CANADA RIDE ON BIKES MARKET, 2021-2031 ($MILLION)
- FIGURE 23. MEXICO RIDE ON BIKES MARKET, 2021-2031 ($MILLION)
- FIGURE 24. UK RIDE ON BIKES MARKET, 2021-2031 ($MILLION)
- FIGURE 25. GERMANY RIDE ON BIKES MARKET, 2021-2031 ($MILLION)
- FIGURE 26. FRANCE RIDE ON BIKES MARKET, 2021-2031 ($MILLION)
- FIGURE 27. ITALY RIDE ON BIKES MARKET, 2021-2031 ($MILLION)
- FIGURE 28. REST OF EUROPE RIDE ON BIKES MARKET, 2021-2031 ($MILLION)
- FIGURE 29. CHINA RIDE ON BIKES MARKET, 2021-2031 ($MILLION)
- FIGURE 30. INDIA RIDE ON BIKES MARKET, 2021-2031 ($MILLION)
- FIGURE 31. JAPAN RIDE ON BIKES MARKET, 2021-2031 ($MILLION)
- FIGURE 32. SOUTH KOREA RIDE ON BIKES MARKET, 2021-2031 ($MILLION)
- FIGURE 33. REST OF ASIA-PACIFIC RIDE ON BIKES MARKET, 2021-2031 ($MILLION)
- FIGURE 34. LATIN AMERICA RIDE ON BIKES MARKET, 2021-2031 ($MILLION)
- FIGURE 35. MIDDLE EAST RIDE ON BIKES MARKET, 2021-2031 ($MILLION)
- FIGURE 36. AFRICA RIDE ON BIKES MARKET, 2021-2031 ($MILLION)
- FIGURE 37. TOP WINNING STRATEGIES, BY YEAR
- FIGURE 38. TOP WINNING STRATEGIES, BY DEVELOPMENT
- FIGURE 39. TOP WINNING STRATEGIES, BY COMPANY
- FIGURE 40. PRODUCT MAPPING OF TOP 10 PLAYERS
- FIGURE 41. COMPETITIVE DASHBOARD
- FIGURE 42. COMPETITIVE HEATMAP: RIDE ON BIKES MARKET
- FIGURE 43. TOP PLAYER POSITIONING, 2021
- FIGURE 44. SUZUKI MOTOR CORPORATION: NET SALES, 2019-2021 ($MILLION)
- FIGURE 45. SUZUKI MOTOR CORPORATION: REVENUE SHARE BY SEGMENT, 2021 (%)
- FIGURE 46. SUZUKI MOTOR CORPORATION: REVENUE SHARE BY REGION, 2021 (%)
- FIGURE 47. HONDA MOTOR CO., LTD.: RESEARCH & DEVELOPMENT EXPENDITURE, 2019-2021
- FIGURE 48. HONDA MOTOR CO., LTD.: NET SALES, 2019-2021 ($MILLION)
- FIGURE 49. HONDA MOTOR CO., LTD.: REVENUE SHARE BY SEGMENT, 2021 (%)
- FIGURE 50. HONDA MOTOR CO., LTD.: REVENUE SHARE BY REGION, 2021 (%)
- FIGURE 51. YAMAHA MOTOR CO., LTD.: RESEARCH & DEVELOPMENT EXPENDITURE, 2019-2021
- FIGURE 52. YAMAHA MOTOR CO., LTD.: NET SALES, 2019-2021 ($MILLION)
- FIGURE 53. YAMAHA MOTOR CO., LTD.: REVENUE SHARE BY SEGMENT, 2021 (%)
- FIGURE 54. YAMAHA MOTOR CO., LTD.: REVENUE SHARE BY REGION, 2021 (%)
- FIGURE 55. KAWASAKI HEAVY INDUSTRIES, LTD.: RESEARCH & DEVELOPMENT EXPENDITURE, 2019-2021
- FIGURE 56. KAWASAKI HEAVY INDUSTRIES, LTD.: NET SALES, 2019-2021 ($MILLION)
- FIGURE 57. KAWASAKI HEAVY INDUSTRIES, LTD.: REVENUE SHARE BY SEGMENT, 2021 (%)
- FIGURE 58. KTM AG: RESEARCH & DEVELOPMENT EXPENDITURE, 2019-2021
- FIGURE 59. KTM AG: NET SALES, 2019-2021 ($MILLION)
- FIGURE 60. KTM AG: REVENUE SHARE BY SEGMENT, 2021 (%)
- FIGURE 61. KTM AG: REVENUE SHARE BY REGION, 2021 (%)
Ride on bikes are increasingly being used to encourage children to stay away from smart devices and gadgets and engage in fun physical activities. There is an increase in demand for ride on bikes for kids to improve gross motor skills by working on coordination, endurance, and strengthening. The manufacturers are increasingly launching new products owing to an increase in demand for bikes. For instance, in September 2022, Honda announced its plans to launch at least 10 all-electric motorcycles by the year 2025, which include an electric motorcycle designed for kids. Such developments are expected to boost the growth of the market.
Some motorized ride on bikes are operated by a lithium-ion battery. The rechargeable battery is installed in the bike to provide power. Manufacturers provide charger with the ride on bikes to charge the battery. Commonly, batteries feature two indicators: one that shows when it is charging and another that indicates when it is ready to use. Children's ride on bikes can last more than 5 years, the battery lasts about 2 years with constant use. Ride on bikes are also propelled by an engine and are gas-powered. These ride on bike are equipped with two- stroked or four-stoked engine. The ride on bikes operated by engine are commonly used by young racers for dirt bike riding.
Offline distribution channel is the traditional method of selling the ride on bikes to customers. Offline distribution channel is dominant across the globe owing to easy access and immediate product availability. The presence of the seller helps the consumer to choose the best product. The ability to directly compare different products before purchasing makes offline channel a preferred option. Children look forward to the experience of buying their favorite ride on bikes. The demand for touch and feel experience in offline channel is expected to drive the growth of the segment in the market.
There has been increase in popularity of electric balance bikes, which provide the ability to reach the ground comfortably allowing riders to learn without training wheels. Market players are developing lightweight electric balance bikes equipped with different modes to cater to the growing market demand. For instance, in June 2022, GASGAS, a motorcycle manufacturer developed a partnership with ebike specialist Stacyc to update its 12eDrive and 16eDrive balance bikes for the 2022 model year. The e-balance bikes are designed to give young kids a safe and enjoyable first-time experience on two wheels.
Moreover, new product launches are expected to increase the demand for electric balance bikes. For instance, in September 2019, Harley-Davidson launched the first duo of electric-powered balance bikes for kids designed for 3 to 7 year-old kids. The electric balance bikes arrived in two models, one for the young ones (IRONe12) and another for the older kids (IRONe16). Such factors are expected to provide significant opportunities for the growth of the market.
The ride on bikes market is segmented on the basis of age, propulsion, distribution channel, and region. By propulsion, it is divided into motorized and non-motorized. On the basis of age, it is segmented into 1 to 6 years, 6 to 12 years, and greater than 12 years. By distribution channel, the market is divided into online, and offline. By region, the market is analyzed across North America, Europe, Asia-Pacific, and LAMEA.
The leading companies profiled in the report include Razor USA LLC, TOBBI, Suzuki Motor Corporation, Honda Motor Co., Ltd., Kawasaki Heavy Industries, Ltd., KTM AG, Costzon, Huffy Corporation, Woom GmbH, and Yamaha Motor Co., Ltd.
Key Benefits For Stakeholders
- This report provides a quantitative analysis of the market segments, current trends, estimations, and dynamics of the ride on bikes market analysis from 2021 to 2031 to identify the prevailing ride on bikes market opportunities.
- The market research is offered along with information related to key drivers, restraints, and opportunities.
- Porter's five forces analysis highlights the potency of buyers and suppliers to enable stakeholders make profit-oriented business decisions and strengthen their supplier-buyer network.
- In-depth analysis of the ride on bikes market segmentation assists to determine the prevailing market opportunities.
- Major countries in each region are mapped according to their revenue contribution to the global market.
- Market player positioning facilitates benchmarking and provides a clear understanding of the present position of the market players.
- The report includes the analysis of the regional as well as global ride on bikes market trends, key players, market segments, application areas, and market growth strategies.
Key Market Segments
By Age Group
- 1 to 6 years
- 7 to 12 years
- Greater than 12 years
By Sales Channel
- Offline
- Online
By Propulsion
- Non-motorized
- Motorized
By Region
- North America
- U.S.
- Canada
- Mexico
- Europe
- UK
- Germany
- France
- Italy
- Rest of Europe
- Asia-Pacific
- China
- India
- Japan
- South Korea
- Rest of Asia-Pacific
- LAMEA
- Latin America
- Middle East
- Africa
Key Market Players
- Razor USA LLC
- TOBBI
- Suzuki Motor Corporation
- Honda Motor Co., Ltd.
- Kawasaki Heavy Industries, Ltd.
- KTM AG
- Costzon
- woom GmbH
- Yamaha Motor Co., Ltd.
- Huffy Corporation
TABLE OF CONTENTS
CHAPTER 1: INTRODUCTION
- 1.1. Report description
- 1.2. Key market segments
- 1.3. Key benefits to the stakeholders
- 1.4. Research Methodology
- 1.4.1. Primary research
- 1.4.2. Secondary research
- 1.4.3. Analyst tools and models
CHAPTER 2: EXECUTIVE SUMMARY
- 2.1. CXO Perspective
CHAPTER 3: MARKET OVERVIEW
- 3.1. Market definition and scope
- 3.2. Key findings
- 3.2.1. Top impacting factors
- 3.2.2. Top investment pockets
- 3.3. Porter's five forces analysis
- 3.3.1. Moderate bargaining power of suppliers
- 3.3.2. Low bargaining power of buyers
- 3.3.3. Moderate threat of substitutes
- 3.3.4. Moderate threat of new entrants
- 3.3.5. Moderate intensity of rivalry
- 3.4. Market dynamics
- 3.4.1. Drivers
- 3.4.1.1. Introduction of new features in ride on bikes
- 3.4.1.2. Increase in demand for ride on bikes for the development of gross and motor skills in kids
- 3.4.1.3. Rise in demand for ride on bikes for racing and off-road driving
- 3.4.2. Restraints
- 3.4.2.1. Surge in popularity of online games among kids
- 3.4.2.2. Increase in battery prices
- 3.4.3. Opportunities
- 3.4.3.1. Rising inclination toward biking as a physical activity
- 3.4.3.2. Growing popularity of lightweight electric balance bikes
- 3.4.1. Drivers
- 3.5. COVID-19 Impact Analysis on the market
CHAPTER 4: RIDE ON BIKES MARKET, BY AGE GROUP
- 4.1. Overview
- 4.1.1. Market size and forecast
- 4.2. 1 to 6 years
- 4.2.1. Key market trends, growth factors and opportunities
- 4.2.2. Market size and forecast, by region
- 4.2.3. Market share analysis by country
- 4.3. 7 to 12 years
- 4.3.1. Key market trends, growth factors and opportunities
- 4.3.2. Market size and forecast, by region
- 4.3.3. Market share analysis by country
- 4.4. Greater than 12 years
- 4.4.1. Key market trends, growth factors and opportunities
- 4.4.2. Market size and forecast, by region
- 4.4.3. Market share analysis by country
CHAPTER 5: RIDE ON BIKES MARKET, BY SALES CHANNEL
- 5.1. Overview
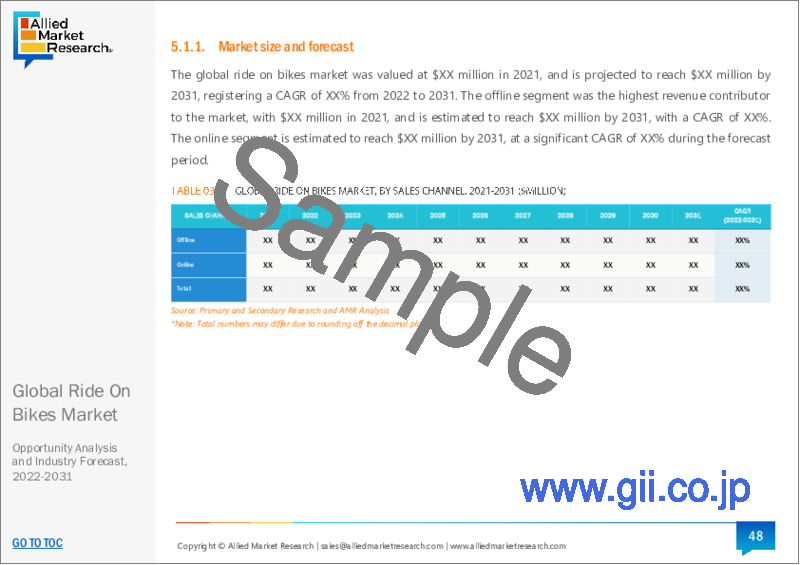
- 5.1.1. Market size and forecast
- 5.2. Offline
- 5.2.1. Key market trends, growth factors and opportunities
- 5.2.2. Market size and forecast, by region
- 5.2.3. Market share analysis by country
- 5.3. Online
- 5.3.1. Key market trends, growth factors and opportunities
- 5.3.2. Market size and forecast, by region
- 5.3.3. Market share analysis by country
CHAPTER 6: RIDE ON BIKES MARKET, BY PROPULSION
- 6.1. Overview
- 6.1.1. Market size and forecast
- 6.2. Non-motorized
- 6.2.1. Key market trends, growth factors and opportunities
- 6.2.2. Market size and forecast, by region
- 6.2.3. Market share analysis by country
- 6.3. Motorized
- 6.3.1. Key market trends, growth factors and opportunities
- 6.3.2. Market size and forecast, by region
- 6.3.3. Market share analysis by country
CHAPTER 7: RIDE ON BIKES MARKET, BY REGION
- 7.1. Overview
- 7.1.1. Market size and forecast By Region
- 7.2. North America
- 7.2.1. Key trends and opportunities
- 7.2.2. Market size and forecast, by Age Group
- 7.2.3. Market size and forecast, by Sales Channel
- 7.2.4. Market size and forecast, by Propulsion
- 7.2.5. Market size and forecast, by country
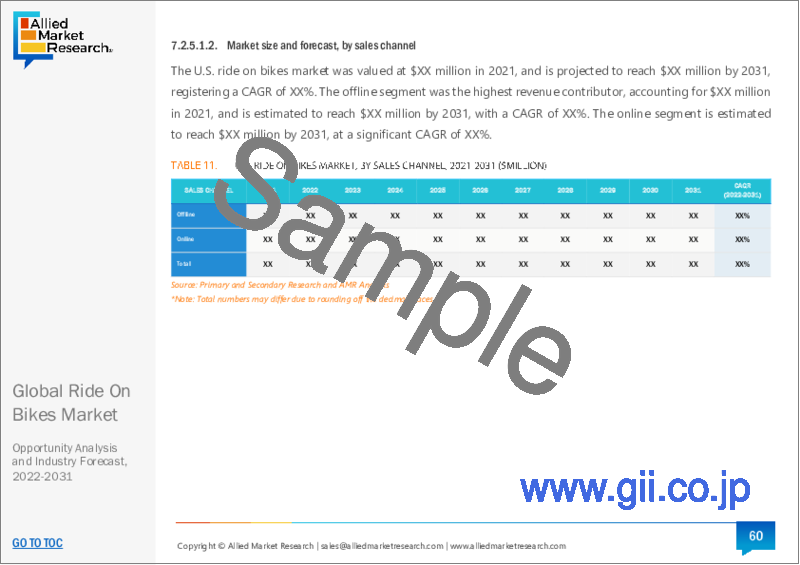
- 7.2.5.1. U.S.
- 7.2.5.1.1. Key market trends, growth factors and opportunities
- 7.2.5.1.2. Market size and forecast, by Age Group
- 7.2.5.1.3. Market size and forecast, by Sales Channel
- 7.2.5.1.4. Market size and forecast, by Propulsion
- 7.2.5.2. Canada
- 7.2.5.2.1. Key market trends, growth factors and opportunities
- 7.2.5.2.2. Market size and forecast, by Age Group
- 7.2.5.2.3. Market size and forecast, by Sales Channel
- 7.2.5.2.4. Market size and forecast, by Propulsion
- 7.2.5.3. Mexico
- 7.2.5.3.1. Key market trends, growth factors and opportunities
- 7.2.5.3.2. Market size and forecast, by Age Group
- 7.2.5.3.3. Market size and forecast, by Sales Channel
- 7.2.5.3.4. Market size and forecast, by Propulsion
- 7.3. Europe
- 7.3.1. Key trends and opportunities
- 7.3.2. Market size and forecast, by Age Group
- 7.3.3. Market size and forecast, by Sales Channel
- 7.3.4. Market size and forecast, by Propulsion
- 7.3.5. Market size and forecast, by country
- 7.3.5.1. UK
- 7.3.5.1.1. Key market trends, growth factors and opportunities
- 7.3.5.1.2. Market size and forecast, by Age Group
- 7.3.5.1.3. Market size and forecast, by Sales Channel
- 7.3.5.1.4. Market size and forecast, by Propulsion
- 7.3.5.2. Germany
- 7.3.5.2.1. Key market trends, growth factors and opportunities
- 7.3.5.2.2. Market size and forecast, by Age Group
- 7.3.5.2.3. Market size and forecast, by Sales Channel
- 7.3.5.2.4. Market size and forecast, by Propulsion
- 7.3.5.3. France
- 7.3.5.3.1. Key market trends, growth factors and opportunities
- 7.3.5.3.2. Market size and forecast, by Age Group
- 7.3.5.3.3. Market size and forecast, by Sales Channel
- 7.3.5.3.4. Market size and forecast, by Propulsion
- 7.3.5.4. Italy
- 7.3.5.4.1. Key market trends, growth factors and opportunities
- 7.3.5.4.2. Market size and forecast, by Age Group
- 7.3.5.4.3. Market size and forecast, by Sales Channel
- 7.3.5.4.4. Market size and forecast, by Propulsion
- 7.3.5.5. Rest of Europe
- 7.3.5.5.1. Key market trends, growth factors and opportunities
- 7.3.5.5.2. Market size and forecast, by Age Group
- 7.3.5.5.3. Market size and forecast, by Sales Channel
- 7.3.5.5.4. Market size and forecast, by Propulsion
- 7.4. Asia-Pacific
- 7.4.1. Key trends and opportunities
- 7.4.2. Market size and forecast, by Age Group
- 7.4.3. Market size and forecast, by Sales Channel
- 7.4.4. Market size and forecast, by Propulsion
- 7.4.5. Market size and forecast, by country
- 7.4.5.1. China
- 7.4.5.1.1. Key market trends, growth factors and opportunities
- 7.4.5.1.2. Market size and forecast, by Age Group
- 7.4.5.1.3. Market size and forecast, by Sales Channel
- 7.4.5.1.4. Market size and forecast, by Propulsion
- 7.4.5.2. India
- 7.4.5.2.1. Key market trends, growth factors and opportunities
- 7.4.5.2.2. Market size and forecast, by Age Group
- 7.4.5.2.3. Market size and forecast, by Sales Channel
- 7.4.5.2.4. Market size and forecast, by Propulsion
- 7.4.5.3. Japan
- 7.4.5.3.1. Key market trends, growth factors and opportunities
- 7.4.5.3.2. Market size and forecast, by Age Group
- 7.4.5.3.3. Market size and forecast, by Sales Channel
- 7.4.5.3.4. Market size and forecast, by Propulsion
- 7.4.5.4. South Korea
- 7.4.5.4.1. Key market trends, growth factors and opportunities
- 7.4.5.4.2. Market size and forecast, by Age Group
- 7.4.5.4.3. Market size and forecast, by Sales Channel
- 7.4.5.4.4. Market size and forecast, by Propulsion
- 7.4.5.5. Rest of Asia-Pacific
- 7.4.5.5.1. Key market trends, growth factors and opportunities
- 7.4.5.5.2. Market size and forecast, by Age Group
- 7.4.5.5.3. Market size and forecast, by Sales Channel
- 7.4.5.5.4. Market size and forecast, by Propulsion
- 7.5. LAMEA
- 7.5.1. Key trends and opportunities
- 7.5.2. Market size and forecast, by Age Group
- 7.5.3. Market size and forecast, by Sales Channel
- 7.5.4. Market size and forecast, by Propulsion
- 7.5.5. Market size and forecast, by country
- 7.5.5.1. Latin America
- 7.5.5.1.1. Key market trends, growth factors and opportunities
- 7.5.5.1.2. Market size and forecast, by Age Group
- 7.5.5.1.3. Market size and forecast, by Sales Channel
- 7.5.5.1.4. Market size and forecast, by Propulsion
- 7.5.5.2. Middle East
- 7.5.5.2.1. Key market trends, growth factors and opportunities
- 7.5.5.2.2. Market size and forecast, by Age Group
- 7.5.5.2.3. Market size and forecast, by Sales Channel
- 7.5.5.2.4. Market size and forecast, by Propulsion
- 7.5.5.3. Africa
- 7.5.5.3.1. Key market trends, growth factors and opportunities
- 7.5.5.3.2. Market size and forecast, by Age Group
- 7.5.5.3.3. Market size and forecast, by Sales Channel
- 7.5.5.3.4. Market size and forecast, by Propulsion
CHAPTER 8: COMPETITIVE LANDSCAPE
- 8.1. Introduction
- 8.2. Top winning strategies
- 8.3. Product Mapping of Top 10 Player
- 8.4. Competitive Dashboard
- 8.5. Competitive Heatmap
- 8.6. Top player positioning, 2021
CHAPTER 9: COMPANY PROFILES
- 9.1. Costzon
- 9.1.1. Company overview
- 9.1.2. Key Executives
- 9.1.3. Company snapshot
- 9.1.4. Operating business segments
- 9.1.5. Product portfolio
- 9.2. Huffy Corporation
- 9.2.1. Company overview
- 9.2.2. Key Executives
- 9.2.3. Company snapshot
- 9.2.4. Operating business segments
- 9.2.5. Product portfolio
- 9.2.6. Key strategic moves and developments
- 9.3. Razor USA LLC
- 9.3.1. Company overview
- 9.3.2. Key Executives
- 9.3.3. Company snapshot
- 9.3.4. Operating business segments
- 9.3.5. Product portfolio
- 9.4. TOBBI
- 9.4.1. Company overview
- 9.4.2. Key Executives
- 9.4.3. Company snapshot
- 9.4.4. Operating business segments
- 9.4.5. Product portfolio
- 9.5. Suzuki Motor Corporation
- 9.5.1. Company overview
- 9.5.2. Key Executives
- 9.5.3. Company snapshot
- 9.5.4. Operating business segments
- 9.5.5. Product portfolio
- 9.5.6. Business performance
- 9.5.7. Key strategic moves and developments
- 9.6. Honda Motor Co., Ltd.
- 9.6.1. Company overview
- 9.6.2. Key Executives
- 9.6.3. Company snapshot
- 9.6.4. Operating business segments
- 9.6.5. Product portfolio
- 9.6.6. Business performance
- 9.7. Yamaha Motor Co., Ltd.
- 9.7.1. Company overview
- 9.7.2. Key Executives
- 9.7.3. Company snapshot
- 9.7.4. Operating business segments
- 9.7.5. Product portfolio
- 9.7.6. Business performance
- 9.8. Kawasaki Heavy Industries, Ltd.
- 9.8.1. Company overview
- 9.8.2. Key Executives
- 9.8.3. Company snapshot
- 9.8.4. Operating business segments
- 9.8.5. Product portfolio
- 9.8.6. Business performance
- 9.9. KTM AG
- 9.9.1. Company overview
- 9.9.2. Key Executives
- 9.9.3. Company snapshot
- 9.9.4. Operating business segments
- 9.9.5. Product portfolio
- 9.9.6. Business performance
- 9.9.7. Key strategic moves and developments
- 9.10. woom GmbH
- 9.10.1. Company overview
- 9.10.2. Key Executives
- 9.10.3. Company snapshot
- 9.10.4. Operating business segments
- 9.10.5. Product portfolio
- 9.10.6. Key strategic moves and developments