|
|
市場調査レポート
商品コード
1193127
昆虫飼料市場:製品タイプ別(ミルワーム、ハエの幼虫、カイコ、セミ、その他)、最終用途別(ペットフード、養殖、家畜)、エンドユーザー別(家庭用、商業用):世界の機会分析および産業予測、2021-2031年Insect Feed Market By Product Type (Meal Worms, Fly Larvae, Silkworm, Cicadas, Other), By End Use (Pet Food, Aquaculture, Livestock), By End User (Residential, Commerical): Global Opportunity Analysis and Industry Forecast, 2021-2031 |
||||||
|
|
|||||||


| 昆虫飼料市場:製品タイプ別(ミルワーム、ハエの幼虫、カイコ、セミ、その他)、最終用途別(ペットフード、養殖、家畜)、エンドユーザー別(家庭用、商業用):世界の機会分析および産業予測、2021-2031年 |
|
出版日: 2022年10月01日
発行: Allied Market Research
ページ情報: 英文 231 Pages
納期: 2~3営業日
|
- 全表示
- 概要
- 図表
- 目次
昆虫飼料の世界市場は、2021年に2億6150万米ドル、2031年には21億8,200万米ドルに達し、CAGR24.5%を記録すると予測されています。
昆虫飼料業界は現在、食料需要の増加、人口の増加、都市化の進展、フードサービス部門の成長によって牽引されています。さらに、有機栽培の家畜に対する需要の増加が、昆虫飼料市場の需要を促進しています。昆虫飼料はカルシウム、アミノ酸、リジン、メチオニンを豊富に含んでいます。北米市場は、主要な市場プレイヤーの存在により、着実な成長を示すと推定されます。
国連食糧農業機関(FAO)によると、食用昆虫は食糧安全保障を強化するための大きな可能性を提供します。昆虫ベースの食事は、健康で強い家畜を生産することができます。昆虫飼料は、動物の食事に含まれる魚粉や大豆ミールを25~100%代替することができ、悪影響はないです。また、昆虫飼料を摂取することで、体重や収量が増加します。食用昆虫は、その高い栄養価や多様性、入手のしやすさから、ユニークな飼料の選択肢となります。
先進国では、3分の1の世帯がペットを飼っています。従来、ペットの飼い主は、家族の食事の残り物やクズなどをペットに与えていました。しかし、ペットフードやサプリメントは、ペットの健康増進を目的に製造されたものであることが、飼い主に認知されつつあります。また、ペットを飼うことで、運動する機会が増え、ストレスが軽減されるなど、さまざまなメリットがあることから、ペットを飼う人が増えています。American Veterinary Medical Foundation(AVMF)の調査によると、ペットを飼っているアメリカ人の10人中9人が、ペットを家族の一員と考えていることが分かっています。米国ペット用品協会(APPA)が実施した「2018年全米ペット飼育者調査」によると、米国では68%の世帯がペットを飼育しています。同国のペットに対する支出は2007年の41.2%から2018年には69.4%に増加し、そのうちペットフードに費やすお金は40~45%以上を占めているそうです。合わせて、ペットのヒューマニゼーションが進むことで、予測期間中に昆虫飼料の需要が増加することが予想されることを示しています。
また、食肉製品の需要増は、畜産業における昆虫飼料の需要を派生させると思われます。畜産業界は、近代的な集約生産方式の導入、予防的疾病管理の改善、遺伝子の改良、人口および可処分所得の増加、都市化などにより、過去20年間に大きな構造変化を遂げました。これらのことが相まって、養鶏業者には収入向上のための大きな機会が提供されています。それとは別に、食品の安全性、トレーサビリティ、厳格な食品政策のためのコンプライアンスに対する高い需要は、順番に昆虫飼料市場の需要を推進する家畜飼料市場の成長をサポートする可能性があります。
しかし、ペットのアレルギー反応が市場成長の妨げになる可能性があります。生産者の間では有機飼料に対する需要が高まっており、昆虫飼料メーカーにビジネスチャンスをもたらすと考えられます。
目次
第1章 イントロダクション
第2章 エグゼクティブサマリー
第3章 市場の概要
- 市場の定義と範囲
- 主な調査結果
- 主な投資ポケット
- ポーターのファイブフォース分析
- 主要企業のポジショニング
- 市場力学
- 促進要因
- 抑制要因
- 機会
- COVID-19 影響分析
第4章 昆虫飼料市場:製品タイプ別
- 概要
- 市場規模および予測
- ミルワーム
- 主な市場動向、成長要因、機会
- 市場規模・予測:地域別
- 市場分析:国別
- ハエの幼虫
- 主な市場動向、成長要因、機会
- 市場規模・予測:地域別
- 市場分析:国別
- カイコ
- 主な市場動向、成長要因、機会
- 市場規模・予測:地域別
- 市場分析:国別
- セミ
- 主な市場動向、成長要因、機会
- 市場規模・予測:地域別
- 市場分析:国別
- その他
- 主な市場動向、成長要因、機会
- 市場規模・予測:地域別
- 市場分析:国別
第5章 昆虫飼料市場:エンドユーザー別
- 概要
- 市場規模・予測
- ペットフード
- 主な市場動向、成長要因、機会
- 市場規模・予測:地域別
- 市場分析:国別
- 水産養殖
- 主要な市場動向、成長要因、機会
- 市場規模・予測:地域別
- 市場分析:国別
- 畜産分野
- 主要な市場動向、成長要因、機会
- 市場規模・予測:地域別
- 市場分析:国別
第6章 昆虫飼料市場:エンドユーザー別
- 概要
- 市場規模・予測
- 住宅分野
- 主な市場動向、成長要因、機会
- 市場規模・予測:地域別
- 市場分析:国別
- 商業用
- 主な市場動向、成長要因、機会
- 市場規模・予測:地域別
- 市場分析:国別
第7章 昆虫飼料市場:地域別
- 概要
- 市場規模・予測
- 北米
- 主な動向と機会
- 北米市場規模・予測:製品タイプ別
- 北米市場規模・予測:エンドユーザー別
- 北米市場の市場規模・予測:エンドユーザー別
- 北米市場規模・予測:国別
- 米国
- カナダ
- メキシコ
- 欧州
- 主な動向と機会
- 欧州市場規模・予測:製品タイプ別
- 欧州市場規模・予測:エンドユーザー別
- 欧州市場規模・予測:エンドユーザー別
- 欧州市場規模・予測:国別
- ドイツ
- 英国
- イタリア
- フランス
- スペイン
- ロシア
- その他欧州
- アジア太平洋地域
- 主な動向と機会
- アジア太平洋地域の市場規模・予測:製品タイプ別
- アジア太平洋地域の市場規模・予測:エンドユーザー別
- アジア太平洋地域の市場規模・予測:エンドユーザー別
- アジア太平洋地域の市場規模・予測:国別
- 中国
- 日本
- インド
- 韓国
- オーストラリア
- シンガポール
- ニュージーランド
- その他アジア太平洋地域
- LAMEA
- 主な動向と機会
- LAMEAの市場規模・予測:製品タイプ別
- LAMEAの市場規模・予測:エンドユーザー別
- LAMEAの市場規模・予測:エンドユーザー別
- LAMEAの市場規模・予測:国別
- ブラジル
- アルゼンチン
- 南アフリカ共和国
- サウジアラビア
- アラブ首長国連邦
- その他の地域
第8章 企業情勢
- イントロダクション
- 主要成功戦略
- 主要10社の製品マッピング
- 競合ダッシュボード
- 競合のヒートマップ
- 主な発展
第9章 企業プロファイル
- Nutrition Technologies
- JR Unique Foods Ltd.
- protix
- senterra corporation
- Endofood Sdn Bhd
- EnviroFlight
- Nasekomo
- innovafeed
- Hexafly
- Alltech Coppens
- DeliBugs
- Kreca Ento-Feed BV
- YNSECT
- Nusect
- Protenga
- Beta Hatch
- Entobel
LIST OF TABLES
- TABLE 1. GLOBAL INSECT FEED MARKET, BY PRODUCT TYPE, 2021-2031 ($MILLION)
- TABLE 2. INSECT FEED MARKET, FOR MEAL WORMS, BY REGION, 2021-2031 ($MILLION)
- TABLE 3. INSECT FEED MARKET FOR MEAL WORMS, BY COUNTRY, 2021-2031 ($MILLION)
- TABLE 4. INSECT FEED MARKET, FOR FLY LARVAE, BY REGION, 2021-2031 ($MILLION)
- TABLE 5. INSECT FEED MARKET FOR FLY LARVAE, BY COUNTRY, 2021-2031 ($MILLION)
- TABLE 6. INSECT FEED MARKET, FOR SILKWORM, BY REGION, 2021-2031 ($MILLION)
- TABLE 7. INSECT FEED MARKET FOR SILKWORM, BY COUNTRY, 2021-2031 ($MILLION)
- TABLE 8. INSECT FEED MARKET, FOR CICADAS, BY REGION, 2021-2031 ($MILLION)
- TABLE 9. INSECT FEED MARKET FOR CICADAS, BY COUNTRY, 2021-2031 ($MILLION)
- TABLE 10. INSECT FEED MARKET, FOR OTHER, BY REGION, 2021-2031 ($MILLION)
- TABLE 11. INSECT FEED MARKET FOR OTHER, BY COUNTRY, 2021-2031 ($MILLION)
- TABLE 12. GLOBAL INSECT FEED MARKET, BY END USE, 2021-2031 ($MILLION)
- TABLE 13. INSECT FEED MARKET, FOR PET FOOD, BY REGION, 2021-2031 ($MILLION)
- TABLE 14. INSECT FEED MARKET FOR PET FOOD, BY COUNTRY, 2021-2031 ($MILLION)
- TABLE 15. INSECT FEED MARKET, FOR AQUACULTURE, BY REGION, 2021-2031 ($MILLION)
- TABLE 16. INSECT FEED MARKET FOR AQUACULTURE, BY COUNTRY, 2021-2031 ($MILLION)
- TABLE 17. INSECT FEED MARKET, FOR LIVESTOCK, BY REGION, 2021-2031 ($MILLION)
- TABLE 18. INSECT FEED MARKET FOR LIVESTOCK, BY COUNTRY, 2021-2031 ($MILLION)
- TABLE 19. GLOBAL INSECT FEED MARKET, BY END USER, 2021-2031 ($MILLION)
- TABLE 20. INSECT FEED MARKET, FOR RESIDENTIAL, BY REGION, 2021-2031 ($MILLION)
- TABLE 21. INSECT FEED MARKET FOR RESIDENTIAL, BY COUNTRY, 2021-2031 ($MILLION)
- TABLE 22. INSECT FEED MARKET, FOR COMMERICAL, BY REGION, 2021-2031 ($MILLION)
- TABLE 23. INSECT FEED MARKET FOR COMMERICAL, BY COUNTRY, 2021-2031 ($MILLION)
- TABLE 24. INSECT FEED MARKET, BY REGION, 2021-2031 ($MILLION)
- TABLE 25. NORTH AMERICA INSECT FEED MARKET, BY PRODUCT TYPE, 2021-2031 ($MILLION)
- TABLE 26. NORTH AMERICA INSECT FEED MARKET, BY END USE, 2021-2031 ($MILLION)
- TABLE 27. NORTH AMERICA INSECT FEED MARKET, BY END USER, 2021-2031 ($MILLION)
- TABLE 28. NORTH AMERICA INSECT FEED MARKET, BY COUNTRY, 2021-2031 ($MILLION)
- TABLE 29. U.S. INSECT FEED MARKET, BY PRODUCT TYPE, 2021-2031 ($MILLION)
- TABLE 30. U.S. INSECT FEED MARKET, BY END USE, 2021-2031 ($MILLION)
- TABLE 31. U.S. INSECT FEED MARKET, BY END USER, 2021-2031 ($MILLION)
- TABLE 32. CANADA INSECT FEED MARKET, BY PRODUCT TYPE, 2021-2031 ($MILLION)
- TABLE 33. CANADA INSECT FEED MARKET, BY END USE, 2021-2031 ($MILLION)
- TABLE 34. CANADA INSECT FEED MARKET, BY END USER, 2021-2031 ($MILLION)
- TABLE 35. MEXICO INSECT FEED MARKET, BY PRODUCT TYPE, 2021-2031 ($MILLION)
- TABLE 36. MEXICO INSECT FEED MARKET, BY END USE, 2021-2031 ($MILLION)
- TABLE 37. MEXICO INSECT FEED MARKET, BY END USER, 2021-2031 ($MILLION)
- TABLE 38. EUROPE INSECT FEED MARKET, BY PRODUCT TYPE, 2021-2031 ($MILLION)
- TABLE 39. EUROPE INSECT FEED MARKET, BY END USE, 2021-2031 ($MILLION)
- TABLE 40. EUROPE INSECT FEED MARKET, BY END USER, 2021-2031 ($MILLION)
- TABLE 41. EUROPE INSECT FEED MARKET, BY COUNTRY, 2021-2031 ($MILLION)
- TABLE 42. GERMANY INSECT FEED MARKET, BY PRODUCT TYPE, 2021-2031 ($MILLION)
- TABLE 43. GERMANY INSECT FEED MARKET, BY END USE, 2021-2031 ($MILLION)
- TABLE 44. GERMANY INSECT FEED MARKET, BY END USER, 2021-2031 ($MILLION)
- TABLE 45. UK INSECT FEED MARKET, BY PRODUCT TYPE, 2021-2031 ($MILLION)
- TABLE 46. UK INSECT FEED MARKET, BY END USE, 2021-2031 ($MILLION)
- TABLE 47. UK INSECT FEED MARKET, BY END USER, 2021-2031 ($MILLION)
- TABLE 48. ITALY INSECT FEED MARKET, BY PRODUCT TYPE, 2021-2031 ($MILLION)
- TABLE 49. ITALY INSECT FEED MARKET, BY END USE, 2021-2031 ($MILLION)
- TABLE 50. ITALY INSECT FEED MARKET, BY END USER, 2021-2031 ($MILLION)
- TABLE 51. FRANCE INSECT FEED MARKET, BY PRODUCT TYPE, 2021-2031 ($MILLION)
- TABLE 52. FRANCE INSECT FEED MARKET, BY END USE, 2021-2031 ($MILLION)
- TABLE 53. FRANCE INSECT FEED MARKET, BY END USER, 2021-2031 ($MILLION)
- TABLE 54. SPAIN INSECT FEED MARKET, BY PRODUCT TYPE, 2021-2031 ($MILLION)
- TABLE 55. SPAIN INSECT FEED MARKET, BY END USE, 2021-2031 ($MILLION)
- TABLE 56. SPAIN INSECT FEED MARKET, BY END USER, 2021-2031 ($MILLION)
- TABLE 57. RUSSIA INSECT FEED MARKET, BY PRODUCT TYPE, 2021-2031 ($MILLION)
- TABLE 58. RUSSIA INSECT FEED MARKET, BY END USE, 2021-2031 ($MILLION)
- TABLE 59. RUSSIA INSECT FEED MARKET, BY END USER, 2021-2031 ($MILLION)
- TABLE 60. REST OF EUROPE INSECT FEED MARKET, BY PRODUCT TYPE, 2021-2031 ($MILLION)
- TABLE 61. REST OF EUROPE INSECT FEED MARKET, BY END USE, 2021-2031 ($MILLION)
- TABLE 62. REST OF EUROPE INSECT FEED MARKET, BY END USER, 2021-2031 ($MILLION)
- TABLE 63. ASIA-PACIFIC INSECT FEED MARKET, BY PRODUCT TYPE, 2021-2031 ($MILLION)
- TABLE 64. ASIA-PACIFIC INSECT FEED MARKET, BY END USE, 2021-2031 ($MILLION)
- TABLE 65. ASIA-PACIFIC INSECT FEED MARKET, BY END USER, 2021-2031 ($MILLION)
- TABLE 66. ASIA-PACIFIC INSECT FEED MARKET, BY COUNTRY, 2021-2031 ($MILLION)
- TABLE 67. CHINA INSECT FEED MARKET, BY PRODUCT TYPE, 2021-2031 ($MILLION)
- TABLE 68. CHINA INSECT FEED MARKET, BY END USE, 2021-2031 ($MILLION)
- TABLE 69. CHINA INSECT FEED MARKET, BY END USER, 2021-2031 ($MILLION)
- TABLE 70. JAPAN INSECT FEED MARKET, BY PRODUCT TYPE, 2021-2031 ($MILLION)
- TABLE 71. JAPAN INSECT FEED MARKET, BY END USE, 2021-2031 ($MILLION)
- TABLE 72. JAPAN INSECT FEED MARKET, BY END USER, 2021-2031 ($MILLION)
- TABLE 73. INDIA INSECT FEED MARKET, BY PRODUCT TYPE, 2021-2031 ($MILLION)
- TABLE 74. INDIA INSECT FEED MARKET, BY END USE, 2021-2031 ($MILLION)
- TABLE 75. INDIA INSECT FEED MARKET, BY END USER, 2021-2031 ($MILLION)
- TABLE 76. SOUTH KOREA INSECT FEED MARKET, BY PRODUCT TYPE, 2021-2031 ($MILLION)
- TABLE 77. SOUTH KOREA INSECT FEED MARKET, BY END USE, 2021-2031 ($MILLION)
- TABLE 78. SOUTH KOREA INSECT FEED MARKET, BY END USER, 2021-2031 ($MILLION)
- TABLE 79. AUSTRALIA INSECT FEED MARKET, BY PRODUCT TYPE, 2021-2031 ($MILLION)
- TABLE 80. AUSTRALIA INSECT FEED MARKET, BY END USE, 2021-2031 ($MILLION)
- TABLE 81. AUSTRALIA INSECT FEED MARKET, BY END USER, 2021-2031 ($MILLION)
- TABLE 82. SINGAPORE INSECT FEED MARKET, BY PRODUCT TYPE, 2021-2031 ($MILLION)
- TABLE 83. SINGAPORE INSECT FEED MARKET, BY END USE, 2021-2031 ($MILLION)
- TABLE 84. SINGAPORE INSECT FEED MARKET, BY END USER, 2021-2031 ($MILLION)
- TABLE 85. NEW ZEALAND INSECT FEED MARKET, BY PRODUCT TYPE, 2021-2031 ($MILLION)
- TABLE 86. NEW ZEALAND INSECT FEED MARKET, BY END USE, 2021-2031 ($MILLION)
- TABLE 87. NEW ZEALAND INSECT FEED MARKET, BY END USER, 2021-2031 ($MILLION)
- TABLE 88. REST OF ASIA-PACIFIC INSECT FEED MARKET, BY PRODUCT TYPE, 2021-2031 ($MILLION)
- TABLE 89. REST OF ASIA-PACIFIC INSECT FEED MARKET, BY END USE, 2021-2031 ($MILLION)
- TABLE 90. REST OF ASIA-PACIFIC INSECT FEED MARKET, BY END USER, 2021-2031 ($MILLION)
- TABLE 91. LAMEA INSECT FEED MARKET, BY PRODUCT TYPE, 2021-2031 ($MILLION)
- TABLE 92. LAMEA INSECT FEED MARKET, BY END USE, 2021-2031 ($MILLION)
- TABLE 93. LAMEA INSECT FEED MARKET, BY END USER, 2021-2031 ($MILLION)
- TABLE 94. LAMEA INSECT FEED MARKET, BY COUNTRY, 2021-2031 ($MILLION)
- TABLE 95. BRAZIL INSECT FEED MARKET, BY PRODUCT TYPE, 2021-2031 ($MILLION)
- TABLE 96. BRAZIL INSECT FEED MARKET, BY END USE, 2021-2031 ($MILLION)
- TABLE 97. BRAZIL INSECT FEED MARKET, BY END USER, 2021-2031 ($MILLION)
- TABLE 98. ARGENTINA INSECT FEED MARKET, BY PRODUCT TYPE, 2021-2031 ($MILLION)
- TABLE 99. ARGENTINA INSECT FEED MARKET, BY END USE, 2021-2031 ($MILLION)
- TABLE 100. ARGENTINA INSECT FEED MARKET, BY END USER, 2021-2031 ($MILLION)
- TABLE 101. SOUTH AFRICA INSECT FEED MARKET, BY PRODUCT TYPE, 2021-2031 ($MILLION)
- TABLE 102. SOUTH AFRICA INSECT FEED MARKET, BY END USE, 2021-2031 ($MILLION)
- TABLE 103. SOUTH AFRICA INSECT FEED MARKET, BY END USER, 2021-2031 ($MILLION)
- TABLE 104. SAUDI ARABIA INSECT FEED MARKET, BY PRODUCT TYPE, 2021-2031 ($MILLION)
- TABLE 105. SAUDI ARABIA INSECT FEED MARKET, BY END USE, 2021-2031 ($MILLION)
- TABLE 106. SAUDI ARABIA INSECT FEED MARKET, BY END USER, 2021-2031 ($MILLION)
- TABLE 107. UNITED ARAB EMIRATES INSECT FEED MARKET, BY PRODUCT TYPE, 2021-2031 ($MILLION)
- TABLE 108. UNITED ARAB EMIRATES INSECT FEED MARKET, BY END USE, 2021-2031 ($MILLION)
- TABLE 109. UNITED ARAB EMIRATES INSECT FEED MARKET, BY END USER, 2021-2031 ($MILLION)
- TABLE 110. REST OF LAMEA INSECT FEED MARKET, BY PRODUCT TYPE, 2021-2031 ($MILLION)
- TABLE 111. REST OF LAMEA INSECT FEED MARKET, BY END USE, 2021-2031 ($MILLION)
- TABLE 112. REST OF LAMEA INSECT FEED MARKET, BY END USER, 2021-2031 ($MILLION)
- TABLE 113.NUTRITION TECHNOLOGIES: COMPANY SNAPSHOT
- TABLE 114.NUTRITION TECHNOLOGIES: OPERATING SEGMENTS
- TABLE 115.NUTRITION TECHNOLOGIES: PRODUCT PORTFOLIO
- TABLE 116.NUTRITION TECHNOLOGIES: NET SALES,
- TABLE 117.NUTRITION TECHNOLOGIES: KEY STRATERGIES
- TABLE 118.JR UNIQUE FOODS LTD.: COMPANY SNAPSHOT
- TABLE 119.JR UNIQUE FOODS LTD.: OPERATING SEGMENTS
- TABLE 120.JR UNIQUE FOODS LTD.: PRODUCT PORTFOLIO
- TABLE 121.JR UNIQUE FOODS LTD.: NET SALES,
- TABLE 122.JR UNIQUE FOODS LTD.: KEY STRATERGIES
- TABLE 123.PROTIX: COMPANY SNAPSHOT
- TABLE 124.PROTIX: OPERATING SEGMENTS
- TABLE 125.PROTIX: PRODUCT PORTFOLIO
- TABLE 126.PROTIX: NET SALES,
- TABLE 127.PROTIX: KEY STRATERGIES
- TABLE 128.SENTERRA CORPORATION: COMPANY SNAPSHOT
- TABLE 129.SENTERRA CORPORATION: OPERATING SEGMENTS
- TABLE 130.SENTERRA CORPORATION: PRODUCT PORTFOLIO
- TABLE 131.SENTERRA CORPORATION: NET SALES,
- TABLE 132.SENTERRA CORPORATION: KEY STRATERGIES
- TABLE 133.ENDOFOOD SDN BHD: COMPANY SNAPSHOT
- TABLE 134.ENDOFOOD SDN BHD: OPERATING SEGMENTS
- TABLE 135.ENDOFOOD SDN BHD: PRODUCT PORTFOLIO
- TABLE 136.ENDOFOOD SDN BHD: NET SALES,
- TABLE 137.ENDOFOOD SDN BHD: KEY STRATERGIES
- TABLE 138.ENVIROFLIGHT: COMPANY SNAPSHOT
- TABLE 139.ENVIROFLIGHT: OPERATING SEGMENTS
- TABLE 140.ENVIROFLIGHT: PRODUCT PORTFOLIO
- TABLE 141.ENVIROFLIGHT: NET SALES,
- TABLE 142.ENVIROFLIGHT: KEY STRATERGIES
- TABLE 143.NASEKOMO: COMPANY SNAPSHOT
- TABLE 144.NASEKOMO: OPERATING SEGMENTS
- TABLE 145.NASEKOMO: PRODUCT PORTFOLIO
- TABLE 146.NASEKOMO: NET SALES,
- TABLE 147.NASEKOMO: KEY STRATERGIES
- TABLE 148.INNOVAFEED: COMPANY SNAPSHOT
- TABLE 149.INNOVAFEED: OPERATING SEGMENTS
- TABLE 150.INNOVAFEED: PRODUCT PORTFOLIO
- TABLE 151.INNOVAFEED: NET SALES,
- TABLE 152.INNOVAFEED: KEY STRATERGIES
- TABLE 153.HEXAFLY: COMPANY SNAPSHOT
- TABLE 154.HEXAFLY: OPERATING SEGMENTS
- TABLE 155.HEXAFLY: PRODUCT PORTFOLIO
- TABLE 156.HEXAFLY: NET SALES,
- TABLE 157.HEXAFLY: KEY STRATERGIES
- TABLE 158.ALLTECH COPPENS: COMPANY SNAPSHOT
- TABLE 159.ALLTECH COPPENS: OPERATING SEGMENTS
- TABLE 160.ALLTECH COPPENS: PRODUCT PORTFOLIO
- TABLE 161.ALLTECH COPPENS: NET SALES,
- TABLE 162.ALLTECH COPPENS: KEY STRATERGIES
- TABLE 163.DELIBUGS: COMPANY SNAPSHOT
- TABLE 164.DELIBUGS: OPERATING SEGMENTS
- TABLE 165.DELIBUGS: PRODUCT PORTFOLIO
- TABLE 166.DELIBUGS: NET SALES,
- TABLE 167.DELIBUGS: KEY STRATERGIES
- TABLE 168.KRECA ENTO-FEED BV: COMPANY SNAPSHOT
- TABLE 169.KRECA ENTO-FEED BV: OPERATING SEGMENTS
- TABLE 170.KRECA ENTO-FEED BV: PRODUCT PORTFOLIO
- TABLE 171.KRECA ENTO-FEED BV: NET SALES,
- TABLE 172.KRECA ENTO-FEED BV: KEY STRATERGIES
- TABLE 173.YNSECT: COMPANY SNAPSHOT
- TABLE 174.YNSECT: OPERATING SEGMENTS
- TABLE 175.YNSECT: PRODUCT PORTFOLIO
- TABLE 176.YNSECT: NET SALES,
- TABLE 177.YNSECT: KEY STRATERGIES
- TABLE 178.NUSECT: COMPANY SNAPSHOT
- TABLE 179.NUSECT: OPERATING SEGMENTS
- TABLE 180.NUSECT: PRODUCT PORTFOLIO
- TABLE 181.NUSECT: NET SALES,
- TABLE 182.NUSECT: KEY STRATERGIES
- TABLE 183.PROTENGA: COMPANY SNAPSHOT
- TABLE 184.PROTENGA: OPERATING SEGMENTS
- TABLE 185.PROTENGA: PRODUCT PORTFOLIO
- TABLE 186.PROTENGA: NET SALES,
- TABLE 187.PROTENGA: KEY STRATERGIES
- TABLE 188.BETA HATCH: COMPANY SNAPSHOT
- TABLE 189.BETA HATCH: OPERATING SEGMENTS
- TABLE 190.BETA HATCH: PRODUCT PORTFOLIO
- TABLE 191.BETA HATCH: NET SALES,
- TABLE 192.BETA HATCH: KEY STRATERGIES
- TABLE 193.ENTOBEL: COMPANY SNAPSHOT
- TABLE 194.ENTOBEL: OPERATING SEGMENTS
- TABLE 195.ENTOBEL: PRODUCT PORTFOLIO
- TABLE 196.ENTOBEL: NET SALES,
- TABLE 197.ENTOBEL: KEY STRATERGIES
LIST OF FIGURES
- FIGURE 1.INSECT FEED MARKET SEGMENTATION
- FIGURE 2.INSECT FEED MARKET,2021-2031
- FIGURE 3.INSECT FEED MARKET,2021-2031
- FIGURE 4. TOP INVESTMENT POCKETS, BY REGION
- FIGURE 5.PORTER FIVE-1
- FIGURE 6.PORTER FIVE-2
- FIGURE 7.PORTER FIVE-3
- FIGURE 8.PORTER FIVE-4
- FIGURE 9.PORTER FIVE-5
- FIGURE 10.TOP PLAYER POSITIONING
- FIGURE 11.INSECT FEED MARKET:DRIVERS, RESTRAINTS AND OPPORTUNITIES
- FIGURE 12.INSECT FEED MARKET,BY PRODUCT TYPE,2021(%)
- FIGURE 13.COMPARATIVE SHARE ANALYSIS OF MEAL WORMS INSECT FEED MARKET,2021-2031(%)
- FIGURE 14.COMPARATIVE SHARE ANALYSIS OF FLY LARVAE INSECT FEED MARKET,2021-2031(%)
- FIGURE 15.COMPARATIVE SHARE ANALYSIS OF SILKWORM INSECT FEED MARKET,2021-2031(%)
- FIGURE 16.COMPARATIVE SHARE ANALYSIS OF CICADAS INSECT FEED MARKET,2021-2031(%)
- FIGURE 17.COMPARATIVE SHARE ANALYSIS OF OTHER INSECT FEED MARKET,2021-2031(%)
- FIGURE 18.INSECT FEED MARKET,BY END USE,2021(%)
- FIGURE 19.COMPARATIVE SHARE ANALYSIS OF PET FOOD INSECT FEED MARKET,2021-2031(%)
- FIGURE 20.COMPARATIVE SHARE ANALYSIS OF AQUACULTURE INSECT FEED MARKET,2021-2031(%)
- FIGURE 21.COMPARATIVE SHARE ANALYSIS OF LIVESTOCK INSECT FEED MARKET,2021-2031(%)
- FIGURE 22.INSECT FEED MARKET,BY END USER,2021(%)
- FIGURE 23.COMPARATIVE SHARE ANALYSIS OF RESIDENTIAL INSECT FEED MARKET,2021-2031(%)
- FIGURE 24.COMPARATIVE SHARE ANALYSIS OF COMMERICAL INSECT FEED MARKET,2021-2031(%)
- FIGURE 25.INSECT FEED MARKET BY REGION,2021
- FIGURE 26.U.S. INSECT FEED MARKET,2021-2031($MILLION)
- FIGURE 27.CANADA INSECT FEED MARKET,2021-2031($MILLION)
- FIGURE 28.MEXICO INSECT FEED MARKET,2021-2031($MILLION)
- FIGURE 29.GERMANY INSECT FEED MARKET,2021-2031($MILLION)
- FIGURE 30.UK INSECT FEED MARKET,2021-2031($MILLION)
- FIGURE 31.ITALY INSECT FEED MARKET,2021-2031($MILLION)
- FIGURE 32.FRANCE INSECT FEED MARKET,2021-2031($MILLION)
- FIGURE 33.SPAIN INSECT FEED MARKET,2021-2031($MILLION)
- FIGURE 34.RUSSIA INSECT FEED MARKET,2021-2031($MILLION)
- FIGURE 35.REST OF EUROPE INSECT FEED MARKET,2021-2031($MILLION)
- FIGURE 36.CHINA INSECT FEED MARKET,2021-2031($MILLION)
- FIGURE 37.JAPAN INSECT FEED MARKET,2021-2031($MILLION)
- FIGURE 38.INDIA INSECT FEED MARKET,2021-2031($MILLION)
- FIGURE 39.SOUTH KOREA INSECT FEED MARKET,2021-2031($MILLION)
- FIGURE 40.AUSTRALIA INSECT FEED MARKET,2021-2031($MILLION)
- FIGURE 41.SINGAPORE INSECT FEED MARKET,2021-2031($MILLION)
- FIGURE 42.NEW ZEALAND INSECT FEED MARKET,2021-2031($MILLION)
- FIGURE 43.REST OF ASIA-PACIFIC INSECT FEED MARKET,2021-2031($MILLION)
- FIGURE 44.BRAZIL INSECT FEED MARKET,2021-2031($MILLION)
- FIGURE 45.ARGENTINA INSECT FEED MARKET,2021-2031($MILLION)
- FIGURE 46.SOUTH AFRICA INSECT FEED MARKET,2021-2031($MILLION)
- FIGURE 47.SAUDI ARABIA INSECT FEED MARKET,2021-2031($MILLION)
- FIGURE 48.UNITED ARAB EMIRATES INSECT FEED MARKET,2021-2031($MILLION)
- FIGURE 49.REST OF LAMEA INSECT FEED MARKET,2021-2031($MILLION)
- FIGURE 50. TOP WINNING STRATEGIES, BY YEAR
- FIGURE 51. TOP WINNING STRATEGIES, BY DEVELOPMENT
- FIGURE 52. TOP WINNING STRATEGIES, BY COMPANY
- FIGURE 53.PRODUCT MAPPING OF TOP 10 PLAYERS
- FIGURE 54.COMPETITIVE DASHBOARD
- FIGURE 55.COMPETITIVE HEATMAP OF TOP 10 KEY PLAYERS
- FIGURE 56.NUTRITION TECHNOLOGIES.: NET SALES ,($MILLION)
- FIGURE 57.JR UNIQUE FOODS LTD..: NET SALES ,($MILLION)
- FIGURE 58.PROTIX.: NET SALES ,($MILLION)
- FIGURE 59.SENTERRA CORPORATION.: NET SALES ,($MILLION)
- FIGURE 60.ENDOFOOD SDN BHD.: NET SALES ,($MILLION)
- FIGURE 61.ENVIROFLIGHT.: NET SALES ,($MILLION)
- FIGURE 62.NASEKOMO.: NET SALES ,($MILLION)
- FIGURE 63.INNOVAFEED.: NET SALES ,($MILLION)
- FIGURE 64.HEXAFLY.: NET SALES ,($MILLION)
- FIGURE 65.ALLTECH COPPENS.: NET SALES ,($MILLION)
- FIGURE 66.DELIBUGS.: NET SALES ,($MILLION)
- FIGURE 67.KRECA ENTO-FEED BV.: NET SALES ,($MILLION)
- FIGURE 68.YNSECT.: NET SALES ,($MILLION)
- FIGURE 69.NUSECT.: NET SALES ,($MILLION)
- FIGURE 70.PROTENGA.: NET SALES ,($MILLION)
- FIGURE 71.BETA HATCH.: NET SALES ,($MILLION)
- FIGURE 72.ENTOBEL.: NET SALES ,($MILLION)
The global insect feed market was valued at $261.5 million in 2021, and is projected to reach $2182 million by 2031, registering a CAGR of 24.5%. The insect feed industry is currently driven by increasing demand for food, growing population, rising urbanization, and growth of the food service sector. Furthermore, increasing demand for organically grown livestock will propel the demand for insect feed market. Insect feed are rich in calcium, amino acid, lysine, and methionine. North America market is estimated to witness steady growth owing to the presence of major market players.
According to Food and Agriculture Organization (FAO), edible insects offer huge potential for enhancing food security. The insect-based diet will produce healthy and stronger livestock. The insect feed can replace around 25 to 100% of fishmeal and soymeal in animals diet with no adverse effects. Also, the consumption of insect feed increase the body weight and yield. Edible insects through a combination of their high and varying nutritional content and ease in availability offers unique feed option.
The shift in pet ownership to parenting has been a very crucial and defining trend in the pet food market, especially in the developed countries. One third of the households in developed countries own a pet. Traditionally, pet owners fed their pet leftovers and scraps from family meals. However, pet owners are getting aware of pet food and supplements, which are manufactured with the focus to improve health of these animals. In addition, there has been a rise in adoption of pets and, owing to various benefits associated with them, such as increase in opportunities to exercise and decline in stress. American Veterinary Medical Foundation (AVMF) study shows that nine out of ten Americans, who own pets, consider them as a part of their families. According to the 2018 National Pet Owners Survey, conducted by the American Pet Products Association (APPA), 68% of households in the U.S. owned a pet. The expenditure on pets in the country increased from 41.2% in 2007 to 69.4% in 2018, out of which the money spent on pet food occupied over 40 to 45%. Collectively, it shows that increasing pet humanization is expected to increase the demand for insect feed during the forecast period.
The increasing demand for meat products will also derive the demand for insect feed among livestock. The livestock industry has undergone major structural changes during past two decades owing to the introduction of modern intensive production methods, improves preventive disease control, genetic improvements, increasing human population and disposable income, and urbanization. These collaboratively offers tremendous opportunity for poultry growers to improve their income. Apart from that, high demand for food security, traceability, and compliance owing to the strict food policies are likely to support the growth of livestock feed market which in turn will propel the demand for insect feed market.
However, allergic reactions among pets are likely to hamper the market growth. The demand for organic feed among growers will create an opportunity among insect feed manufacturers.
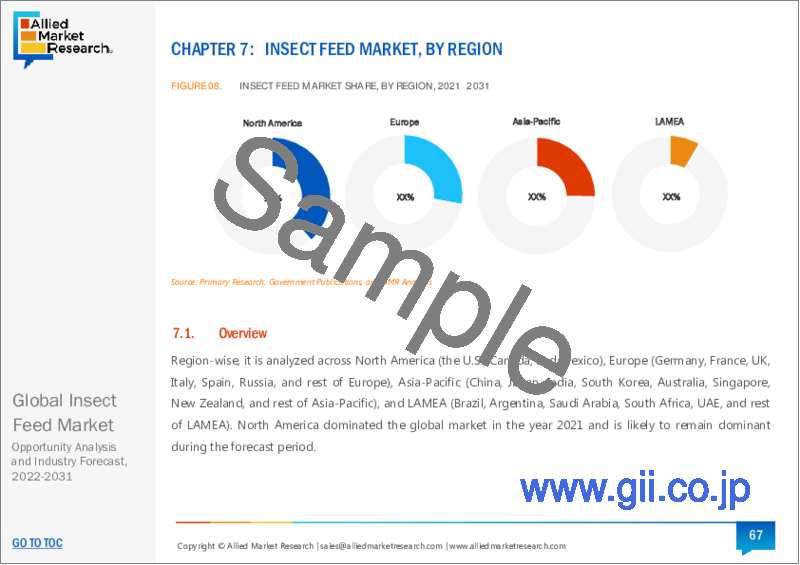
The global insect feed market is segmented into product type, end user, end use, and region. On the basis of product type, the market is categorized into meal worms, fly larvae, silkworm, cicadas, and others. By end user, it is fragmented into residential and commercial. Depending on end use, it is segregated into pet food, aquaculture, and livestock. Region wise, it is analyzed across North America (the U.S., Canada, and Mexico), Europe (Germany, France, UK, Italy, Spain, Russia, and rest of Europe), Asia-Pacific (China, Japan, India, South Korea, Australia, Singapore, New Zealand, and rest of Asia-Pacific), and LAMEA (Brazil, Argentina, Saudi Arabia, South Africa, UAE, and rest of LAMEA).
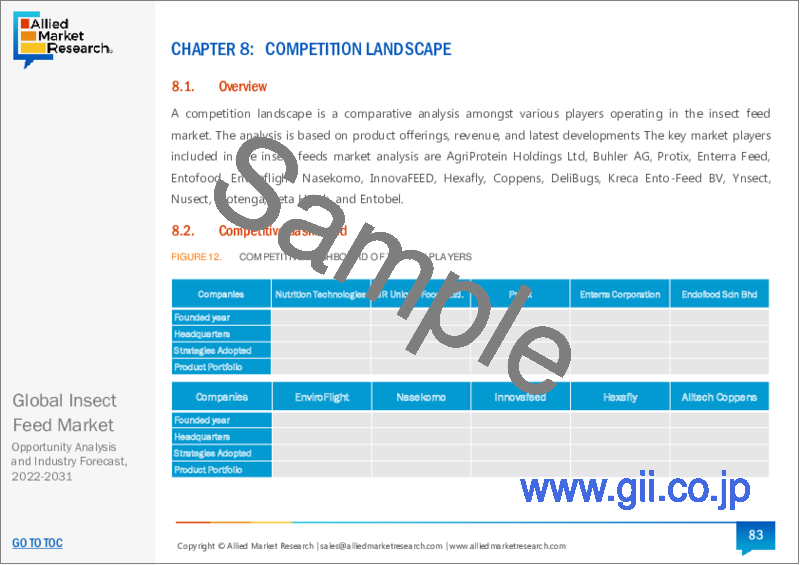
The key market players included in the insect feeds market analysis are AgriProtein Holdings Ltd, Buhler AG, Protix, Enterra Feed, entofood, enviroflight, Nasekomo, InnovaFEED, Hexafly, Coppens, DeliBugs, Kreca Ento-Feed BV, Ynsect, Nusect, Protenga, Beta Hatch, and Entobel.
Key Benefits For Stakeholders
- This report provides a quantitative analysis of the market segments, current trends, estimations, and dynamics of the insect feed market analysis from 2021 to 2031 to identify the prevailing insect feed market opportunities.
- The market research is offered along with information related to key drivers, restraints, and opportunities.
- Porter's five forces analysis highlights the potency of buyers and suppliers to enable stakeholders make profit-oriented business decisions and strengthen their supplier-buyer network.
- In-depth analysis of the insect feed market segmentation assists to determine the prevailing market opportunities.
- Major countries in each region are mapped according to their revenue contribution to the global market.
- Market player positioning facilitates benchmarking and provides a clear understanding of the present position of the market players.
- The report includes the analysis of the regional as well as global insect feed market trends, key players, market segments, application areas, and market growth strategies.
Key Market Segments
By Product Type
- Meal Worms
- Fly Larvae
- Silkworm
- Cicadas
- Other
By End Use
- Pet Food
- Aquaculture
- Livestock
By End User
- Residential
- Commerical
By Region
- North America
- U.S.
- Canada
- Mexico
- Europe
- Germany
- UK
- Italy
- France
- Spain
- Russia
- Rest Of Europe
- Asia-Pacific
- China
- Japan
- India
- South Korea
- Australia
- Singapore
- New Zealand
- Rest Of Asia-Pacific
- LAMEA
- Brazil
- Argentina
- South Africa
- Saudi Arabia
- United Arab Emirates
- Rest Of LAMEA
- Key Market Players
- Nutrition Technologies
- JR Unique Foods Ltd.
- protix
- senterra corporation
- Endofood Sdn Bhd
- EnviroFlight
- Nasekomo
- innovafeed
- Hexafly
- Alltech Coppens
- DeliBugs
- Kreca Ento-Feed BV
- YNSECT
- Nusect
- Protenga
- Beta Hatch
- Entobel
TABLE OF CONTENTS
CHAPTER 1:INTRODUCTION
- 1.1.Report description
- 1.2.Key market segments
- 1.3.Key benefits to the stakeholders
- 1.4.Research Methodology
- 1.4.1.Secondary research
- 1.4.2.Primary research
- 1.4.3.Analyst tools and models
CHAPTER 2:EXECUTIVE SUMMARY
- 2.1.Key findings of the study
- 2.2.CXO Perspective
CHAPTER 3:MARKET OVERVIEW
- 3.1.Market definition and scope
- 3.2.Key findings
- 3.2.1.Top investment pockets
- 3.3.Porter's five forces analysis
- 3.4.Top player positioning
- 3.5.Market dynamics
- 3.5.1.Drivers
- 3.5.2.Restraints
- 3.5.3.Opportunities
- 3.6.COVID-19 Impact Analysis on the market
CHAPTER 4: INSECT FEED MARKET, BY PRODUCT TYPE
- 4.1 Overview
- 4.1.1 Market size and forecast
- 4.2 Meal Worms
- 4.2.1 Key market trends, growth factors and opportunities
- 4.2.2 Market size and forecast, by region
- 4.2.3 Market analysis by country
- 4.3 Fly Larvae
- 4.3.1 Key market trends, growth factors and opportunities
- 4.3.2 Market size and forecast, by region
- 4.3.3 Market analysis by country
- 4.4 Silkworm
- 4.4.1 Key market trends, growth factors and opportunities
- 4.4.2 Market size and forecast, by region
- 4.4.3 Market analysis by country
- 4.5 Cicadas
- 4.5.1 Key market trends, growth factors and opportunities
- 4.5.2 Market size and forecast, by region
- 4.5.3 Market analysis by country
- 4.6 Other
- 4.6.1 Key market trends, growth factors and opportunities
- 4.6.2 Market size and forecast, by region
- 4.6.3 Market analysis by country
CHAPTER 5: INSECT FEED MARKET, BY END USE
- 5.1 Overview
- 5.1.1 Market size and forecast
- 5.2 Pet Food
- 5.2.1 Key market trends, growth factors and opportunities
- 5.2.2 Market size and forecast, by region
- 5.2.3 Market analysis by country
- 5.3 Aquaculture
- 5.3.1 Key market trends, growth factors and opportunities
- 5.3.2 Market size and forecast, by region
- 5.3.3 Market analysis by country
- 5.4 Livestock
- 5.4.1 Key market trends, growth factors and opportunities
- 5.4.2 Market size and forecast, by region
- 5.4.3 Market analysis by country
CHAPTER 6: INSECT FEED MARKET, BY END USER
- 6.1 Overview
- 6.1.1 Market size and forecast
- 6.2 Residential
- 6.2.1 Key market trends, growth factors and opportunities
- 6.2.2 Market size and forecast, by region
- 6.2.3 Market analysis by country
- 6.3 Commerical
- 6.3.1 Key market trends, growth factors and opportunities
- 6.3.2 Market size and forecast, by region
- 6.3.3 Market analysis by country
CHAPTER 7: INSECT FEED MARKET, BY REGION
- 7.1 Overview
- 7.1.1 Market size and forecast
- 7.2 North America
- 7.2.1 Key trends and opportunities
- 7.2.2 North America Market size and forecast, by Product Type
- 7.2.3 North America Market size and forecast, by End Use
- 7.2.4 North America Market size and forecast, by End User
- 7.2.5 North America Market size and forecast, by country
- 7.2.5.1 U.S.
- 7.2.5.1.1 Market size and forecast, by Product Type
- 7.2.5.1.2 Market size and forecast, by End Use
- 7.2.5.1.3 Market size and forecast, by End User
- 7.2.5.2 Canada
- 7.2.5.2.1 Market size and forecast, by Product Type
- 7.2.5.2.2 Market size and forecast, by End Use
- 7.2.5.2.3 Market size and forecast, by End User
- 7.2.5.3 Mexico
- 7.2.5.3.1 Market size and forecast, by Product Type
- 7.2.5.3.2 Market size and forecast, by End Use
- 7.2.5.3.3 Market size and forecast, by End User
- 7.3 Europe
- 7.3.1 Key trends and opportunities
- 7.3.2 Europe Market size and forecast, by Product Type
- 7.3.3 Europe Market size and forecast, by End Use
- 7.3.4 Europe Market size and forecast, by End User
- 7.3.5 Europe Market size and forecast, by country
- 7.3.5.1 Germany
- 7.3.5.1.1 Market size and forecast, by Product Type
- 7.3.5.1.2 Market size and forecast, by End Use
- 7.3.5.1.3 Market size and forecast, by End User
- 7.3.5.2 UK
- 7.3.5.2.1 Market size and forecast, by Product Type
- 7.3.5.2.2 Market size and forecast, by End Use
- 7.3.5.2.3 Market size and forecast, by End User
- 7.3.5.3 Italy
- 7.3.5.3.1 Market size and forecast, by Product Type
- 7.3.5.3.2 Market size and forecast, by End Use
- 7.3.5.3.3 Market size and forecast, by End User
- 7.3.5.4 France
- 7.3.5.4.1 Market size and forecast, by Product Type
- 7.3.5.4.2 Market size and forecast, by End Use
- 7.3.5.4.3 Market size and forecast, by End User
- 7.3.5.5 Spain
- 7.3.5.5.1 Market size and forecast, by Product Type
- 7.3.5.5.2 Market size and forecast, by End Use
- 7.3.5.5.3 Market size and forecast, by End User
- 7.3.5.6 Russia
- 7.3.5.6.1 Market size and forecast, by Product Type
- 7.3.5.6.2 Market size and forecast, by End Use
- 7.3.5.6.3 Market size and forecast, by End User
- 7.3.5.7 Rest of Europe
- 7.3.5.7.1 Market size and forecast, by Product Type
- 7.3.5.7.2 Market size and forecast, by End Use
- 7.3.5.7.3 Market size and forecast, by End User
- 7.4 Asia-Pacific
- 7.4.1 Key trends and opportunities
- 7.4.2 Asia-Pacific Market size and forecast, by Product Type
- 7.4.3 Asia-Pacific Market size and forecast, by End Use
- 7.4.4 Asia-Pacific Market size and forecast, by End User
- 7.4.5 Asia-Pacific Market size and forecast, by country
- 7.4.5.1 China
- 7.4.5.1.1 Market size and forecast, by Product Type
- 7.4.5.1.2 Market size and forecast, by End Use
- 7.4.5.1.3 Market size and forecast, by End User
- 7.4.5.2 Japan
- 7.4.5.2.1 Market size and forecast, by Product Type
- 7.4.5.2.2 Market size and forecast, by End Use
- 7.4.5.2.3 Market size and forecast, by End User
- 7.4.5.3 India
- 7.4.5.3.1 Market size and forecast, by Product Type
- 7.4.5.3.2 Market size and forecast, by End Use
- 7.4.5.3.3 Market size and forecast, by End User
- 7.4.5.4 South Korea
- 7.4.5.4.1 Market size and forecast, by Product Type
- 7.4.5.4.2 Market size and forecast, by End Use
- 7.4.5.4.3 Market size and forecast, by End User
- 7.4.5.5 Australia
- 7.4.5.5.1 Market size and forecast, by Product Type
- 7.4.5.5.2 Market size and forecast, by End Use
- 7.4.5.5.3 Market size and forecast, by End User
- 7.4.5.6 Singapore
- 7.4.5.6.1 Market size and forecast, by Product Type
- 7.4.5.6.2 Market size and forecast, by End Use
- 7.4.5.6.3 Market size and forecast, by End User
- 7.4.5.7 New Zealand
- 7.4.5.7.1 Market size and forecast, by Product Type
- 7.4.5.7.2 Market size and forecast, by End Use
- 7.4.5.7.3 Market size and forecast, by End User
- 7.4.5.8 Rest of Asia-Pacific
- 7.4.5.8.1 Market size and forecast, by Product Type
- 7.4.5.8.2 Market size and forecast, by End Use
- 7.4.5.8.3 Market size and forecast, by End User
- 7.5 LAMEA
- 7.5.1 Key trends and opportunities
- 7.5.2 LAMEA Market size and forecast, by Product Type
- 7.5.3 LAMEA Market size and forecast, by End Use
- 7.5.4 LAMEA Market size and forecast, by End User
- 7.5.5 LAMEA Market size and forecast, by country
- 7.5.5.1 Brazil
- 7.5.5.1.1 Market size and forecast, by Product Type
- 7.5.5.1.2 Market size and forecast, by End Use
- 7.5.5.1.3 Market size and forecast, by End User
- 7.5.5.2 Argentina
- 7.5.5.2.1 Market size and forecast, by Product Type
- 7.5.5.2.2 Market size and forecast, by End Use
- 7.5.5.2.3 Market size and forecast, by End User
- 7.5.5.3 South Africa
- 7.5.5.3.1 Market size and forecast, by Product Type
- 7.5.5.3.2 Market size and forecast, by End Use
- 7.5.5.3.3 Market size and forecast, by End User
- 7.5.5.4 Saudi Arabia
- 7.5.5.4.1 Market size and forecast, by Product Type
- 7.5.5.4.2 Market size and forecast, by End Use
- 7.5.5.4.3 Market size and forecast, by End User
- 7.5.5.5 United Arab Emirates
- 7.5.5.5.1 Market size and forecast, by Product Type
- 7.5.5.5.2 Market size and forecast, by End Use
- 7.5.5.5.3 Market size and forecast, by End User
- 7.5.5.6 Rest of LAMEA
- 7.5.5.6.1 Market size and forecast, by Product Type
- 7.5.5.6.2 Market size and forecast, by End Use
- 7.5.5.6.3 Market size and forecast, by End User
CHAPTER 8: COMPANY LANDSCAPE
- 8.1. Introduction
- 8.2. Top winning strategies
- 8.3. Product Mapping of Top 10 Player
- 8.4. Competitive Dashboard
- 8.5. Competitive Heatmap
- 8.6. Key developments
CHAPTER 9: COMPANY PROFILES
- 9.1 Nutrition Technologies
- 9.1.1 Company overview
- 9.1.2 Company snapshot
- 9.1.3 Operating business segments
- 9.1.4 Product portfolio
- 9.1.5 Business performance
- 9.1.6 Key strategic moves and developments
- 9.2 JR Unique Foods Ltd.
- 9.2.1 Company overview
- 9.2.2 Company snapshot
- 9.2.3 Operating business segments
- 9.2.4 Product portfolio
- 9.2.5 Business performance
- 9.2.6 Key strategic moves and developments
- 9.3 protix
- 9.3.1 Company overview
- 9.3.2 Company snapshot
- 9.3.3 Operating business segments
- 9.3.4 Product portfolio
- 9.3.5 Business performance
- 9.3.6 Key strategic moves and developments
- 9.4 senterra corporation
- 9.4.1 Company overview
- 9.4.2 Company snapshot
- 9.4.3 Operating business segments
- 9.4.4 Product portfolio
- 9.4.5 Business performance
- 9.4.6 Key strategic moves and developments
- 9.5 Endofood Sdn Bhd
- 9.5.1 Company overview
- 9.5.2 Company snapshot
- 9.5.3 Operating business segments
- 9.5.4 Product portfolio
- 9.5.5 Business performance
- 9.5.6 Key strategic moves and developments
- 9.6 EnviroFlight
- 9.6.1 Company overview
- 9.6.2 Company snapshot
- 9.6.3 Operating business segments
- 9.6.4 Product portfolio
- 9.6.5 Business performance
- 9.6.6 Key strategic moves and developments
- 9.7 Nasekomo
- 9.7.1 Company overview
- 9.7.2 Company snapshot
- 9.7.3 Operating business segments
- 9.7.4 Product portfolio
- 9.7.5 Business performance
- 9.7.6 Key strategic moves and developments
- 9.8 innovafeed
- 9.8.1 Company overview
- 9.8.2 Company snapshot
- 9.8.3 Operating business segments
- 9.8.4 Product portfolio
- 9.8.5 Business performance
- 9.8.6 Key strategic moves and developments
- 9.9 Hexafly
- 9.9.1 Company overview
- 9.9.2 Company snapshot
- 9.9.3 Operating business segments
- 9.9.4 Product portfolio
- 9.9.5 Business performance
- 9.9.6 Key strategic moves and developments
- 9.10 Alltech Coppens
- 9.10.1 Company overview
- 9.10.2 Company snapshot
- 9.10.3 Operating business segments
- 9.10.4 Product portfolio
- 9.10.5 Business performance
- 9.10.6 Key strategic moves and developments
- 9.11 DeliBugs
- 9.11.1 Company overview
- 9.11.2 Company snapshot
- 9.11.3 Operating business segments
- 9.11.4 Product portfolio
- 9.11.5 Business performance
- 9.11.6 Key strategic moves and developments
- 9.12 Kreca Ento-Feed BV
- 9.12.1 Company overview
- 9.12.2 Company snapshot
- 9.12.3 Operating business segments
- 9.12.4 Product portfolio
- 9.12.5 Business performance
- 9.12.6 Key strategic moves and developments
- 9.13 YNSECT
- 9.13.1 Company overview
- 9.13.2 Company snapshot
- 9.13.3 Operating business segments
- 9.13.4 Product portfolio
- 9.13.5 Business performance
- 9.13.6 Key strategic moves and developments
- 9.14 Nusect
- 9.14.1 Company overview
- 9.14.2 Company snapshot
- 9.14.3 Operating business segments
- 9.14.4 Product portfolio
- 9.14.5 Business performance
- 9.14.6 Key strategic moves and developments
- 9.15 Protenga
- 9.15.1 Company overview
- 9.15.2 Company snapshot
- 9.15.3 Operating business segments
- 9.15.4 Product portfolio
- 9.15.5 Business performance
- 9.15.6 Key strategic moves and developments
- 9.16 Beta Hatch
- 9.16.1 Company overview
- 9.16.2 Company snapshot
- 9.16.3 Operating business segments
- 9.16.4 Product portfolio
- 9.16.5 Business performance
- 9.16.6 Key strategic moves and developments
- 9.17 Entobel
- 9.17.1 Company overview
- 9.17.2 Company snapshot
- 9.17.3 Operating business segments
- 9.17.4 Product portfolio
- 9.17.5 Business performance
- 9.17.6 Key strategic moves and developments