|
|
市場調査レポート
商品コード
1140388
電子廃棄物からの貴金属回収市場:金属タイプ別(金、銅、銀、その他)、供給元別(家電製品、家電製品、IT・通信機器、その他) - 世界の機会分析および産業予測、2021-2030年Precious Metals E-Waste Recovery Market By Metal Type (Gold, Copper, Silver, Others), By Source (Home Appliances, Consumer Electronics, IT and Telecommunication Equipment, Others): Global Opportunity Analysis and Industry Forecast, 2021-2030 |
||||||
|
|
|||||||


| 電子廃棄物からの貴金属回収市場:金属タイプ別(金、銅、銀、その他)、供給元別(家電製品、家電製品、IT・通信機器、その他) - 世界の機会分析および産業予測、2021-2030年 |
|
出版日: 2022年08月01日
発行: Allied Market Research
ページ情報: 英文 310 Pages
納期: 2~3営業日
|
- 全表示
- 概要
- 図表
- 目次
世界の電子廃棄物からの貴金属回収市場は、2022年から2030年にかけてCAGR7.0%で2021年の94億3450万米ドルから成長し、2030年には186億4520万米ドルを獲得すると想定されています。
貴金属は、半導体、LED、OLED、太陽光発電システム、磁気データストレージ、受動部品、LEDとOLED、半導体など様々なアイテムで利用されており、現在のデジタル世界では必要不可欠なものです。貴金属は、化学工業や石油化学工業の触媒など、最終製品に重要な役割を果たすだけでなく、多くの工業プロセスで不可欠なものです。
市場拡大の大きな要因となっているのは、IT・通信分野の拡大です。これは、電子機器の消費量の増加によるもので、より高度な電子機器へのアップグレードが促進され、古くなった電子機器の廃棄に影響を与えています。このため、世界中で電子機器廃棄物の発生が増加しており、土壌汚染などの環境問題に対処するため、電子機器廃棄物のリサイクルが求められています。これらの要因は、分析期間中に市場の拡大を促進すると予測されます。業界の大手企業は、電子廃棄物のリサイクルに関する消費者の意識を高めるための戦略に常に注力しています。倫理的に電子機器のリサイクルと再利用を奨励するため、例えばSims Recycling Ltdは、2019年10月の国際電子廃棄物 Dayに啓発キャンペーンを開始しました。
家電や電子機器のリサイクルには、金属や有機化合物などさまざまな有害物質が発生する可能性があります。金属や有機物質のインフォーマルなリサイクルを受けた場合、甲状腺機能の変化、肺機能の低下、新生児の予後不良などの健康問題を引き起こす可能性があります。これらの要因は、分析期間中の市場成長を抑制すると予測されます。
Global E-Waste Monitor 2020では、2019年の世界の電子廃棄物生産量は5360万MTであったと推定しています。それにもかかわらず、回収されリサイクルされたと正式に記録された電子廃棄物は930万MTに過ぎません。これは、電子廃棄物の発生が世界的に機会を増やしている一方で、リサイクルへの取り組みが追いついていないことを示しています。報告されていない家庭用・業務用電子廃棄物の大半は、他の廃棄物の流れや金属くずと一緒になっている可能性が高く、利益を得るために回収できる貴重な金属が失われる原因となっています。世界的に利用可能な大量の電子廃棄物を考えると、市場参入者はこの状況を構築のチャンスと考えるかもしれません。
世界の電子廃棄物からの貴金属回収市場は、新型コロナウイルスの発生によってマイナスの影響を受けています。各国政府によるロックダウンや産業施設の閉鎖により、ロックダウン期間中は世界中で電子廃棄物の回収に混乱が生じました。しかし、一部の大手企業は世界展開などの市場手法を駆使し、ロックダウン後の期間にもサービスを提供できるようにしました。
目次
第1章 イントロダクション
第2章 エグゼクティブサマリー
第3章 市場の概要
- 市場の定義と範囲
- 主な調査結果
- 主な投資ポケット
- ポーターのファイブフォース分析
- 主要企業のポジショニング
- 市場力学
- 促進要因
- 抑制要因
- 機会
- COVID-19 影響分析
- バリューチェーン分析
- 価格設定分析
- 規制ガイドライン
- 市場シェア分析
- 主要規制の分析
- 特許情勢
第4章 電子廃棄物からの貴金属回収市場:金属タイプ別
- 概要
- 市場規模および予測
- 金
- 主な市場動向、成長要因、機会
- 市場規模・予測:地域別
- 市場分析:国別
- 銅
- 主な市場動向、成長要因、機会
- 市場規模・予測:地域別
- 市場分析:国別
- 銀
- 主な市場動向、成長要因、機会
- 市場規模・予測:地域別
- 市場分析:国別
- その他
- 主な市場動向、成長要因、機会
- 市場規模・予測:地域別
- 市場分析:国別
第5章 電子廃棄物からの貴金属回収市場:由来別
- 概要
- 市場規模・予測
- 家庭用電化製品
- 主な市場動向、成長要因、機会
- 市場規模・予測:地域別
- 市場分析:国別
- コンシューマーエレクトロニクス
- 主な市場動向、成長要因、機会
- 市場規模・予測:地域別
- 市場分析:国別
- IT・通信機器分野
- 主な市場動向、成長要因、機会
- 市場規模・予測:地域別
- 市場分析:国別
- その他
- 主な市場動向、成長要因、機会
- 市場規模・予測:地域別
- 市場分析:国別
第6章 電子廃棄物からの貴金属回収市場:地域別
- 概要
- 市場規模・予測
- 北米
- 主要動向と機会
- 北米市場規模推移・予測:金属タイプ別
- 北米市場規模・予測:供給元別
- 北米市場規模・予測:国別
- 米国
- カナダ
- メキシコ
- 欧州
- 主な動向と機会
- 欧州市場規模・予測:金属タイプ別
- 欧州市場規模・予測:供給元別
- 欧州市場規模・予測:国別
- ドイツ
- 英国
- フランス
- スペイン
- イタリア
- その他の欧州地域
- アジア太平洋地域
- 主な動向と機会
- アジア太平洋地域の市場規模・予測:金属タイプ別
- アジア太平洋地域の市場規模・予測:供給源別
- アジア太平洋地域の市場規模・予測:国別
- 中国
- 日本
- インド
- オーストラリア
- 韓国
- その他アジア太平洋地域
- LAMEA
- 主な動向と機会
- LAMEAの市場規模・予測:金属タイプ別
- LAMEAの市場規模・予測:供給源別
- LAMEAの市場規模・予測:国別
- ブラジル
- サウジアラビア
- UAE
- 南アフリカ
- LAMEAの残りの地域
第7章 企業情勢
- イントロダクション
- 主要成功戦略
- 主要10社の製品マッピング
- 競合ダッシュボード
- 競合ヒートマップ
- 主な発展
第8章 企業プロファイル
- Johnson Matthey plc
- umicore
- Materion Corporation
- Boliden Group
- Sims Recycling Ltd.
- TANAKA HOLDINGS Co., Ltd.
- metallix refining inc.
- TES
- heraeus holding gmbh
- Enviroleach Technologies Inc.
LIST OF TABLES
- TABLE 1. GLOBAL PRECIOUS METALS E-WASTE RECOVERY MARKET, BY METAL TYPE, 2021-2030,($MILLION)
- TABLE 2. PRECIOUS METALS E-WASTE RECOVERY MARKET REVENUE, FOR GOLD, BY REGION , 2021-2030,($MILLION)
- TABLE 3. PRECIOUS METALS E-WASTE RECOVERY MARKET FOR GOLD BY COUNTRY, 2021-2030,($MILLION)
- TABLE 4. PRECIOUS METALS E-WASTE RECOVERY MARKET REVENUE, FOR COPPER, BY REGION , 2021-2030,($MILLION)
- TABLE 5. PRECIOUS METALS E-WASTE RECOVERY MARKET FOR COPPER BY COUNTRY, 2021-2030,($MILLION)
- TABLE 6. PRECIOUS METALS E-WASTE RECOVERY MARKET REVENUE, FOR SILVER, BY REGION , 2021-2030,($MILLION)
- TABLE 7. PRECIOUS METALS E-WASTE RECOVERY MARKET FOR SILVER BY COUNTRY, 2021-2030,($MILLION)
- TABLE 8. PRECIOUS METALS E-WASTE RECOVERY MARKET REVENUE, FOR OTHERS, BY REGION , 2021-2030,($MILLION)
- TABLE 9. PRECIOUS METALS E-WASTE RECOVERY MARKET FOR OTHERS BY COUNTRY, 2021-2030,($MILLION)
- TABLE 10. GLOBAL PRECIOUS METALS E-WASTE RECOVERY MARKET, BY SOURCE, 2021-2030,($MILLION)
- TABLE 11. PRECIOUS METALS E-WASTE RECOVERY MARKET REVENUE, FOR HOME APPLIANCES, BY REGION , 2021-2030,($MILLION)
- TABLE 12. PRECIOUS METALS E-WASTE RECOVERY MARKET FOR HOME APPLIANCES BY COUNTRY, 2021-2030,($MILLION)
- TABLE 13. PRECIOUS METALS E-WASTE RECOVERY MARKET REVENUE, FOR CONSUMER ELECTRONICS, BY REGION , 2021-2030,($MILLION)
- TABLE 14. PRECIOUS METALS E-WASTE RECOVERY MARKET FOR CONSUMER ELECTRONICS BY COUNTRY, 2021-2030,($MILLION)
- TABLE 15. PRECIOUS METALS E-WASTE RECOVERY MARKET REVENUE, FOR IT AND TELECOMMUNICATION EQUIPMENT, BY REGION , 2021-2030,($MILLION)
- TABLE 16. PRECIOUS METALS E-WASTE RECOVERY MARKET FOR IT AND TELECOMMUNICATION EQUIPMENT BY COUNTRY, 2021-2030,($MILLION)
- TABLE 17. PRECIOUS METALS E-WASTE RECOVERY MARKET REVENUE, FOR OTHERS, BY REGION , 2021-2030,($MILLION)
- TABLE 18. PRECIOUS METALS E-WASTE RECOVERY MARKET FOR OTHERS BY COUNTRY, 2021-2030,($MILLION)
- TABLE 19. PRECIOUS METALS E-WASTE RECOVERY MARKET, BY REGION, 2021-2030,($MILLION)
- TABLE 20. NORTH AMERICA PRECIOUS METALS E-WASTE RECOVERY MARKET, BY METAL TYPE, 2021-2030,($MILLION)
- TABLE 21. NORTH AMERICA PRECIOUS METALS E-WASTE RECOVERY MARKET, BY SOURCE, 2021-2030,($MILLION)
- TABLE 22. NORTH AMERICA PRECIOUS METALS E-WASTE RECOVERY MARKET, BY COUNTRY, 2021-2030,($MILLION)
- TABLE 23. U.S. PRECIOUS METALS E-WASTE RECOVERY MARKET, BY METAL TYPE, 2021-2030,($MILLION)
- TABLE 24. U.S. PRECIOUS METALS E-WASTE RECOVERY MARKET, BY SOURCE, 2021-2030,($MILLION)
- TABLE 25. CANADA PRECIOUS METALS E-WASTE RECOVERY MARKET, BY METAL TYPE, 2021-2030,($MILLION)
- TABLE 26. CANADA PRECIOUS METALS E-WASTE RECOVERY MARKET, BY SOURCE, 2021-2030,($MILLION)
- TABLE 27. MEXICO PRECIOUS METALS E-WASTE RECOVERY MARKET, BY METAL TYPE, 2021-2030,($MILLION)
- TABLE 28. MEXICO PRECIOUS METALS E-WASTE RECOVERY MARKET, BY SOURCE, 2021-2030,($MILLION)
- TABLE 29. EUROPE PRECIOUS METALS E-WASTE RECOVERY MARKET, BY METAL TYPE, 2021-2030,($MILLION)
- TABLE 30. EUROPE PRECIOUS METALS E-WASTE RECOVERY MARKET, BY SOURCE, 2021-2030,($MILLION)
- TABLE 31. EUROPE PRECIOUS METALS E-WASTE RECOVERY MARKET, BY COUNTRY, 2021-2030,($MILLION)
- TABLE 32. GERMANY PRECIOUS METALS E-WASTE RECOVERY MARKET, BY METAL TYPE, 2021-2030,($MILLION)
- TABLE 33. GERMANY PRECIOUS METALS E-WASTE RECOVERY MARKET, BY SOURCE, 2021-2030,($MILLION)
- TABLE 34. U.K. PRECIOUS METALS E-WASTE RECOVERY MARKET, BY METAL TYPE, 2021-2030,($MILLION)
- TABLE 35. U.K. PRECIOUS METALS E-WASTE RECOVERY MARKET, BY SOURCE, 2021-2030,($MILLION)
- TABLE 36. FRANCE PRECIOUS METALS E-WASTE RECOVERY MARKET, BY METAL TYPE, 2021-2030,($MILLION)
- TABLE 37. FRANCE PRECIOUS METALS E-WASTE RECOVERY MARKET, BY SOURCE, 2021-2030,($MILLION)
- TABLE 38. SPAIN PRECIOUS METALS E-WASTE RECOVERY MARKET, BY METAL TYPE, 2021-2030,($MILLION)
- TABLE 39. SPAIN PRECIOUS METALS E-WASTE RECOVERY MARKET, BY SOURCE, 2021-2030,($MILLION)
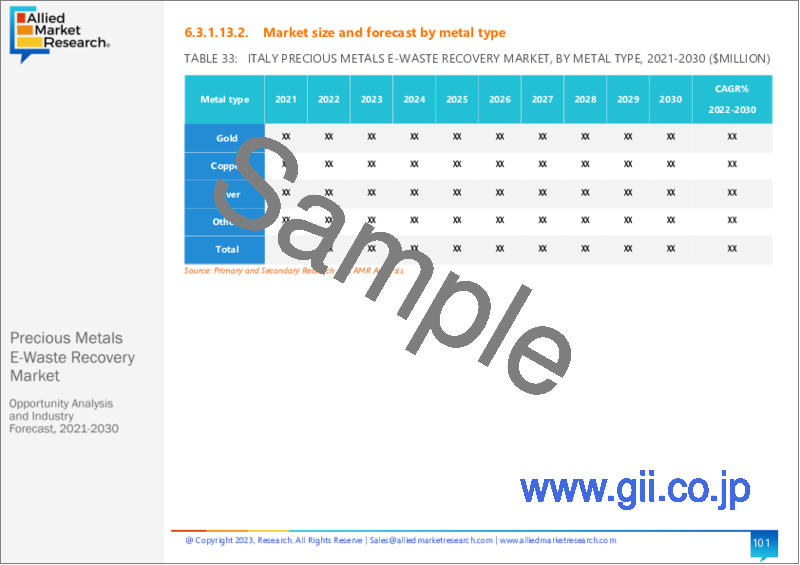
- TABLE 40. ITALY PRECIOUS METALS E-WASTE RECOVERY MARKET, BY METAL TYPE, 2021-2030,($MILLION)
- TABLE 41. ITALY PRECIOUS METALS E-WASTE RECOVERY MARKET, BY SOURCE, 2021-2030,($MILLION)
- TABLE 42. REST OF EUROPE PRECIOUS METALS E-WASTE RECOVERY MARKET, BY METAL TYPE, 2021-2030,($MILLION)
- TABLE 43. REST OF EUROPE PRECIOUS METALS E-WASTE RECOVERY MARKET, BY SOURCE, 2021-2030,($MILLION)
- TABLE 44. ASIA-PACIFIC PRECIOUS METALS E-WASTE RECOVERY MARKET, BY METAL TYPE, 2021-2030,($MILLION)
- TABLE 45. ASIA-PACIFIC PRECIOUS METALS E-WASTE RECOVERY MARKET, BY SOURCE, 2021-2030,($MILLION)
- TABLE 46. ASIA-PACIFIC PRECIOUS METALS E-WASTE RECOVERY MARKET, BY COUNTRY, 2021-2030,($MILLION)
- TABLE 47. CHINA PRECIOUS METALS E-WASTE RECOVERY MARKET, BY METAL TYPE, 2021-2030,($MILLION)
- TABLE 48. CHINA PRECIOUS METALS E-WASTE RECOVERY MARKET, BY SOURCE, 2021-2030,($MILLION)
- TABLE 49. JAPAN PRECIOUS METALS E-WASTE RECOVERY MARKET, BY METAL TYPE, 2021-2030,($MILLION)
- TABLE 50. JAPAN PRECIOUS METALS E-WASTE RECOVERY MARKET, BY SOURCE, 2021-2030,($MILLION)
- TABLE 51. INDIA PRECIOUS METALS E-WASTE RECOVERY MARKET, BY METAL TYPE, 2021-2030,($MILLION)
- TABLE 52. INDIA PRECIOUS METALS E-WASTE RECOVERY MARKET, BY SOURCE, 2021-2030,($MILLION)
- TABLE 53. AUSTRALIA PRECIOUS METALS E-WASTE RECOVERY MARKET, BY METAL TYPE, 2021-2030,($MILLION)
- TABLE 54. AUSTRALIA PRECIOUS METALS E-WASTE RECOVERY MARKET, BY SOURCE, 2021-2030,($MILLION)
- TABLE 55. SOUTH KOREA PRECIOUS METALS E-WASTE RECOVERY MARKET, BY METAL TYPE, 2021-2030,($MILLION)
- TABLE 56. SOUTH KOREA PRECIOUS METALS E-WASTE RECOVERY MARKET, BY SOURCE, 2021-2030,($MILLION)
- TABLE 57. REST OF ASIA-PACIFIC PRECIOUS METALS E-WASTE RECOVERY MARKET, BY METAL TYPE, 2021-2030,($MILLION)
- TABLE 58. REST OF ASIA-PACIFIC PRECIOUS METALS E-WASTE RECOVERY MARKET, BY SOURCE, 2021-2030,($MILLION)
- TABLE 59. LAMEA PRECIOUS METALS E-WASTE RECOVERY MARKET, BY METAL TYPE, 2021-2030,($MILLION)
- TABLE 60. LAMEA PRECIOUS METALS E-WASTE RECOVERY MARKET, BY SOURCE, 2021-2030,($MILLION)
- TABLE 61. LAMEA PRECIOUS METALS E-WASTE RECOVERY MARKET, BY COUNTRY, 2021-2030,($MILLION)
- TABLE 62. BRAZIL PRECIOUS METALS E-WASTE RECOVERY MARKET, BY METAL TYPE, 2021-2030,($MILLION)
- TABLE 63. BRAZIL PRECIOUS METALS E-WASTE RECOVERY MARKET, BY SOURCE, 2021-2030,($MILLION)
- TABLE 64. SAUDI ARABIA PRECIOUS METALS E-WASTE RECOVERY MARKET, BY METAL TYPE, 2021-2030,($MILLION)
- TABLE 65. SAUDI ARABIA PRECIOUS METALS E-WASTE RECOVERY MARKET, BY SOURCE, 2021-2030,($MILLION)
- TABLE 66. UAE PRECIOUS METALS E-WASTE RECOVERY MARKET, BY METAL TYPE, 2021-2030,($MILLION)
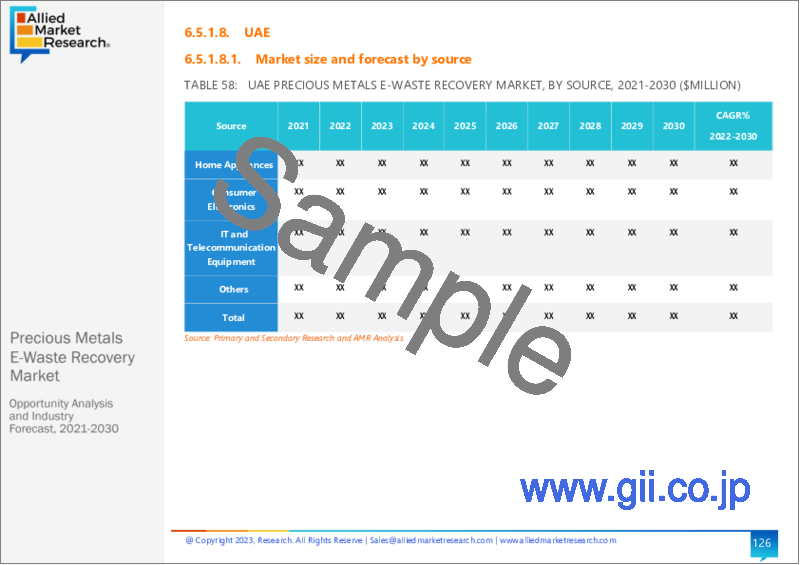
- TABLE 67. UAE PRECIOUS METALS E-WASTE RECOVERY MARKET, BY SOURCE, 2021-2030,($MILLION)
- TABLE 68. SOUTH AFRICA PRECIOUS METALS E-WASTE RECOVERY MARKET, BY METAL TYPE, 2021-2030,($MILLION)
- TABLE 69. SOUTH AFRICA PRECIOUS METALS E-WASTE RECOVERY MARKET, BY SOURCE, 2021-2030,($MILLION)
- TABLE 70. REST OF LAMEA PRECIOUS METALS E-WASTE RECOVERY MARKET, BY METAL TYPE, 2021-2030,($MILLION)
- TABLE 71. REST OF LAMEA PRECIOUS METALS E-WASTE RECOVERY MARKET, BY SOURCE, 2021-2030,($MILLION)
- TABLE 72.JOHNSON MATTHEY PLC: COMPANY SNAPSHOT
- TABLE 73.JOHNSON MATTHEY PLC: OPERATING SEGMENTS
- TABLE 74.JOHNSON MATTHEY PLC: PRODUCT PORTFOLIO
- TABLE 75.JOHNSON MATTHEY PLC: NET SALES,
- TABLE 76.JOHNSON MATTHEY PLC: KEY STRATERGIES
- TABLE 77.UMICORE: COMPANY SNAPSHOT
- TABLE 78.UMICORE: OPERATING SEGMENTS
- TABLE 79.UMICORE: PRODUCT PORTFOLIO
- TABLE 80.UMICORE: NET SALES,
- TABLE 81.UMICORE: KEY STRATERGIES
- TABLE 82.MATERION CORPORATION: COMPANY SNAPSHOT
- TABLE 83.MATERION CORPORATION: OPERATING SEGMENTS
- TABLE 84.MATERION CORPORATION: PRODUCT PORTFOLIO
- TABLE 85.MATERION CORPORATION: NET SALES,
- TABLE 86.MATERION CORPORATION: KEY STRATERGIES
- TABLE 87.BOLIDEN GROUP: COMPANY SNAPSHOT
- TABLE 88.BOLIDEN GROUP: OPERATING SEGMENTS
- TABLE 89.BOLIDEN GROUP: PRODUCT PORTFOLIO
- TABLE 90.BOLIDEN GROUP: NET SALES,
- TABLE 91.BOLIDEN GROUP: KEY STRATERGIES
- TABLE 92.SIMS RECYCLING LTD.: COMPANY SNAPSHOT
- TABLE 93.SIMS RECYCLING LTD.: OPERATING SEGMENTS
- TABLE 94.SIMS RECYCLING LTD.: PRODUCT PORTFOLIO
- TABLE 95.SIMS RECYCLING LTD.: NET SALES,
- TABLE 96.SIMS RECYCLING LTD.: KEY STRATERGIES
- TABLE 97.TANAKA HOLDINGS CO., LTD.: COMPANY SNAPSHOT
- TABLE 98.TANAKA HOLDINGS CO., LTD.: OPERATING SEGMENTS
- TABLE 99.TANAKA HOLDINGS CO., LTD.: PRODUCT PORTFOLIO
- TABLE 100.TANAKA HOLDINGS CO., LTD.: NET SALES,
- TABLE 101.TANAKA HOLDINGS CO., LTD.: KEY STRATERGIES
- TABLE 102.METALLIX REFINING INC.: COMPANY SNAPSHOT
- TABLE 103.METALLIX REFINING INC.: OPERATING SEGMENTS
- TABLE 104.METALLIX REFINING INC.: PRODUCT PORTFOLIO
- TABLE 105.METALLIX REFINING INC.: NET SALES,
- TABLE 106.METALLIX REFINING INC.: KEY STRATERGIES
- TABLE 107.TES: COMPANY SNAPSHOT
- TABLE 108.TES: OPERATING SEGMENTS
- TABLE 109.TES: PRODUCT PORTFOLIO
- TABLE 110.TES: NET SALES,
- TABLE 111.TES: KEY STRATERGIES
- TABLE 112.HERAEUS HOLDING GMBH: COMPANY SNAPSHOT
- TABLE 113.HERAEUS HOLDING GMBH: OPERATING SEGMENTS
- TABLE 114.HERAEUS HOLDING GMBH: PRODUCT PORTFOLIO
- TABLE 115.HERAEUS HOLDING GMBH: NET SALES,
- TABLE 116.HERAEUS HOLDING GMBH: KEY STRATERGIES
- TABLE 117.ENVIROLEACH TECHNOLOGIES INC.: COMPANY SNAPSHOT
- TABLE 118.ENVIROLEACH TECHNOLOGIES INC.: OPERATING SEGMENTS
- TABLE 119.ENVIROLEACH TECHNOLOGIES INC.: PRODUCT PORTFOLIO
- TABLE 120.ENVIROLEACH TECHNOLOGIES INC.: NET SALES,
- TABLE 121.ENVIROLEACH TECHNOLOGIES INC.: KEY STRATERGIES
LIST OF FIGURES
- FIGURE 1.PRECIOUS METALS E-WASTE RECOVERY MARKET SEGMENTATION
- FIGURE 2.PRECIOUS METALS E-WASTE RECOVERY MARKET,2021-2030
- FIGURE 3.PRECIOUS METALS E-WASTE RECOVERY MARKET,2021-2030
- FIGURE 4. TOP INVESTMENT POCKETS, BY REGION
- FIGURE 5.PORTER FIVE-1
- FIGURE 6.PORTER FIVE-2
- FIGURE 7.PORTER FIVE-3
- FIGURE 8.PORTER FIVE-4
- FIGURE 9.PORTER FIVE-5
- FIGURE 10.TOP PLAYER POSITIONING
- FIGURE 11.PRECIOUS METALS E-WASTE RECOVERY MARKET:DRIVERS, RESTRAINTS AND OPPORTUNITIES
- FIGURE 12.VALUE CHAIN ANALYSIS
- FIGURE 13.PRICING ANALYSIS
- FIGURE 14.REGULATORY GUIDELINES
- FIGURE 15.MARKET SHARE ANALYSIS
- FIGURE 16.KEY REGULATION ANALYSIS
- FIGURE 17.PATENT ANALYSIS BY COMPANY
- FIGURE 18.PATENT ANALYSIS BY COUNTRY
- FIGURE 19.PRECIOUS METALS E-WASTE RECOVERY MARKET,BY METAL TYPE,2021(%)
- FIGURE 20.COMPARATIVE SHARE ANALYSIS OF GOLD PRECIOUS METALS E-WASTE RECOVERY MARKET,2021-2030(%)
- FIGURE 21.COMPARATIVE SHARE ANALYSIS OF COPPER PRECIOUS METALS E-WASTE RECOVERY MARKET,2021-2030(%)
- FIGURE 22.COMPARATIVE SHARE ANALYSIS OF SILVER PRECIOUS METALS E-WASTE RECOVERY MARKET,2021-2030(%)
- FIGURE 23.COMPARATIVE SHARE ANALYSIS OF OTHERS PRECIOUS METALS E-WASTE RECOVERY MARKET,2021-2030(%)
- FIGURE 24.PRECIOUS METALS E-WASTE RECOVERY MARKET,BY SOURCE,2021(%)
- FIGURE 25.COMPARATIVE SHARE ANALYSIS OF HOME APPLIANCES PRECIOUS METALS E-WASTE RECOVERY MARKET,2021-2030(%)
- FIGURE 26.COMPARATIVE SHARE ANALYSIS OF CONSUMER ELECTRONICS PRECIOUS METALS E-WASTE RECOVERY MARKET,2021-2030(%)
- FIGURE 27.COMPARATIVE SHARE ANALYSIS OF IT AND TELECOMMUNICATION EQUIPMENT PRECIOUS METALS E-WASTE RECOVERY MARKET,2021-2030(%)
- FIGURE 28.COMPARATIVE SHARE ANALYSIS OF OTHERS PRECIOUS METALS E-WASTE RECOVERY MARKET,2021-2030(%)
- FIGURE 29.PRECIOUS METALS E-WASTE RECOVERY MARKET BY REGION,2021
- FIGURE 30.U.S. PRECIOUS METALS E-WASTE RECOVERY MARKET,2021-2030($MILLION)
- FIGURE 31.CANADA PRECIOUS METALS E-WASTE RECOVERY MARKET,2021-2030($MILLION)
- FIGURE 32.MEXICO PRECIOUS METALS E-WASTE RECOVERY MARKET,2021-2030($MILLION)
- FIGURE 33.GERMANY PRECIOUS METALS E-WASTE RECOVERY MARKET,2021-2030($MILLION)
- FIGURE 34.U.K. PRECIOUS METALS E-WASTE RECOVERY MARKET,2021-2030($MILLION)
- FIGURE 35.FRANCE PRECIOUS METALS E-WASTE RECOVERY MARKET,2021-2030($MILLION)
- FIGURE 36.SPAIN PRECIOUS METALS E-WASTE RECOVERY MARKET,2021-2030($MILLION)
- FIGURE 37.ITALY PRECIOUS METALS E-WASTE RECOVERY MARKET,2021-2030($MILLION)
- FIGURE 38.REST OF EUROPE PRECIOUS METALS E-WASTE RECOVERY MARKET,2021-2030($MILLION)
- FIGURE 39.CHINA PRECIOUS METALS E-WASTE RECOVERY MARKET,2021-2030($MILLION)
- FIGURE 40.JAPAN PRECIOUS METALS E-WASTE RECOVERY MARKET,2021-2030($MILLION)
- FIGURE 41.INDIA PRECIOUS METALS E-WASTE RECOVERY MARKET,2021-2030($MILLION)
- FIGURE 42.AUSTRALIA PRECIOUS METALS E-WASTE RECOVERY MARKET,2021-2030($MILLION)
- FIGURE 43.SOUTH KOREA PRECIOUS METALS E-WASTE RECOVERY MARKET,2021-2030($MILLION)
- FIGURE 44.REST OF ASIA-PACIFIC PRECIOUS METALS E-WASTE RECOVERY MARKET,2021-2030($MILLION)
- FIGURE 45.BRAZIL PRECIOUS METALS E-WASTE RECOVERY MARKET,2021-2030($MILLION)
- FIGURE 46.SAUDI ARABIA PRECIOUS METALS E-WASTE RECOVERY MARKET,2021-2030($MILLION)
- FIGURE 47.UAE PRECIOUS METALS E-WASTE RECOVERY MARKET,2021-2030($MILLION)
- FIGURE 48.SOUTH AFRICA PRECIOUS METALS E-WASTE RECOVERY MARKET,2021-2030($MILLION)
- FIGURE 49.REST OF LAMEA PRECIOUS METALS E-WASTE RECOVERY MARKET,2021-2030($MILLION)
- FIGURE 50. TOP WINNING STRATEGIES, BY YEAR
- FIGURE 51. TOP WINNING STRATEGIES, BY DEVELOPMENT
- FIGURE 52. TOP WINNING STRATEGIES, BY COMPANY
- FIGURE 53.PRODUCT MAPPING OF TOP 10 PLAYERS
- FIGURE 54.COMPETITIVE DASHBOARD
- FIGURE 55.COMPETITIVE HEATMAP OF TOP 10 KEY PLAYERS
- FIGURE 56.JOHNSON MATTHEY PLC.: NET SALES ,($MILLION)
- FIGURE 57.UMICORE.: NET SALES ,($MILLION)
- FIGURE 58.MATERION CORPORATION.: NET SALES ,($MILLION)
- FIGURE 59.BOLIDEN GROUP.: NET SALES ,($MILLION)
- FIGURE 60.SIMS RECYCLING LTD..: NET SALES ,($MILLION)
- FIGURE 61.TANAKA HOLDINGS CO., LTD..: NET SALES ,($MILLION)
- FIGURE 62.METALLIX REFINING INC..: NET SALES ,($MILLION)
- FIGURE 63.TES.: NET SALES ,($MILLION)
- FIGURE 64.HERAEUS HOLDING GMBH.: NET SALES ,($MILLION)
- FIGURE 65.ENVIROLEACH TECHNOLOGIES INC..: NET SALES ,($MILLION)
The global precious metals e-waste recovery market is envisioned to garner $18,645.2 million by 2030, growing from $9,434.5 million in 2021 at a CAGR of 7.0% from 2022 to 2030.
Precious metals are necessary in current digital world as they are utilized in a variety of items, including semiconductors, LEDs, OLEDs, photovoltaic systems, magnetic data storage, passive components, LEDs and OLEDs, and semiconductors. Precious metal is essential to numerous industrial processes in addition to their significant roles in finished goods, such as in the chemical and petrochemical industries as catalysts.
A significant contributor to the anticipated growth of the market is the vast expansion of the IT and communication sectors. The development is mostly attributed to rising electronic consumption, which is encouraging the up gradation to more advanced electronics and having an impact on the disposal of out-of-date electronics. Due to this, there is a rise in the creation of electronic garbage around the world and a need for recycling electronic waste to address environmental problems including soil pollution. These factors are projected to fuel the market expansion during the course of the analysis. Leading industry players are constantly focusing on strategies to increase consumer awareness regarding e-waste recycling. To encourage people to recycle and reuse electronics ethically, Sims Recycling Ltd, for instance, launched awareness campaigns on International E-waste Day in October 2019.
Recycling of consumer electronics and home appliances has the potential to release various harmful substances, including metals and organic compounds. It can result in health problems such thyroid function alterations, reduced lung function, and poor neonatal outcomes if a person is subjected to informal recycling of metals and organic substances. These factors are predicted to constrain the market growth over the analysis period.
The Global E-waste Monitor 2020 estimates that the global e-waste production for 2019 was at 53.6 million MT. Only 9.3 million MT of e-waste was formally documented as having been collected and recycled, nevertheless. This demonstrates that e-waste generation is increasing opportunity globally while recycling efforts are not keeping up. The majority of the unreported household and business e-waste is likely combined with other waste streams or metal debris, causing the loss of valuable metals that can be recovered for profit. Given the massive volume of e-waste available globally, market entrants may see this situation as a chance to build.
The global precious metals e-waste recovery market has been negatively impacted by the new coronavirus outbreak. Due to lockdowns imposed by the governments of various countries and the closure of industrial facilities, there was a disruption in the collection and recovery of e-waste throughout the world during the lockdown. However, some of the major players used market techniques, such as global expansion, to make their services available to clients in the period after the lockdown.
The key players profiled in this report include: Johnson Matthey, umicore, Materion Corporation, Boliden Group, Sims Lifecycle Services, Inc., TANAKA Holdings Co., Ltd., Metallix, TES, Heraeus Holding, and Enviroleach Technologies Inc.
Key Benefits For Stakeholders
- This report provides a quantitative analysis of the market segments, current trends, estimations, and dynamics of the precious metals e-waste recovery market analysis from 2021 to 2030 to identify the prevailing precious metals e-waste recovery market opportunities.
- The market research is offered along with information related to key drivers, restraints, and opportunities.
- Porter's five forces analysis highlights the potency of buyers and suppliers to enable stakeholders make profit-oriented business decisions and strengthen their supplier-buyer network.
- In-depth analysis of the precious metals e-waste recovery market segmentation assists to determine the prevailing market opportunities.
- Major countries in each region are mapped according to their revenue contribution to the global market.
- Market player positioning facilitates benchmarking and provides a clear understanding of the present position of the market players.
- The report includes the analysis of the regional as well as global precious metals e-waste recovery market trends, key players, market segments, application areas, and market growth strategies.
Key Market Segments
By Source
- Home Appliances
- Consumer Electronics
- IT and Telecommunication Equipment
- Others
By Metal Type
- Gold
- Copper
- Silver
- Others
By Region
- North America
- U.S.
- Canada
- Mexico
- Europe
- Germany
- U.K.
- France
- Spain
- Italy
- Rest of Europe
- Asia-Pacific
- China
- Japan
- India
- Australia
- South Korea
- Rest of Asia-Pacific
- LAMEA
- Brazil
- Saudi Arabia
- UAE
- South Africa
- Rest of LAMEA
- Key Market Players
- Johnson Matthey plc
- umicore
- Materion Corporation
- Boliden Group
- Sims Recycling Ltd.
- TANAKA HOLDINGS Co., Ltd.
- metallix refining inc.
- TES
- heraeus holding gmbh
- Enviroleach Technologies Inc.
TABLE OF CONTENTS
CHAPTER 1:INTRODUCTION
- 1.1.Report description
- 1.2.Key market segments
- 1.3.Key benefits to the stakeholders
- 1.4.Research Methodology
- 1.4.1.Secondary research
- 1.4.2.Primary research
- 1.4.3.Analyst tools and models
CHAPTER 2:EXECUTIVE SUMMARY
- 2.1.Key findings of the study
- 2.2.CXO Perspective
CHAPTER 3:MARKET OVERVIEW
- 3.1.Market definition and scope
- 3.2.Key findings
- 3.2.1.Top investment pockets
- 3.3.Porter's five forces analysis
- 3.4.Top player positioning
- 3.5.Market dynamics
- 3.5.1.Drivers
- 3.5.2.Restraints
- 3.5.3.Opportunities
- 3.6.COVID-19 Impact Analysis on the market
- 3.7.Value Chain Analysis
- 3.8.Pricing Analysis
- 3.9.Regulatory Guidelines
- 3.10.Market Share Analysis
- 3.11.Key Regulation Analysis
- 3.12.Patent Landscape
CHAPTER 4: PRECIOUS METALS E-WASTE RECOVERY MARKET, BY METAL TYPE
- 4.1 Overview
- 4.1.1 Market size and forecast
- 4.2 Gold
- 4.2.1 Key market trends, growth factors and opportunities
- 4.2.2 Market size and forecast, by region
- 4.2.3 Market analysis by country
- 4.3 Copper
- 4.3.1 Key market trends, growth factors and opportunities
- 4.3.2 Market size and forecast, by region
- 4.3.3 Market analysis by country
- 4.4 Silver
- 4.4.1 Key market trends, growth factors and opportunities
- 4.4.2 Market size and forecast, by region
- 4.4.3 Market analysis by country
- 4.5 Others
- 4.5.1 Key market trends, growth factors and opportunities
- 4.5.2 Market size and forecast, by region
- 4.5.3 Market analysis by country
CHAPTER 5: PRECIOUS METALS E-WASTE RECOVERY MARKET, BY SOURCE
- 5.1 Overview
- 5.1.1 Market size and forecast
- 5.2 Home Appliances
- 5.2.1 Key market trends, growth factors and opportunities
- 5.2.2 Market size and forecast, by region
- 5.2.3 Market analysis by country
- 5.3 Consumer Electronics
- 5.3.1 Key market trends, growth factors and opportunities
- 5.3.2 Market size and forecast, by region
- 5.3.3 Market analysis by country
- 5.4 IT and Telecommunication Equipment
- 5.4.1 Key market trends, growth factors and opportunities
- 5.4.2 Market size and forecast, by region
- 5.4.3 Market analysis by country
- 5.5 Others
- 5.5.1 Key market trends, growth factors and opportunities
- 5.5.2 Market size and forecast, by region
- 5.5.3 Market analysis by country
CHAPTER 6: PRECIOUS METALS E-WASTE RECOVERY MARKET, BY REGION
- 6.1 Overview
- 6.1.1 Market size and forecast
- 6.2 North America
- 6.2.1 Key trends and opportunities
- 6.2.2 North America Market size and forecast, by Metal Type
- 6.2.3 North America Market size and forecast, by Source
- 6.2.4 North America Market size and forecast, by country
- 6.2.4.1 U.S.
- 6.2.4.1.1 Market size and forecast, by Metal Type
- 6.2.4.1.2 Market size and forecast, by Source
- 6.2.4.2 Canada
- 6.2.4.2.1 Market size and forecast, by Metal Type
- 6.2.4.2.2 Market size and forecast, by Source
- 6.2.4.3 Mexico
- 6.2.4.3.1 Market size and forecast, by Metal Type
- 6.2.4.3.2 Market size and forecast, by Source
- 6.3 Europe
- 6.3.1 Key trends and opportunities
- 6.3.2 Europe Market size and forecast, by Metal Type
- 6.3.3 Europe Market size and forecast, by Source
- 6.3.4 Europe Market size and forecast, by country
- 6.3.4.1 Germany
- 6.3.4.1.1 Market size and forecast, by Metal Type
- 6.3.4.1.2 Market size and forecast, by Source
- 6.3.4.2 U.K.
- 6.3.4.2.1 Market size and forecast, by Metal Type
- 6.3.4.2.2 Market size and forecast, by Source
- 6.3.4.3 France
- 6.3.4.3.1 Market size and forecast, by Metal Type
- 6.3.4.3.2 Market size and forecast, by Source
- 6.3.4.4 Spain
- 6.3.4.4.1 Market size and forecast, by Metal Type
- 6.3.4.4.2 Market size and forecast, by Source
- 6.3.4.5 Italy
- 6.3.4.5.1 Market size and forecast, by Metal Type
- 6.3.4.5.2 Market size and forecast, by Source
- 6.3.4.6 Rest of Europe
- 6.3.4.6.1 Market size and forecast, by Metal Type
- 6.3.4.6.2 Market size and forecast, by Source
- 6.4 Asia-Pacific
- 6.4.1 Key trends and opportunities
- 6.4.2 Asia-Pacific Market size and forecast, by Metal Type
- 6.4.3 Asia-Pacific Market size and forecast, by Source
- 6.4.4 Asia-Pacific Market size and forecast, by country
- 6.4.4.1 China
- 6.4.4.1.1 Market size and forecast, by Metal Type
- 6.4.4.1.2 Market size and forecast, by Source
- 6.4.4.2 Japan
- 6.4.4.2.1 Market size and forecast, by Metal Type
- 6.4.4.2.2 Market size and forecast, by Source
- 6.4.4.3 India
- 6.4.4.3.1 Market size and forecast, by Metal Type
- 6.4.4.3.2 Market size and forecast, by Source
- 6.4.4.4 Australia
- 6.4.4.4.1 Market size and forecast, by Metal Type
- 6.4.4.4.2 Market size and forecast, by Source
- 6.4.4.5 South Korea
- 6.4.4.5.1 Market size and forecast, by Metal Type
- 6.4.4.5.2 Market size and forecast, by Source
- 6.4.4.6 Rest of Asia-Pacific
- 6.4.4.6.1 Market size and forecast, by Metal Type
- 6.4.4.6.2 Market size and forecast, by Source
- 6.5 LAMEA
- 6.5.1 Key trends and opportunities
- 6.5.2 LAMEA Market size and forecast, by Metal Type
- 6.5.3 LAMEA Market size and forecast, by Source
- 6.5.4 LAMEA Market size and forecast, by country
- 6.5.4.1 Brazil
- 6.5.4.1.1 Market size and forecast, by Metal Type
- 6.5.4.1.2 Market size and forecast, by Source
- 6.5.4.2 Saudi Arabia
- 6.5.4.2.1 Market size and forecast, by Metal Type
- 6.5.4.2.2 Market size and forecast, by Source
- 6.5.4.3 UAE
- 6.5.4.3.1 Market size and forecast, by Metal Type
- 6.5.4.3.2 Market size and forecast, by Source
- 6.5.4.4 South Africa
- 6.5.4.4.1 Market size and forecast, by Metal Type
- 6.5.4.4.2 Market size and forecast, by Source
- 6.5.4.5 Rest of LAMEA
- 6.5.4.5.1 Market size and forecast, by Metal Type
- 6.5.4.5.2 Market size and forecast, by Source
CHAPTER 7: COMPANY LANDSCAPE
- 7.1. Introduction
- 7.2. Top winning strategies
- 7.3. Product Mapping of Top 10 Player
- 7.4. Competitive Dashboard
- 7.5. Competitive Heatmap
- 7.6. Key developments
CHAPTER 8: COMPANY PROFILES
- 8.1 Johnson Matthey plc
- 8.1.1 Company overview
- 8.1.2 Company snapshot
- 8.1.3 Operating business segments
- 8.1.4 Product portfolio
- 8.1.5 Business performance
- 8.1.6 Key strategic moves and developments
- 8.2 umicore
- 8.2.1 Company overview
- 8.2.2 Company snapshot
- 8.2.3 Operating business segments
- 8.2.4 Product portfolio
- 8.2.5 Business performance
- 8.2.6 Key strategic moves and developments
- 8.3 Materion Corporation
- 8.3.1 Company overview
- 8.3.2 Company snapshot
- 8.3.3 Operating business segments
- 8.3.4 Product portfolio
- 8.3.5 Business performance
- 8.3.6 Key strategic moves and developments
- 8.4 Boliden Group
- 8.4.1 Company overview
- 8.4.2 Company snapshot
- 8.4.3 Operating business segments
- 8.4.4 Product portfolio
- 8.4.5 Business performance
- 8.4.6 Key strategic moves and developments
- 8.5 Sims Recycling Ltd.
- 8.5.1 Company overview
- 8.5.2 Company snapshot
- 8.5.3 Operating business segments
- 8.5.4 Product portfolio
- 8.5.5 Business performance
- 8.5.6 Key strategic moves and developments
- 8.6 TANAKA HOLDINGS Co., Ltd.
- 8.6.1 Company overview
- 8.6.2 Company snapshot
- 8.6.3 Operating business segments
- 8.6.4 Product portfolio
- 8.6.5 Business performance
- 8.6.6 Key strategic moves and developments
- 8.7 metallix refining inc.
- 8.7.1 Company overview
- 8.7.2 Company snapshot
- 8.7.3 Operating business segments
- 8.7.4 Product portfolio
- 8.7.5 Business performance
- 8.7.6 Key strategic moves and developments
- 8.8 TES
- 8.8.1 Company overview
- 8.8.2 Company snapshot
- 8.8.3 Operating business segments
- 8.8.4 Product portfolio
- 8.8.5 Business performance
- 8.8.6 Key strategic moves and developments
- 8.9 heraeus holding gmbh
- 8.9.1 Company overview
- 8.9.2 Company snapshot
- 8.9.3 Operating business segments
- 8.9.4 Product portfolio
- 8.9.5 Business performance
- 8.9.6 Key strategic moves and developments
- 8.10 Enviroleach Technologies Inc.
- 8.10.1 Company overview
- 8.10.2 Company snapshot
- 8.10.3 Operating business segments
- 8.10.4 Product portfolio
- 8.10.5 Business performance
- 8.10.6 Key strategic moves and developments