|
|
市場調査レポート
商品コード
1140218
アクティブ断熱材市場:素材別(ポリエステル、綿、羊毛、ナイロン、グラスウール、発泡ポリスチレン)、用途別(繊維、建築、建設):世界の機会分析および産業予測、2021-2031年Active Insulation Market By Material (Polyester, Cotton, Wool, Nylon, Glass Wool, Expanded Polystyrene), By Application (Textile, Building and Construction): Global Opportunity Analysis and Industry Forecast, 2021-2031 |
||||||
|
|
|||||||


| アクティブ断熱材市場:素材別(ポリエステル、綿、羊毛、ナイロン、グラスウール、発泡ポリスチレン)、用途別(繊維、建築、建設):世界の機会分析および産業予測、2021-2031年 |
|
出版日: 2022年07月01日
発行: Allied Market Research
ページ情報: 英文 230 Pages
納期: 2~3営業日
|
- 全表示
- 概要
- 図表
- 目次
アクティブ断熱材の世界市場予測は、2021年に2億8850万米ドルで、2022年から2031年にかけてCAGR5.9%で成長し、2031年には5億1280万米ドルに達すると予測されています。
アクティブ断熱材は、寒さから身を守るための理想的な中間層として使用される保温材、または衣料層の一種です。アクティブ断熱材は、水分/汗の交換を可能にすることで、暖かい環境条件を作り出すことができます。
世界のアクティブ断熱材の市場の成長は、登山家やトレッキングハイカーによってアクティブ断熱ジャケットやパンツの使用の増加によって駆動されます。これらのジャケットとパンツは広く、これらは長い氷河登山の間に外側の層の熱保護布として使用されている間に登山の間に理想的な中間層の熱保護ファブリックとして登山家によって選ばれています。また、アクティブ断熱生地や織物は、通常の戦闘軍服と一緒に高度な断熱材として米国の特殊部隊(陸軍部隊の種類)によって使用されています。
これらの活動的な保温軍服は、陸軍兵士が動的・静的な活動を行う際に体温を調節することができるのです。さらに、アクティブ断熱ジャケットは、外部に熱保護層を追加する必要性を排除します。彼らは移動中に外部の熱層の着用の間に困難を見つけるようにこれは、アクティブ断熱ジャケットが広く軍兵に好かれるようになります。したがって、一緒にすべてのこれらの要因は、アクティブな絶縁世界市場の需要を増大させることが予測されます。
しかし、内部の断熱システムで活性断熱製品の使用に関連するリスクは、市場の成長を妨げる可能性があります。例えば、毛細管式アクティブ断熱システム(アクティブ断熱材の一種)は、ビル&建設業界における断熱材として広く好まれています。このアクティブ断熱システムは、主に文化遺産である建物の断熱に使用されています。しかし、アクティブ断熱材に関連する間質性結露のリスクが、市場成長の妨げになると予想されます。
その他の活動として、アクティブ断熱材市場は、アクティブ断熱材を施した登山用ジャケットやその他のギアへの幅広い嗜好性により、急速に拡大しています。世界市場の主要なプレーヤーは、革新的なアクティブ絶縁製品を起動しているアクティブ絶縁の成長のための巨大な成長の機会を作成すると予想されます。例えば、Rabアルファフラッシュジャケットは、通気性と最小限の重量を提供することができる活性絶縁の一種であり、それは山のトレッカーによって理想的な中間層の熱活性絶縁材料になります。
目次
第1章 イントロダクション
第2章 エグゼクティブサマリー
第3章 市場の概要
- 市場の定義と範囲
- 主な調査結果
- 主な投資ポケット
- ポーターのファイブフォース分析
- 主要企業のポジショニング
- 市場力学
- 促進要因
- 抑制要因
- 機会
- COVID-19 影響分析
- 価格設定分析
- バリューチェーン分析
- 主要な規制の分析
- 特許情勢
- 規制ガイドライン
第4章 アクティブ断熱材市場:素材別
- 概要
- 市場規模・予測
- ポリエステル
- 主な市場動向、成長要因、機会
- 市場規模・予測:地域別
- 市場分析:国別
- 綿(コットン
- 主な市場動向、成長要因、機会
- 市場規模・予測:地域別
- 市場分析:国別
- ウール
- 主な市場動向、成長要因、機会
- 市場規模・予測:地域別
- 市場分析:国別
- ナイロン
- 主な市場動向、成長要因、機会
- 市場規模・予測:地域別
- 市場分析:国別
- グラスウール
- 主な市場動向、成長要因、機会
- 市場規模・予測:地域別
- 市場分析:国別
- 発泡スチロール
- 主な市場動向、成長要因、機会
- 市場規模・予測:地域別
- 市場分析:国別
第5章 アクティブ断熱材市場:用途別
- 概要
- 市場規模・予測
- テキスタイル
- 主な市場動向、成長要因と機会
- 市場規模・予測:地域別
- 市場分析:国別
- 建築・建設
- 主な市場動向、成長要因、機会
- 市場規模・予測:地域別
- 市場分析:国別
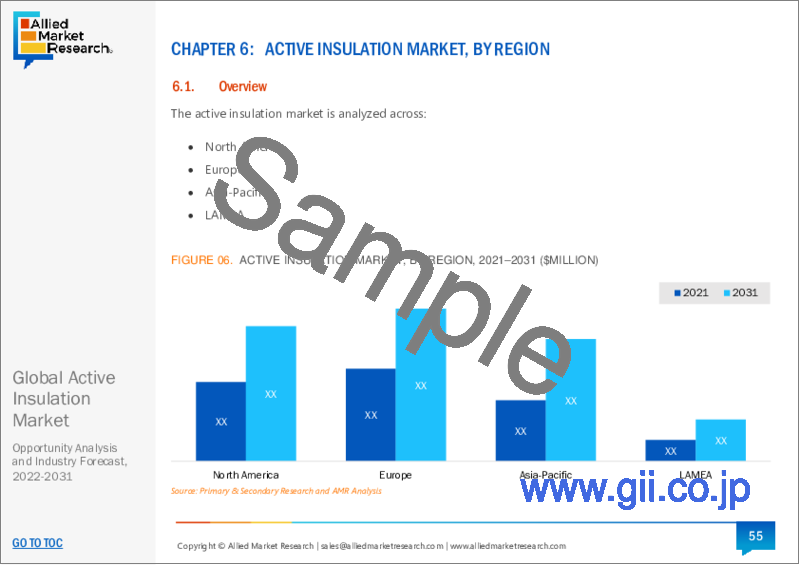
第6章 アクティブ断熱材市場:地域別
- 概要
- 市場規模・予測
- 北米
- 主な動向と機会
- 北米市場規模・予測:素材別
- 北米市場規模・予測:アプリケーション別
- 北米市場規模・予測:国別
- 米国
- カナダ
- メキシコ
- 欧州
- 主な動向と機会
- 欧州の市場規模・予測:素材別
- 欧州の市場規模・予測:アプリケーション別
- 欧州市場規模・予測:国別
- ドイツ
- 英国
- フランス
- スペイン
- イタリア
- その他の欧州地域
- アジア太平洋地域
- 主な動向と機会
- アジア太平洋地域の市場規模・予測:素材別
- アジア太平洋地域の市場規模・予測:アプリケーション別
- アジア太平洋地域の市場規模・予測:国別
- 中国
- インド
- 日本
- 韓国
- オーストラリア
- その他アジア太平洋地域
- LAMEA
- 主な動向と機会
- LAMEAの市場規模・予測:素材別
- LAMEAの市場規模・予測:アプリケーション別
- LAMEAの市場規模・予測:国別
- ブラジル
- サウジアラビア
- 南アフリカ共和国
- LAMEAの残りの地域
第7章 企業情勢
- イントロダクション
- 主要成功戦略
- 主要10社の製品マッピング
- 競合ダッシュボード
- 競合ヒートマップ
- 主な発展
第8章 企業プロファイル
- BASF SE
- Hdwool Ltd
- Invista Textiles
- The 3M Company
- Polartec, LLC
- Polybond Insulation Private Limited
- Remmers
- Stoney Creek Limited
- Toray Industries, Inc.
- W.L. Gore and Associates
LIST OF TABLES
- TABLE 1. GLOBAL ACTIVE INSULATION MARKET, BY MATERIAL, 2021-2031 ($MILLION)
- TABLE 2. GLOBAL ACTIVE INSULATION MARKET, BY MATERIAL, 2021-2031 (TONS)
- TABLE 3. ACTIVE INSULATION MARKET SIZE, FOR POLYESTER, BY REGION, 2021-2031 ($MILLION)
- TABLE 4. ACTIVE INSULATION MARKET SIZE, FOR POLYESTER, BY REGION, 2021-2031 (TONS)
- TABLE 5. ACTIVE INSULATION MARKET FOR POLYESTER, BY COUNTRY, 2021-2031 ($MILLION)
- TABLE 6. ACTIVE INSULATION MARKET FOR POLYESTER, BY COUNTRY, 2021-2031 (TONS)
- TABLE 7. ACTIVE INSULATION MARKET SIZE, FOR COTTON, BY REGION, 2021-2031 ($MILLION)
- TABLE 8. ACTIVE INSULATION MARKET SIZE, FOR COTTON, BY REGION, 2021-2031 (TONS)
- TABLE 9. ACTIVE INSULATION MARKET FOR COTTON, BY COUNTRY, 2021-2031 ($MILLION)
- TABLE 10. ACTIVE INSULATION MARKET FOR COTTON, BY COUNTRY, 2021-2031 (TONS)
- TABLE 11. ACTIVE INSULATION MARKET SIZE, FOR WOOL, BY REGION, 2021-2031 ($MILLION)
- TABLE 12. ACTIVE INSULATION MARKET SIZE, FOR WOOL, BY REGION, 2021-2031 (TONS)
- TABLE 13. ACTIVE INSULATION MARKET FOR WOOL, BY COUNTRY, 2021-2031 ($MILLION)
- TABLE 14. ACTIVE INSULATION MARKET FOR WOOL, BY COUNTRY, 2021-2031 (TONS)
- TABLE 15. ACTIVE INSULATION MARKET SIZE, FOR NYLON, BY REGION, 2021-2031 ($MILLION)
- TABLE 16. ACTIVE INSULATION MARKET SIZE, FOR NYLON, BY REGION, 2021-2031 (TONS)
- TABLE 17. ACTIVE INSULATION MARKET FOR NYLON, BY COUNTRY, 2021-2031 ($MILLION)
- TABLE 18. ACTIVE INSULATION MARKET FOR NYLON, BY COUNTRY, 2021-2031 (TONS)
- TABLE 19. ACTIVE INSULATION MARKET SIZE, FOR GLASS WOOL, BY REGION, 2021-2031 ($MILLION)
- TABLE 20. ACTIVE INSULATION MARKET SIZE, FOR GLASS WOOL, BY REGION, 2021-2031 (TONS)
- TABLE 21. ACTIVE INSULATION MARKET FOR GLASS WOOL, BY COUNTRY, 2021-2031 ($MILLION)
- TABLE 22. ACTIVE INSULATION MARKET FOR GLASS WOOL, BY COUNTRY, 2021-2031 (TONS)
- TABLE 23. ACTIVE INSULATION MARKET SIZE, FOR EXPANDED POLYSTYRENE, BY REGION, 2021-2031 ($MILLION)
- TABLE 24. ACTIVE INSULATION MARKET SIZE, FOR EXPANDED POLYSTYRENE, BY REGION, 2021-2031 (TONS)
- TABLE 25. ACTIVE INSULATION MARKET FOR EXPANDED POLYSTYRENE, BY COUNTRY, 2021-2031 ($MILLION)
- TABLE 26. ACTIVE INSULATION MARKET FOR EXPANDED POLYSTYRENE, BY COUNTRY, 2021-2031 (TONS)
- TABLE 27. GLOBAL ACTIVE INSULATION MARKET, BY APPLICATION, 2021-2031 ($MILLION)
- TABLE 28. GLOBAL ACTIVE INSULATION MARKET, BY APPLICATION, 2021-2031 (TONS)
- TABLE 29. ACTIVE INSULATION MARKET SIZE, FOR TEXTILE, BY REGION, 2021-2031 ($MILLION)
- TABLE 30. ACTIVE INSULATION MARKET SIZE, FOR TEXTILE, BY REGION, 2021-2031 (TONS)
- TABLE 31. ACTIVE INSULATION MARKET FOR TEXTILE, BY COUNTRY, 2021-2031 ($MILLION)
- TABLE 32. ACTIVE INSULATION MARKET FOR TEXTILE, BY COUNTRY, 2021-2031 (TONS)
- TABLE 33. ACTIVE INSULATION MARKET SIZE, FOR BUILDING AND CONSTRUCTION, BY REGION, 2021-2031 ($MILLION)
- TABLE 34. ACTIVE INSULATION MARKET SIZE, FOR BUILDING AND CONSTRUCTION, BY REGION, 2021-2031 (TONS)
- TABLE 35. ACTIVE INSULATION MARKET FOR BUILDING AND CONSTRUCTION, BY COUNTRY, 2021-2031 ($MILLION)
- TABLE 36. ACTIVE INSULATION MARKET FOR BUILDING AND CONSTRUCTION, BY COUNTRY, 2021-2031 (TONS)
- TABLE 37. ACTIVE INSULATION MARKET, BY REGION, 2021-2031 ($MILLION)
- TABLE 38. ACTIVE INSULATION MARKET, BY REGION, 2021-2031 (TONS)
- TABLE 39. NORTH AMERICA ACTIVE INSULATION MARKET, BY MATERIAL, 2021-2031 ($MILLION)
- TABLE 40. NORTH AMERICA ACTIVE INSULATION MARKET, BY MATERIAL, 2021-2031 (TONS)
- TABLE 41. NORTH AMERICA ACTIVE INSULATION MARKET, BY APPLICATION, 2021-2031 ($MILLION)
- TABLE 42. NORTH AMERICA ACTIVE INSULATION MARKET, BY APPLICATION, 2021-2031 (TONS)
- TABLE 43. NORTH AMERICA ACTIVE INSULATION MARKET, BY COUNTRY, 2021-2031 ($MILLION)
- TABLE 44. NORTH AMERICA ACTIVE INSULATION MARKET, BY COUNTRY, 2021-2031 (TONS)
- TABLE 45. U.S. ACTIVE INSULATION MARKET, BY MATERIAL, 2021-2031 ($MILLION)
- TABLE 46. U.S. ACTIVE INSULATION MARKET, BY MATERIAL, 2021-2031 (TONS)
- TABLE 47. U.S. ACTIVE INSULATION MARKET, BY APPLICATION, 2021-2031 ($MILLION)
- TABLE 48. U.S. ACTIVE INSULATION MARKET, BY APPLICATION, 2021-2031 (TONS)
- TABLE 49. CANADA ACTIVE INSULATION MARKET, BY MATERIAL, 2021-2031 ($MILLION)
- TABLE 50. CANADA ACTIVE INSULATION MARKET, BY MATERIAL, 2021-2031 (TONS)
- TABLE 51. CANADA ACTIVE INSULATION MARKET, BY APPLICATION, 2021-2031 ($MILLION)
- TABLE 52. CANADA ACTIVE INSULATION MARKET, BY APPLICATION, 2021-2031 (TONS)
- TABLE 53. MEXICO ACTIVE INSULATION MARKET, BY MATERIAL, 2021-2031 ($MILLION)
- TABLE 54. MEXICO ACTIVE INSULATION MARKET, BY MATERIAL, 2021-2031 (TONS)
- TABLE 55. MEXICO ACTIVE INSULATION MARKET, BY APPLICATION, 2021-2031 ($MILLION)
- TABLE 56. MEXICO ACTIVE INSULATION MARKET, BY APPLICATION, 2021-2031 (TONS)
- TABLE 57. EUROPE ACTIVE INSULATION MARKET, BY MATERIAL, 2021-2031 ($MILLION)
- TABLE 58. EUROPE ACTIVE INSULATION MARKET, BY MATERIAL, 2021-2031 (TONS)
- TABLE 59. EUROPE ACTIVE INSULATION MARKET, BY APPLICATION, 2021-2031 ($MILLION)
- TABLE 60. EUROPE ACTIVE INSULATION MARKET, BY APPLICATION, 2021-2031 (TONS)
- TABLE 61. EUROPE ACTIVE INSULATION MARKET, BY COUNTRY, 2021-2031 ($MILLION)
- TABLE 62. EUROPE ACTIVE INSULATION MARKET, BY COUNTRY, 2021-2031 (TONS)
- TABLE 63. GERMANY ACTIVE INSULATION MARKET, BY MATERIAL, 2021-2031 ($MILLION)
- TABLE 64. GERMANY ACTIVE INSULATION MARKET, BY MATERIAL, 2021-2031 (TONS)
- TABLE 65. GERMANY ACTIVE INSULATION MARKET, BY APPLICATION, 2021-2031 ($MILLION)
- TABLE 66. GERMANY ACTIVE INSULATION MARKET, BY APPLICATION, 2021-2031 (TONS)
- TABLE 67. U.K. ACTIVE INSULATION MARKET, BY MATERIAL, 2021-2031 ($MILLION)
- TABLE 68. U.K. ACTIVE INSULATION MARKET, BY MATERIAL, 2021-2031 (TONS)
- TABLE 69. U.K. ACTIVE INSULATION MARKET, BY APPLICATION, 2021-2031 ($MILLION)
- TABLE 70. U.K. ACTIVE INSULATION MARKET, BY APPLICATION, 2021-2031 (TONS)
- TABLE 71. FRANCE ACTIVE INSULATION MARKET, BY MATERIAL, 2021-2031 ($MILLION)
- TABLE 72. FRANCE ACTIVE INSULATION MARKET, BY MATERIAL, 2021-2031 (TONS)
- TABLE 73. FRANCE ACTIVE INSULATION MARKET, BY APPLICATION, 2021-2031 ($MILLION)
- TABLE 74. FRANCE ACTIVE INSULATION MARKET, BY APPLICATION, 2021-2031 (TONS)
- TABLE 75. SPAIN ACTIVE INSULATION MARKET, BY MATERIAL, 2021-2031 ($MILLION)
- TABLE 76. SPAIN ACTIVE INSULATION MARKET, BY MATERIAL, 2021-2031 (TONS)
- TABLE 77. SPAIN ACTIVE INSULATION MARKET, BY APPLICATION, 2021-2031 ($MILLION)
- TABLE 78. SPAIN ACTIVE INSULATION MARKET, BY APPLICATION, 2021-2031 (TONS)
- TABLE 79. ITALY ACTIVE INSULATION MARKET, BY MATERIAL, 2021-2031 ($MILLION)
- TABLE 80. ITALY ACTIVE INSULATION MARKET, BY MATERIAL, 2021-2031 (TONS)
- TABLE 81. ITALY ACTIVE INSULATION MARKET, BY APPLICATION, 2021-2031 ($MILLION)
- TABLE 82. ITALY ACTIVE INSULATION MARKET, BY APPLICATION, 2021-2031 (TONS)
- TABLE 83. REST OF EUROPE ACTIVE INSULATION MARKET, BY MATERIAL, 2021-2031 ($MILLION)
- TABLE 84. REST OF EUROPE ACTIVE INSULATION MARKET, BY MATERIAL, 2021-2031 (TONS)
- TABLE 85. REST OF EUROPE ACTIVE INSULATION MARKET, BY APPLICATION, 2021-2031 ($MILLION)
- TABLE 86. REST OF EUROPE ACTIVE INSULATION MARKET, BY APPLICATION, 2021-2031 (TONS)
- TABLE 87. ASIA-PACIFIC ACTIVE INSULATION MARKET, BY MATERIAL, 2021-2031 ($MILLION)
- TABLE 88. ASIA-PACIFIC ACTIVE INSULATION MARKET, BY MATERIAL, 2021-2031 (TONS)
- TABLE 89. ASIA-PACIFIC ACTIVE INSULATION MARKET, BY APPLICATION, 2021-2031 ($MILLION)
- TABLE 90. ASIA-PACIFIC ACTIVE INSULATION MARKET, BY APPLICATION, 2021-2031 (TONS)
- TABLE 91. ASIA-PACIFIC ACTIVE INSULATION MARKET, BY COUNTRY, 2021-2031 ($MILLION)
- TABLE 92. ASIA-PACIFIC ACTIVE INSULATION MARKET, BY COUNTRY, 2021-2031 (TONS)
- TABLE 93. CHINA ACTIVE INSULATION MARKET, BY MATERIAL, 2021-2031 ($MILLION)
- TABLE 94. CHINA ACTIVE INSULATION MARKET, BY MATERIAL, 2021-2031 (TONS)
- TABLE 95. CHINA ACTIVE INSULATION MARKET, BY APPLICATION, 2021-2031 ($MILLION)
- TABLE 96. CHINA ACTIVE INSULATION MARKET, BY APPLICATION, 2021-2031 (TONS)
- TABLE 97. INDIA ACTIVE INSULATION MARKET, BY MATERIAL, 2021-2031 ($MILLION)
- TABLE 98. INDIA ACTIVE INSULATION MARKET, BY MATERIAL, 2021-2031 (TONS)
- TABLE 99. INDIA ACTIVE INSULATION MARKET, BY APPLICATION, 2021-2031 ($MILLION)
- TABLE 100. INDIA ACTIVE INSULATION MARKET, BY APPLICATION, 2021-2031 (TONS)
- TABLE 101. JAPAN ACTIVE INSULATION MARKET, BY MATERIAL, 2021-2031 ($MILLION)
- TABLE 102. JAPAN ACTIVE INSULATION MARKET, BY MATERIAL, 2021-2031 (TONS)
- TABLE 103. JAPAN ACTIVE INSULATION MARKET, BY APPLICATION, 2021-2031 ($MILLION)
- TABLE 104. JAPAN ACTIVE INSULATION MARKET, BY APPLICATION, 2021-2031 (TONS)
- TABLE 105. SOUTH KOREA ACTIVE INSULATION MARKET, BY MATERIAL, 2021-2031 ($MILLION)
- TABLE 106. SOUTH KOREA ACTIVE INSULATION MARKET, BY MATERIAL, 2021-2031 (TONS)
- TABLE 107. SOUTH KOREA ACTIVE INSULATION MARKET, BY APPLICATION, 2021-2031 ($MILLION)
- TABLE 108. SOUTH KOREA ACTIVE INSULATION MARKET, BY APPLICATION, 2021-2031 (TONS)
- TABLE 109. AUSTRALIA ACTIVE INSULATION MARKET, BY MATERIAL, 2021-2031 ($MILLION)
- TABLE 110. AUSTRALIA ACTIVE INSULATION MARKET, BY MATERIAL, 2021-2031 (TONS)
- TABLE 111. AUSTRALIA ACTIVE INSULATION MARKET, BY APPLICATION, 2021-2031 ($MILLION)
- TABLE 112. AUSTRALIA ACTIVE INSULATION MARKET, BY APPLICATION, 2021-2031 (TONS)
- TABLE 113. REST OF ASIA-PACIFIC ACTIVE INSULATION MARKET, BY MATERIAL, 2021-2031 ($MILLION)
- TABLE 114. REST OF ASIA-PACIFIC ACTIVE INSULATION MARKET, BY MATERIAL, 2021-2031 (TONS)
- TABLE 115. REST OF ASIA-PACIFIC ACTIVE INSULATION MARKET, BY APPLICATION, 2021-2031 ($MILLION)
- TABLE 116. REST OF ASIA-PACIFIC ACTIVE INSULATION MARKET, BY APPLICATION, 2021-2031 (TONS)
- TABLE 117. LAMEA ACTIVE INSULATION MARKET, BY MATERIAL, 2021-2031 ($MILLION)
- TABLE 118. LAMEA ACTIVE INSULATION MARKET, BY MATERIAL, 2021-2031 (TONS)
- TABLE 119. LAMEA ACTIVE INSULATION MARKET, BY APPLICATION, 2021-2031 ($MILLION)
- TABLE 120. LAMEA ACTIVE INSULATION MARKET, BY APPLICATION, 2021-2031 (TONS)
- TABLE 121. LAMEA ACTIVE INSULATION MARKET, BY COUNTRY, 2021-2031 ($MILLION)
- TABLE 122. LAMEA ACTIVE INSULATION MARKET, BY COUNTRY, 2021-2031 (TONS)
- TABLE 123. BRAZIL ACTIVE INSULATION MARKET, BY MATERIAL, 2021-2031 ($MILLION)
- TABLE 124. BRAZIL ACTIVE INSULATION MARKET, BY MATERIAL, 2021-2031 (TONS)
- TABLE 125. BRAZIL ACTIVE INSULATION MARKET, BY APPLICATION, 2021-2031 ($MILLION)
- TABLE 126. BRAZIL ACTIVE INSULATION MARKET, BY APPLICATION, 2021-2031 (TONS)
- TABLE 127. SAUDI ARABIA ACTIVE INSULATION MARKET, BY MATERIAL, 2021-2031 ($MILLION)
- TABLE 128. SAUDI ARABIA ACTIVE INSULATION MARKET, BY MATERIAL, 2021-2031 (TONS)
- TABLE 129. SAUDI ARABIA ACTIVE INSULATION MARKET, BY APPLICATION, 2021-2031 ($MILLION)
- TABLE 130. SAUDI ARABIA ACTIVE INSULATION MARKET, BY APPLICATION, 2021-2031 (TONS)
- TABLE 131. SOUTH AFRICA ACTIVE INSULATION MARKET, BY MATERIAL, 2021-2031 ($MILLION)
- TABLE 132. SOUTH AFRICA ACTIVE INSULATION MARKET, BY MATERIAL, 2021-2031 (TONS)
- TABLE 133. SOUTH AFRICA ACTIVE INSULATION MARKET, BY APPLICATION, 2021-2031 ($MILLION)
- TABLE 134. SOUTH AFRICA ACTIVE INSULATION MARKET, BY APPLICATION, 2021-2031 (TONS)
- TABLE 135. REST OF LAMEA ACTIVE INSULATION MARKET, BY MATERIAL, 2021-2031 ($MILLION)
- TABLE 136. REST OF LAMEA ACTIVE INSULATION MARKET, BY MATERIAL, 2021-2031 (TONS)
- TABLE 137. REST OF LAMEA ACTIVE INSULATION MARKET, BY APPLICATION, 2021-2031 ($MILLION)
- TABLE 138. REST OF LAMEA ACTIVE INSULATION MARKET, BY APPLICATION, 2021-2031 (TONS)
- TABLE 139.BASF SE: COMPANY SNAPSHOT
- TABLE 140.BASF SE: OPERATING SEGMENTS
- TABLE 141.BASF SE: PRODUCT PORTFOLIO
- TABLE 142.BASF SE: NET SALES,
- TABLE 143.BASF SE: KEY STRATERGIES
- TABLE 144.HDWOOL LTD: COMPANY SNAPSHOT
- TABLE 145.HDWOOL LTD: OPERATING SEGMENTS
- TABLE 146.HDWOOL LTD: PRODUCT PORTFOLIO
- TABLE 147.HDWOOL LTD: NET SALES,
- TABLE 148.HDWOOL LTD: KEY STRATERGIES
- TABLE 149.INVISTA TEXTILES: COMPANY SNAPSHOT
- TABLE 150.INVISTA TEXTILES: OPERATING SEGMENTS
- TABLE 151.INVISTA TEXTILES: PRODUCT PORTFOLIO
- TABLE 152.INVISTA TEXTILES: NET SALES,
- TABLE 153.INVISTA TEXTILES: KEY STRATERGIES
- TABLE 154.THE 3M COMPANY: COMPANY SNAPSHOT
- TABLE 155.THE 3M COMPANY: OPERATING SEGMENTS
- TABLE 156.THE 3M COMPANY: PRODUCT PORTFOLIO
- TABLE 157.THE 3M COMPANY: NET SALES,
- TABLE 158.THE 3M COMPANY: KEY STRATERGIES
- TABLE 159.POLARTEC, LLC: COMPANY SNAPSHOT
- TABLE 160.POLARTEC, LLC: OPERATING SEGMENTS
- TABLE 161.POLARTEC, LLC: PRODUCT PORTFOLIO
- TABLE 162.POLARTEC, LLC: NET SALES,
- TABLE 163.POLARTEC, LLC: KEY STRATERGIES
- TABLE 164.POLYBOND INSULATION PRIVATE LIMITED: COMPANY SNAPSHOT
- TABLE 165.POLYBOND INSULATION PRIVATE LIMITED: OPERATING SEGMENTS
- TABLE 166.POLYBOND INSULATION PRIVATE LIMITED: PRODUCT PORTFOLIO
- TABLE 167.POLYBOND INSULATION PRIVATE LIMITED: NET SALES,
- TABLE 168.POLYBOND INSULATION PRIVATE LIMITED: KEY STRATERGIES
- TABLE 169.REMMERS: COMPANY SNAPSHOT
- TABLE 170.REMMERS: OPERATING SEGMENTS
- TABLE 171.REMMERS: PRODUCT PORTFOLIO
- TABLE 172.REMMERS: NET SALES,
- TABLE 173.REMMERS: KEY STRATERGIES
- TABLE 174.STONEY CREEK LIMITED: COMPANY SNAPSHOT
- TABLE 175.STONEY CREEK LIMITED: OPERATING SEGMENTS
- TABLE 176.STONEY CREEK LIMITED: PRODUCT PORTFOLIO
- TABLE 177.STONEY CREEK LIMITED: NET SALES,
- TABLE 178.STONEY CREEK LIMITED: KEY STRATERGIES
- TABLE 179.TORAY INDUSTRIES, INC.: COMPANY SNAPSHOT
- TABLE 180.TORAY INDUSTRIES, INC.: OPERATING SEGMENTS
- TABLE 181.TORAY INDUSTRIES, INC.: PRODUCT PORTFOLIO
- TABLE 182.TORAY INDUSTRIES, INC.: NET SALES,
- TABLE 183.TORAY INDUSTRIES, INC.: KEY STRATERGIES
- TABLE 184.W.L. GORE AND ASSOCIATES: COMPANY SNAPSHOT
- TABLE 185.W.L. GORE AND ASSOCIATES: OPERATING SEGMENTS
- TABLE 186.W.L. GORE AND ASSOCIATES: PRODUCT PORTFOLIO
- TABLE 187.W.L. GORE AND ASSOCIATES: NET SALES,
- TABLE 188.W.L. GORE AND ASSOCIATES: KEY STRATERGIES
LIST OF FIGURES
- FIGURE 1.ACTIVE INSULATION MARKET SEGMENTATION
- FIGURE 2.ACTIVE INSULATION MARKET,2021-2031
- FIGURE 3.ACTIVE INSULATION MARKET,2021-2031
- FIGURE 4. TOP INVESTMENT POCKETS, BY REGION
- FIGURE 5.PORTER FIVE-1
- FIGURE 6.PORTER FIVE-2
- FIGURE 7.PORTER FIVE-3
- FIGURE 8.PORTER FIVE-4
- FIGURE 9.PORTER FIVE-5
- FIGURE 10.TOP PLAYER POSITIONING
- FIGURE 11.ACTIVE INSULATION MARKET:DRIVERS, RESTRAINTS AND OPPORTUNITIES
- FIGURE 12.PRICING ANALYSIS
- FIGURE 13.VALUE CHAIN ANALYSIS
- FIGURE 14.KEY REGULATION ANALYSIS
- FIGURE 15.PATENT ANALYSIS BY COMPANY
- FIGURE 16.PATENT ANALYSIS BY COUNTRY
- FIGURE 17.REGULATORY GUIDELINES
- FIGURE 18.ACTIVE INSULATION MARKET,BY MATERIAL,2021(%)
- FIGURE 19.COMPARATIVE SHARE ANALYSIS OF POLYESTER ACTIVE INSULATION MARKET,2021-2031(%)
- FIGURE 20.COMPARATIVE SHARE ANALYSIS OF COTTON ACTIVE INSULATION MARKET,2021-2031(%)
- FIGURE 21.COMPARATIVE SHARE ANALYSIS OF WOOL ACTIVE INSULATION MARKET,2021-2031(%)
- FIGURE 22.COMPARATIVE SHARE ANALYSIS OF NYLON ACTIVE INSULATION MARKET,2021-2031(%)
- FIGURE 23.COMPARATIVE SHARE ANALYSIS OF GLASS WOOL ACTIVE INSULATION MARKET,2021-2031(%)
- FIGURE 24.COMPARATIVE SHARE ANALYSIS OF EXPANDED POLYSTYRENE ACTIVE INSULATION MARKET,2021-2031(%)
- FIGURE 25.ACTIVE INSULATION MARKET,BY APPLICATION,2021(%)
- FIGURE 26.COMPARATIVE SHARE ANALYSIS OF TEXTILE ACTIVE INSULATION MARKET,2021-2031(%)
- FIGURE 27.COMPARATIVE SHARE ANALYSIS OF BUILDING AND CONSTRUCTION ACTIVE INSULATION MARKET,2021-2031(%)
- FIGURE 28.ACTIVE INSULATION MARKET BY REGION,2021
- FIGURE 29.U.S. ACTIVE INSULATION MARKET,2021-2031($MILLION)
- FIGURE 30.CANADA ACTIVE INSULATION MARKET,2021-2031($MILLION)
- FIGURE 31.MEXICO ACTIVE INSULATION MARKET,2021-2031($MILLION)
- FIGURE 32.GERMANY ACTIVE INSULATION MARKET,2021-2031($MILLION)
- FIGURE 33.U.K. ACTIVE INSULATION MARKET,2021-2031($MILLION)
- FIGURE 34.FRANCE ACTIVE INSULATION MARKET,2021-2031($MILLION)
- FIGURE 35.SPAIN ACTIVE INSULATION MARKET,2021-2031($MILLION)
- FIGURE 36.ITALY ACTIVE INSULATION MARKET,2021-2031($MILLION)
- FIGURE 37.REST OF EUROPE ACTIVE INSULATION MARKET,2021-2031($MILLION)
- FIGURE 38.CHINA ACTIVE INSULATION MARKET,2021-2031($MILLION)
- FIGURE 39.INDIA ACTIVE INSULATION MARKET,2021-2031($MILLION)
- FIGURE 40.JAPAN ACTIVE INSULATION MARKET,2021-2031($MILLION)
- FIGURE 41.SOUTH KOREA ACTIVE INSULATION MARKET,2021-2031($MILLION)
- FIGURE 42.AUSTRALIA ACTIVE INSULATION MARKET,2021-2031($MILLION)
- FIGURE 43.REST OF ASIA-PACIFIC ACTIVE INSULATION MARKET,2021-2031($MILLION)
- FIGURE 44.BRAZIL ACTIVE INSULATION MARKET,2021-2031($MILLION)
- FIGURE 45.SAUDI ARABIA ACTIVE INSULATION MARKET,2021-2031($MILLION)
- FIGURE 46.SOUTH AFRICA ACTIVE INSULATION MARKET,2021-2031($MILLION)
- FIGURE 47.REST OF LAMEA ACTIVE INSULATION MARKET,2021-2031($MILLION)
- FIGURE 48. TOP WINNING STRATEGIES, BY YEAR
- FIGURE 49. TOP WINNING STRATEGIES, BY DEVELOPMENT
- FIGURE 50. TOP WINNING STRATEGIES, BY COMPANY
- FIGURE 51.PRODUCT MAPPING OF TOP 10 PLAYERS
- FIGURE 52.COMPETITIVE DASHBOARD
- FIGURE 53.COMPETITIVE HEATMAP OF TOP 10 KEY PLAYERS
- FIGURE 54.BASF SE.: NET SALES ,($MILLION)
- FIGURE 55.HDWOOL LTD.: NET SALES ,($MILLION)
- FIGURE 56.INVISTA TEXTILES.: NET SALES ,($MILLION)
- FIGURE 57.THE 3M COMPANY.: NET SALES ,($MILLION)
- FIGURE 58.POLARTEC, LLC.: NET SALES ,($MILLION)
- FIGURE 59.POLYBOND INSULATION PRIVATE LIMITED.: NET SALES ,($MILLION)
- FIGURE 60.REMMERS.: NET SALES ,($MILLION)
- FIGURE 61.STONEY CREEK LIMITED.: NET SALES ,($MILLION)
- FIGURE 62.TORAY INDUSTRIES, INC..: NET SALES ,($MILLION)
- FIGURE 63.W.L. GORE AND ASSOCIATES.: NET SALES ,($MILLION)
The global active insulation market forecast was valued at $288.5 million in 2021, and is projected to reach $512.8 million by 2031, growing at a CAGR of 5.9% from 2022 to 2031.
Active insulation is a thermal insulation or a type of clothing layer that is used as an ideal mid-layer for protecting against cold. Active insulation allows to create warm environmental conditions by allowing exchange of moisture/sweat.
The growth of the global active insulation market is driven by increase in use of active insulation jackets and pants by mountaineers and trek hikers. These jackets and pants are widely opted by mountaineers as an ideal mid-layer thermal protection fabrics during uphill while these are used as outer layer thermal protective fabric during long glacier climbs. In addition, active insulated fabrics or textiles are also used by the U.S. Special Forces (type of army force) as advanced insulating material along with their usual combat army uniforms.
These active insulated army uniforms are capable of regulating the body temperature as army troops are subjected to dynamic and static activities. In addition, active insulated jackets eliminate the need of adding thermal protective layer externally. This makes active insulated jackets widely preferred by army troops as they find difficulties during wearing of external thermal layer during the move. Thus, all these factors together are predicted to augment the demand for active insulation global market.
However, risk associated with use of active insulation products in interior insulation systems is likely to hamper the market growth. For instance, capillary active insulation system (type of active insulation) is widely preferred for thermal insulation in building & construction industry. This active insulation system is used mostly for thermal insulation of cultural heritage buildings. However, interstitial condensation risk associated with active insulation systems is anticipated to hamper the market growth.
Conversely, the active insulation market is expanding rapidly owing to wide preference of active insulated mountaineer jackets and other gears. Key-players in the global market are launching innovative active insulation products is anticipated create immense growth opportunities for the growth of active insulation. For instance, Rab Alpha Flash Jacket is a type of active insulation that is capable of offering breathability and minimal weight makes it ideal mid layer thermal active insulation material by mountain trekkers.
The active insulation market is segmented on the basis of material, application, and region. On the basis of material, the market is categorized into polyester, cotton, wool, nylon, and expanded polystyrene (EPS). The applications covered in the report includes textile and building & construction. Region wise, the market is studied across North America, Europe, Asia-Pacific, and LAMEA.
The global active insulation market profiles leading players that include BASF Corporation, Hdwool Ltd., Invista Textiles, 3M Company, Polartec, LLC, Polybond Insulation Private Limited, Remmers, Stoney Creek Limited, Toray Industries, Inc., and W.L. Gore & Associates. The global active insulation market report provides in-depth competitive analysis as well as profiles of these major players
Key Benefits For Stakeholders
- This report provides a quantitative analysis of the market segments, current trends, estimations, and dynamics of the active insulation market analysis from 2021 to 2031 to identify the prevailing active insulation market opportunities.
- The market research is offered along with information related to key drivers, restraints, and opportunities.
- Porter's five forces analysis highlights the potency of buyers and suppliers to enable stakeholders make profit-oriented business decisions and strengthen their supplier-buyer network.
- In-depth analysis of the active insulation market segmentation assists to determine the prevailing market opportunities.
- Major countries in each region are mapped according to their revenue contribution to the global market.
- Market player positioning facilitates benchmarking and provides a clear understanding of the present position of the market players.
- The report includes the analysis of the regional as well as global active insulation market trends, key players, market segments, application areas, and market growth strategies.
Key Market Segments
By Application
- Textile
- Building and Construction
By Material
- Polyester
- Cotton
- Wool
- Nylon
- Glass Wool
- Expanded Polystyrene
By Region
- North America
- U.S.
- Canada
- Mexico
- Europe
- Germany
- U.K.
- France
- Spain
- Italy
- Rest of Europe
- Asia-Pacific
- China
- India
- Japan
- South Korea
- Australia
- Rest of Asia-Pacific
- LAMEA
- Brazil
- Saudi Arabia
- South Africa
- Rest of LAMEA
- Key Market Players
- BASF SE
- Hdwool Ltd
- Invista Textiles
- The 3M Company
- Polartec, LLC
- Polybond Insulation Private Limited
- Remmers
- Stoney Creek Limited
- Toray Industries, Inc.
- W.L. Gore and Associates
TABLE OF CONTENTS
CHAPTER 1:INTRODUCTION
- 1.1.Report description
- 1.2.Key market segments
- 1.3.Key benefits to the stakeholders
- 1.4.Research Methodology
- 1.4.1.Secondary research
- 1.4.2.Primary research
- 1.4.3.Analyst tools and models
CHAPTER 2:EXECUTIVE SUMMARY
- 2.1.Key findings of the study
- 2.2.CXO Perspective
CHAPTER 3:MARKET OVERVIEW
- 3.1.Market definition and scope
- 3.2.Key findings
- 3.2.1.Top investment pockets
- 3.3.Porter's five forces analysis
- 3.4.Top player positioning
- 3.5.Market dynamics
- 3.5.1.Drivers
- 3.5.2.Restraints
- 3.5.3.Opportunities
- 3.6.COVID-19 Impact Analysis on the market
- 3.7.Pricing Analysis
- 3.8.Value Chain Analysis
- 3.9.Key Regulation Analysis
- 3.10.Patent Landscape
- 3.11.Regulatory Guidelines
CHAPTER 4: ACTIVE INSULATION MARKET, BY MATERIAL
- 4.1 Overview
- 4.1.1 Market size and forecast
- 4.2 Polyester
- 4.2.1 Key market trends, growth factors and opportunities
- 4.2.2 Market size and forecast, by region
- 4.2.3 Market analysis by country
- 4.3 Cotton
- 4.3.1 Key market trends, growth factors and opportunities
- 4.3.2 Market size and forecast, by region
- 4.3.3 Market analysis by country
- 4.4 Wool
- 4.4.1 Key market trends, growth factors and opportunities
- 4.4.2 Market size and forecast, by region
- 4.4.3 Market analysis by country
- 4.5 Nylon
- 4.5.1 Key market trends, growth factors and opportunities
- 4.5.2 Market size and forecast, by region
- 4.5.3 Market analysis by country
- 4.6 Glass Wool
- 4.6.1 Key market trends, growth factors and opportunities
- 4.6.2 Market size and forecast, by region
- 4.6.3 Market analysis by country
- 4.7 Expanded Polystyrene
- 4.7.1 Key market trends, growth factors and opportunities
- 4.7.2 Market size and forecast, by region
- 4.7.3 Market analysis by country
CHAPTER 5: ACTIVE INSULATION MARKET, BY APPLICATION
- 5.1 Overview
- 5.1.1 Market size and forecast
- 5.2 Textile
- 5.2.1 Key market trends, growth factors and opportunities
- 5.2.2 Market size and forecast, by region
- 5.2.3 Market analysis by country
- 5.3 Building and Construction
- 5.3.1 Key market trends, growth factors and opportunities
- 5.3.2 Market size and forecast, by region
- 5.3.3 Market analysis by country
CHAPTER 6: ACTIVE INSULATION MARKET, BY REGION
- 6.1 Overview
- 6.1.1 Market size and forecast
- 6.2 North America
- 6.2.1 Key trends and opportunities
- 6.2.2 North America Market size and forecast, by Material
- 6.2.3 North America Market size and forecast, by Application
- 6.2.4 North America Market size and forecast, by country
- 6.2.4.1 U.S.
- 6.2.4.1.1 Market size and forecast, by Material
- 6.2.4.1.2 Market size and forecast, by Application
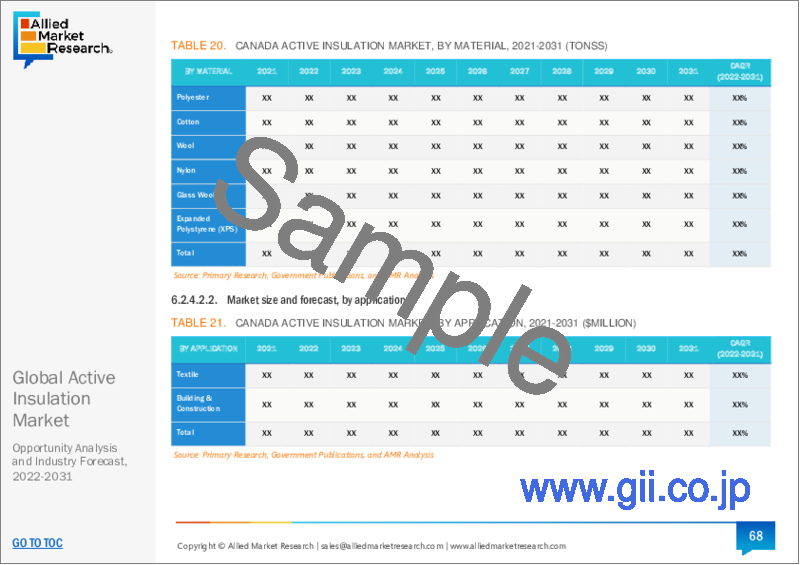
- 6.2.4.2 Canada
- 6.2.4.2.1 Market size and forecast, by Material
- 6.2.4.2.2 Market size and forecast, by Application
- 6.2.4.3 Mexico
- 6.2.4.3.1 Market size and forecast, by Material
- 6.2.4.3.2 Market size and forecast, by Application
- 6.3 Europe
- 6.3.1 Key trends and opportunities
- 6.3.2 Europe Market size and forecast, by Material
- 6.3.3 Europe Market size and forecast, by Application
- 6.3.4 Europe Market size and forecast, by country
- 6.3.4.1 Germany
- 6.3.4.1.1 Market size and forecast, by Material
- 6.3.4.1.2 Market size and forecast, by Application
- 6.3.4.2 U.K.
- 6.3.4.2.1 Market size and forecast, by Material
- 6.3.4.2.2 Market size and forecast, by Application
- 6.3.4.3 France
- 6.3.4.3.1 Market size and forecast, by Material
- 6.3.4.3.2 Market size and forecast, by Application
- 6.3.4.4 Spain
- 6.3.4.4.1 Market size and forecast, by Material
- 6.3.4.4.2 Market size and forecast, by Application
- 6.3.4.5 Italy
- 6.3.4.5.1 Market size and forecast, by Material
- 6.3.4.5.2 Market size and forecast, by Application
- 6.3.4.6 Rest of Europe
- 6.3.4.6.1 Market size and forecast, by Material
- 6.3.4.6.2 Market size and forecast, by Application
- 6.4 Asia-Pacific
- 6.4.1 Key trends and opportunities
- 6.4.2 Asia-Pacific Market size and forecast, by Material
- 6.4.3 Asia-Pacific Market size and forecast, by Application
- 6.4.4 Asia-Pacific Market size and forecast, by country
- 6.4.4.1 China
- 6.4.4.1.1 Market size and forecast, by Material
- 6.4.4.1.2 Market size and forecast, by Application
- 6.4.4.2 India
- 6.4.4.2.1 Market size and forecast, by Material
- 6.4.4.2.2 Market size and forecast, by Application
- 6.4.4.3 Japan
- 6.4.4.3.1 Market size and forecast, by Material
- 6.4.4.3.2 Market size and forecast, by Application
- 6.4.4.4 South Korea
- 6.4.4.4.1 Market size and forecast, by Material
- 6.4.4.4.2 Market size and forecast, by Application
- 6.4.4.5 Australia
- 6.4.4.5.1 Market size and forecast, by Material
- 6.4.4.5.2 Market size and forecast, by Application
- 6.4.4.6 Rest of Asia-Pacific
- 6.4.4.6.1 Market size and forecast, by Material
- 6.4.4.6.2 Market size and forecast, by Application
- 6.5 LAMEA
- 6.5.1 Key trends and opportunities
- 6.5.2 LAMEA Market size and forecast, by Material
- 6.5.3 LAMEA Market size and forecast, by Application
- 6.5.4 LAMEA Market size and forecast, by country
- 6.5.4.1 Brazil
- 6.5.4.1.1 Market size and forecast, by Material
- 6.5.4.1.2 Market size and forecast, by Application
- 6.5.4.2 Saudi Arabia
- 6.5.4.2.1 Market size and forecast, by Material
- 6.5.4.2.2 Market size and forecast, by Application
- 6.5.4.3 South Africa
- 6.5.4.3.1 Market size and forecast, by Material
- 6.5.4.3.2 Market size and forecast, by Application
- 6.5.4.4 Rest of LAMEA
- 6.5.4.4.1 Market size and forecast, by Material
- 6.5.4.4.2 Market size and forecast, by Application
CHAPTER 7: COMPANY LANDSCAPE
- 7.1. Introduction
- 7.2. Top winning strategies
- 7.3. Product Mapping of Top 10 Player
- 7.4. Competitive Dashboard
- 7.5. Competitive Heatmap
- 7.6. Key developments
CHAPTER 8: COMPANY PROFILES
- 8.1 BASF SE
- 8.1.1 Company overview
- 8.1.2 Company snapshot
- 8.1.3 Operating business segments
- 8.1.4 Product portfolio
- 8.1.5 Business performance
- 8.1.6 Key strategic moves and developments
- 8.2 Hdwool Ltd
- 8.2.1 Company overview
- 8.2.2 Company snapshot
- 8.2.3 Operating business segments
- 8.2.4 Product portfolio
- 8.2.5 Business performance
- 8.2.6 Key strategic moves and developments
- 8.3 Invista Textiles
- 8.3.1 Company overview
- 8.3.2 Company snapshot
- 8.3.3 Operating business segments
- 8.3.4 Product portfolio
- 8.3.5 Business performance
- 8.3.6 Key strategic moves and developments
- 8.4 The 3M Company
- 8.4.1 Company overview
- 8.4.2 Company snapshot
- 8.4.3 Operating business segments
- 8.4.4 Product portfolio
- 8.4.5 Business performance
- 8.4.6 Key strategic moves and developments
- 8.5 Polartec, LLC
- 8.5.1 Company overview
- 8.5.2 Company snapshot
- 8.5.3 Operating business segments
- 8.5.4 Product portfolio
- 8.5.5 Business performance
- 8.5.6 Key strategic moves and developments
- 8.6 Polybond Insulation Private Limited
- 8.6.1 Company overview
- 8.6.2 Company snapshot
- 8.6.3 Operating business segments
- 8.6.4 Product portfolio
- 8.6.5 Business performance
- 8.6.6 Key strategic moves and developments
- 8.7 Remmers
- 8.7.1 Company overview
- 8.7.2 Company snapshot
- 8.7.3 Operating business segments
- 8.7.4 Product portfolio
- 8.7.5 Business performance
- 8.7.6 Key strategic moves and developments
- 8.8 Stoney Creek Limited
- 8.8.1 Company overview
- 8.8.2 Company snapshot
- 8.8.3 Operating business segments
- 8.8.4 Product portfolio
- 8.8.5 Business performance
- 8.8.6 Key strategic moves and developments
- 8.9 Toray Industries, Inc.
- 8.9.1 Company overview
- 8.9.2 Company snapshot
- 8.9.3 Operating business segments
- 8.9.4 Product portfolio
- 8.9.5 Business performance
- 8.9.6 Key strategic moves and developments
- 8.10 W.L. Gore and Associates
- 8.10.1 Company overview
- 8.10.2 Company snapshot
- 8.10.3 Operating business segments
- 8.10.4 Product portfolio
- 8.10.5 Business performance
- 8.10.6 Key strategic moves and developments