|
|
市場調査レポート
商品コード
1140053
補償光学市場:コンポーネント別、業界別、用途別:世界の機会分析と産業予測、2021-2031年Adaptive Optics Market By Component, By Industry Vertical, By Application: Global Opportunity Analysis and Industry Forecast, 2021-2031 |
||||||
|
|
|||||||


| 補償光学市場:コンポーネント別、業界別、用途別:世界の機会分析と産業予測、2021-2031年 |
|
出版日: 2022年08月01日
発行: Allied Market Research
ページ情報: 英文 304 Pages
納期: 2~3営業日
|
- 全表示
- 概要
- 図表
- 目次
このレポートでは、大気の乱れを取り除き、地上から望遠鏡で回折限界のイメージングを実現する技術に注目した、世界の補償光学市場の調査を組み込んでいます。
光学機器は、光波に見られる歪みのために、測定やイメージング中にエラーを経験します。補償光学は、このような誤差を補正し、光学機器の性能を向上させる技術です。波面の歪みを測定し、変形ミラーや液晶アレイなど、その歪みを補正するデバイスで補正することで実現します。現在、補償光学は光学系の性能を向上させる可能性があるとして、急速に需要が高まっています。例えば、2020年1月、全米科学財団(NSF)の最新型イノウエ太陽4m望遠鏡は、地球大気で生じるぼやけを補償するために補償光学を用いた最初の画像を作成しました。
天文学分野での採用、網膜変性疾患の有病率の増加、様々な生物医学研究業務における高解像度顕微鏡の需要増などの要因が、補償光学市場の成長を補完しています。しかし、適応システムの高い初期コスト、宇宙光学ソリューションの複雑な設計と最適化が補償光学市場の成長を阻害する要因になると見られています。さらに、成長を助けるためにシステム効率を高めるフォトニクス対応製品の需要増、先端光学技術へのR&D投資増が、補償光学市場で活動する主要プレイヤに市場機会を創出しています。
目次
第1章 イントロダクション
第2章 エグゼクティブサマリー
第3章 市場の概要
- 市場の定義と範囲
- 主な調査結果
- 主な投資ポケット
- ポーターのファイブフォース分析
- 主要企業のポジショニング
- 市場力学
- 促進要因
- 抑制要因
- 機会
- COVID-19 影響分析
第4章 補償光学市場:コンポーネント別
- 概要
- 市場規模・予測
- 波面センサー
- 主な市場動向、成長要因、機会
- 市場規模・予測:地域別
- 市場分析:国別
- 波面変調器
- 主な市場動向、成長要因、機会
- 市場規模・予測:地域別
- 市場分析:国別
- 制御システム
- 主な市場動向、成長要因、機会
- 市場規模・予測:地域別
- 市場分析:国別
第5章 補償光学市場: 業界別
- 概要
- 市場規模・予測
- 天文
- 主な市場動向、成長要因、機会
- 市場規模・予測: 地域別
- 市場分析:国別
- バイオメディカル
- 主な市場動向、成長要因、機会
- 市場規模・予測:地域別
- 市場分析:国別
- 軍事・防衛
- 主な市場動向、成長要因、機会
- 市場規模・予測:地域別
- 市場分析:国別
- 産業・製造業
- 主な市場動向、成長要因、機会
- 市場規模・予測:地域別
- 市場分析:国別
- その他
- 主な市場動向、成長要因、機会
- 市場規模・予測:地域別
- 市場分析:国別
第6章 補償光学市場:用途別
- 概要
- 市場規模・予測
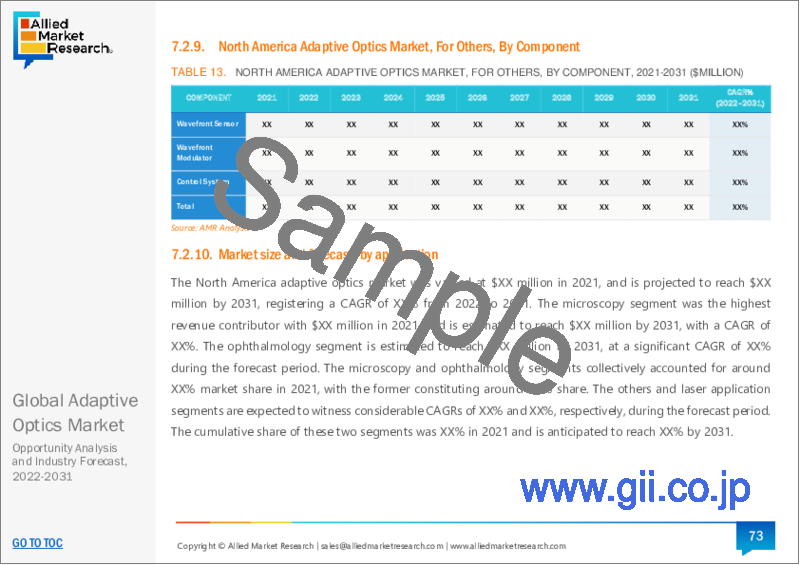
- 眼科分野
- 主な市場動向、成長要因、機会
- 市場規模・予測:地域別
- 市場分析:国別
- マイクロスコープ
- 主な市場動向、成長要因、機会
- 市場規模・予測:地域別
- 市場分析:国別
- レーザーアプリケーション
- 主な市場動向、成長要因、機会
- 市場規模・予測:地域別
- 市場分析:国別
- その他
- 主な市場動向、成長要因、機会
- 市場規模・予測:地域別
- 市場分析:国別
第7章 補償光学市場: 地域別
- 概要
- 市場規模・予測
- 北米
- 主な動向と機会
- 北米市場規模・予測:コンポーネント別
- 北米の市場規模・予測:業界別
- 北米市場規模・予測:用途別
- 北米市場規模・予測:国別
- 米国
- カナダ
- メキシコ
- 欧州
- 主な動向と機会
- 欧州市場規模・予測:コンポーネント別
- 欧州市場規模・予測:業界別
- 欧州市場規模・予測:用途別
- 欧州市場規模・予測:国別
- 英国
- ドイツ
- フランス
- ロシア
- イタリア
- その他の欧州
- アジア太平洋地域
- 主な動向と機会
- アジア太平洋地域の市場規模・予測:コンポーネント別
- アジア太平洋地域の市場規模・予測:業種別
- アジア太平洋地域の市場規模・予測:用途別
- アジア太平洋地域の市場規模・予測:国別
- 中国
- 日本
- インド
- 韓国
- オーストラリア
- その他アジア太平洋地域
- LAMEA
- 主な動向と機会
- LAMEAの市場規模・予測:コンポーネント別
- LAMEAの市場規模・予測:業界別
- LAMEAの市場規模・予測:用途別
- LAMEAの市場規模・予測:国別
- ラテンアメリカ
- 中東
- アフリカ
第8章 企業情勢
- イントロダクション
- 主要成功戦略
- 主要10社の製品マッピング
- 競合ダッシュボード
- 競合のヒートマップ
- 主な発展
第9章 企業プロファイル
- Active optical systems
- Adaptica
- Aka optics SAS
- ALPAO
- Baker Adaptive Optics
- Benchmark Electronics Inc.
- Boston Micromachines Corporation
- Edmund Optics Inc.
- Electro Optic Systems Pty Ltd
- Flexible Optical B.V.
- Imagine Optic
- Iris AO, Inc.
- Northrop Grumman Corporation
- Phasics
- Synopsys, Inc.
- Teledyne e2v
- Thorlabs, Inc.
LIST OF TABLES
- TABLE 1. GLOBAL ADAPTIVE OPTICS MARKET, BY COMPONENT, 2021-2031 ($MILLION)
- TABLE 2. ADAPTIVE OPTICS MARKET SIZE, FOR WAVEFRONT SENSOR, BY REGION, 2021-2031 ($MILLION)
- TABLE 3. ADAPTIVE OPTICS MARKET FOR WAVEFRONT SENSOR, BY COUNTRY, 2021-2031 ($MILLION)
- TABLE 4. ADAPTIVE OPTICS MARKET SIZE, FOR WAVEFRONT MODULATOR, BY REGION, 2021-2031 ($MILLION)
- TABLE 5. ADAPTIVE OPTICS MARKET FOR WAVEFRONT MODULATOR, BY COUNTRY, 2021-2031 ($MILLION)
- TABLE 6. ADAPTIVE OPTICS MARKET SIZE, FOR CONTROL SYSTEM, BY REGION, 2021-2031 ($MILLION)
- TABLE 7. ADAPTIVE OPTICS MARKET FOR CONTROL SYSTEM, BY COUNTRY, 2021-2031 ($MILLION)
- TABLE 8. GLOBAL ADAPTIVE OPTICS MARKET, BY INDUSTRY VERTICAL, 2021-2031 ($MILLION)
- TABLE 9. ADAPTIVE OPTICS MARKET SIZE, FOR ASTRONOMY, BY REGION, 2021-2031 ($MILLION)
- TABLE 10. ADAPTIVE OPTICS MARKET FOR ASTRONOMY, BY COUNTRY, 2021-2031 ($MILLION)
- TABLE 11. ADAPTIVE OPTICS MARKET SIZE, FOR BIOMEDICAL, BY REGION, 2021-2031 ($MILLION)
- TABLE 12. ADAPTIVE OPTICS MARKET FOR BIOMEDICAL, BY COUNTRY, 2021-2031 ($MILLION)
- TABLE 13. ADAPTIVE OPTICS MARKET SIZE, FOR MILITARY & DEFENSE, BY REGION, 2021-2031 ($MILLION)
- TABLE 14. ADAPTIVE OPTICS MARKET FOR MILITARY & DEFENSE, BY COUNTRY, 2021-2031 ($MILLION)
- TABLE 15. ADAPTIVE OPTICS MARKET SIZE, FOR INDUSTRIAL & MANUFACTURING, BY REGION, 2021-2031 ($MILLION)
- TABLE 16. ADAPTIVE OPTICS MARKET FOR INDUSTRIAL & MANUFACTURING, BY COUNTRY, 2021-2031 ($MILLION)
- TABLE 17. ADAPTIVE OPTICS MARKET SIZE, FOR OTHERS, BY REGION, 2021-2031 ($MILLION)
- TABLE 18. ADAPTIVE OPTICS MARKET FOR OTHERS, BY COUNTRY, 2021-2031 ($MILLION)
- TABLE 19. GLOBAL ADAPTIVE OPTICS MARKET, BY APPLICATION, 2021-2031 ($MILLION)
- TABLE 20. ADAPTIVE OPTICS MARKET SIZE, FOR OPHTHALMOLOGY, BY REGION, 2021-2031 ($MILLION)
- TABLE 21. ADAPTIVE OPTICS MARKET FOR OPHTHALMOLOGY, BY COUNTRY, 2021-2031 ($MILLION)
- TABLE 22. ADAPTIVE OPTICS MARKET SIZE, FOR MICROSCOPY, BY REGION, 2021-2031 ($MILLION)
- TABLE 23. ADAPTIVE OPTICS MARKET FOR MICROSCOPY, BY COUNTRY, 2021-2031 ($MILLION)
- TABLE 24. ADAPTIVE OPTICS MARKET SIZE, FOR LASER APPLICATION, BY REGION, 2021-2031 ($MILLION)
- TABLE 25. ADAPTIVE OPTICS MARKET FOR LASER APPLICATION, BY COUNTRY, 2021-2031 ($MILLION)
- TABLE 26. ADAPTIVE OPTICS MARKET SIZE, FOR OTHERS, BY REGION, 2021-2031 ($MILLION)
- TABLE 27. ADAPTIVE OPTICS MARKET FOR OTHERS, BY COUNTRY, 2021-2031 ($MILLION)
- TABLE 28. ADAPTIVE OPTICS MARKET, BY REGION, 2021-2031 ($MILLION)
- TABLE 29. NORTH AMERICA ADAPTIVE OPTICS MARKET, BY COMPONENT, 2021-2031 ($MILLION)
- TABLE 30. NORTH AMERICA ADAPTIVE OPTICS MARKET, BY INDUSTRY VERTICAL, 2021-2031 ($MILLION)
- TABLE 31. NORTH AMERICA ADAPTIVE OPTICS MARKET, BY APPLICATION, 2021-2031 ($MILLION)
- TABLE 32. NORTH AMERICA ADAPTIVE OPTICS MARKET, BY COUNTRY, 2021-2031 ($MILLION)
- TABLE 33. U.S. ADAPTIVE OPTICS MARKET, BY COMPONENT, 2021-2031 ($MILLION)
- TABLE 34. U.S. ADAPTIVE OPTICS MARKET, BY INDUSTRY VERTICAL, 2021-2031 ($MILLION)
- TABLE 35. U.S. ADAPTIVE OPTICS MARKET, BY APPLICATION, 2021-2031 ($MILLION)
- TABLE 36. CANADA ADAPTIVE OPTICS MARKET, BY COMPONENT, 2021-2031 ($MILLION)
- TABLE 37. CANADA ADAPTIVE OPTICS MARKET, BY INDUSTRY VERTICAL, 2021-2031 ($MILLION)
- TABLE 38. CANADA ADAPTIVE OPTICS MARKET, BY APPLICATION, 2021-2031 ($MILLION)
- TABLE 39. MEXICO ADAPTIVE OPTICS MARKET, BY COMPONENT, 2021-2031 ($MILLION)
- TABLE 40. MEXICO ADAPTIVE OPTICS MARKET, BY INDUSTRY VERTICAL, 2021-2031 ($MILLION)
- TABLE 41. MEXICO ADAPTIVE OPTICS MARKET, BY APPLICATION, 2021-2031 ($MILLION)
- TABLE 42. EUROPE ADAPTIVE OPTICS MARKET, BY COMPONENT, 2021-2031 ($MILLION)
- TABLE 43. EUROPE ADAPTIVE OPTICS MARKET, BY INDUSTRY VERTICAL, 2021-2031 ($MILLION)
- TABLE 44. EUROPE ADAPTIVE OPTICS MARKET, BY APPLICATION, 2021-2031 ($MILLION)
- TABLE 45. EUROPE ADAPTIVE OPTICS MARKET, BY COUNTRY, 2021-2031 ($MILLION)
- TABLE 46. UK ADAPTIVE OPTICS MARKET, BY COMPONENT, 2021-2031 ($MILLION)
- TABLE 47. UK ADAPTIVE OPTICS MARKET, BY INDUSTRY VERTICAL, 2021-2031 ($MILLION)
- TABLE 48. UK ADAPTIVE OPTICS MARKET, BY APPLICATION, 2021-2031 ($MILLION)
- TABLE 49. GERMANY ADAPTIVE OPTICS MARKET, BY COMPONENT, 2021-2031 ($MILLION)
- TABLE 50. GERMANY ADAPTIVE OPTICS MARKET, BY INDUSTRY VERTICAL, 2021-2031 ($MILLION)
- TABLE 51. GERMANY ADAPTIVE OPTICS MARKET, BY APPLICATION, 2021-2031 ($MILLION)
- TABLE 52. FRANCE ADAPTIVE OPTICS MARKET, BY COMPONENT, 2021-2031 ($MILLION)
- TABLE 53. FRANCE ADAPTIVE OPTICS MARKET, BY INDUSTRY VERTICAL, 2021-2031 ($MILLION)
- TABLE 54. FRANCE ADAPTIVE OPTICS MARKET, BY APPLICATION, 2021-2031 ($MILLION)
- TABLE 55. RUSSIA ADAPTIVE OPTICS MARKET, BY COMPONENT, 2021-2031 ($MILLION)
- TABLE 56. RUSSIA ADAPTIVE OPTICS MARKET, BY INDUSTRY VERTICAL, 2021-2031 ($MILLION)
- TABLE 57. RUSSIA ADAPTIVE OPTICS MARKET, BY APPLICATION, 2021-2031 ($MILLION)
- TABLE 58. ITALY ADAPTIVE OPTICS MARKET, BY COMPONENT, 2021-2031 ($MILLION)
- TABLE 59. ITALY ADAPTIVE OPTICS MARKET, BY INDUSTRY VERTICAL, 2021-2031 ($MILLION)
- TABLE 60. ITALY ADAPTIVE OPTICS MARKET, BY APPLICATION, 2021-2031 ($MILLION)
- TABLE 61. REST OF EUROPE ADAPTIVE OPTICS MARKET, BY COMPONENT, 2021-2031 ($MILLION)
- TABLE 62. REST OF EUROPE ADAPTIVE OPTICS MARKET, BY INDUSTRY VERTICAL, 2021-2031 ($MILLION)
- TABLE 63. REST OF EUROPE ADAPTIVE OPTICS MARKET, BY APPLICATION, 2021-2031 ($MILLION)
- TABLE 64. ASIA-PACIFIC ADAPTIVE OPTICS MARKET, BY COMPONENT, 2021-2031 ($MILLION)
- TABLE 65. ASIA-PACIFIC ADAPTIVE OPTICS MARKET, BY INDUSTRY VERTICAL, 2021-2031 ($MILLION)
- TABLE 66. ASIA-PACIFIC ADAPTIVE OPTICS MARKET, BY APPLICATION, 2021-2031 ($MILLION)
- TABLE 67. ASIA-PACIFIC ADAPTIVE OPTICS MARKET, BY COUNTRY, 2021-2031 ($MILLION)
- TABLE 68. CHINA ADAPTIVE OPTICS MARKET, BY COMPONENT, 2021-2031 ($MILLION)
- TABLE 69. CHINA ADAPTIVE OPTICS MARKET, BY INDUSTRY VERTICAL, 2021-2031 ($MILLION)
- TABLE 70. CHINA ADAPTIVE OPTICS MARKET, BY APPLICATION, 2021-2031 ($MILLION)
- TABLE 71. JAPAN ADAPTIVE OPTICS MARKET, BY COMPONENT, 2021-2031 ($MILLION)
- TABLE 72. JAPAN ADAPTIVE OPTICS MARKET, BY INDUSTRY VERTICAL, 2021-2031 ($MILLION)
- TABLE 73. JAPAN ADAPTIVE OPTICS MARKET, BY APPLICATION, 2021-2031 ($MILLION)
- TABLE 74. INDIA ADAPTIVE OPTICS MARKET, BY COMPONENT, 2021-2031 ($MILLION)
- TABLE 75. INDIA ADAPTIVE OPTICS MARKET, BY INDUSTRY VERTICAL, 2021-2031 ($MILLION)
- TABLE 76. INDIA ADAPTIVE OPTICS MARKET, BY APPLICATION, 2021-2031 ($MILLION)
- TABLE 77. SOUTH KOREA ADAPTIVE OPTICS MARKET, BY COMPONENT, 2021-2031 ($MILLION)
- TABLE 78. SOUTH KOREA ADAPTIVE OPTICS MARKET, BY INDUSTRY VERTICAL, 2021-2031 ($MILLION)
- TABLE 79. SOUTH KOREA ADAPTIVE OPTICS MARKET, BY APPLICATION, 2021-2031 ($MILLION)
- TABLE 80. AUSTRALIA ADAPTIVE OPTICS MARKET, BY COMPONENT, 2021-2031 ($MILLION)
- TABLE 81. AUSTRALIA ADAPTIVE OPTICS MARKET, BY INDUSTRY VERTICAL, 2021-2031 ($MILLION)
- TABLE 82. AUSTRALIA ADAPTIVE OPTICS MARKET, BY APPLICATION, 2021-2031 ($MILLION)
- TABLE 83. REST OF ASIA-PACIFIC ADAPTIVE OPTICS MARKET, BY COMPONENT, 2021-2031 ($MILLION)
- TABLE 84. REST OF ASIA-PACIFIC ADAPTIVE OPTICS MARKET, BY INDUSTRY VERTICAL, 2021-2031 ($MILLION)
- TABLE 85. REST OF ASIA-PACIFIC ADAPTIVE OPTICS MARKET, BY APPLICATION, 2021-2031 ($MILLION)
- TABLE 86. LAMEA ADAPTIVE OPTICS MARKET, BY COMPONENT, 2021-2031 ($MILLION)
- TABLE 87. LAMEA ADAPTIVE OPTICS MARKET, BY INDUSTRY VERTICAL, 2021-2031 ($MILLION)
- TABLE 88. LAMEA ADAPTIVE OPTICS MARKET, BY APPLICATION, 2021-2031 ($MILLION)
- TABLE 89. LAMEA ADAPTIVE OPTICS MARKET, BY COUNTRY, 2021-2031 ($MILLION)
- TABLE 90. LATIN AMERICA ADAPTIVE OPTICS MARKET, BY COMPONENT, 2021-2031 ($MILLION)
- TABLE 91. LATIN AMERICA ADAPTIVE OPTICS MARKET, BY INDUSTRY VERTICAL, 2021-2031 ($MILLION)
- TABLE 92. LATIN AMERICA ADAPTIVE OPTICS MARKET, BY APPLICATION, 2021-2031 ($MILLION)
- TABLE 93. MIDDLE EAST ADAPTIVE OPTICS MARKET, BY COMPONENT, 2021-2031 ($MILLION)
- TABLE 94. MIDDLE EAST ADAPTIVE OPTICS MARKET, BY INDUSTRY VERTICAL, 2021-2031 ($MILLION)
- TABLE 95. MIDDLE EAST ADAPTIVE OPTICS MARKET, BY APPLICATION, 2021-2031 ($MILLION)
- TABLE 96. AFRICA ADAPTIVE OPTICS MARKET, BY COMPONENT, 2021-2031 ($MILLION)
- TABLE 97. AFRICA ADAPTIVE OPTICS MARKET, BY INDUSTRY VERTICAL, 2021-2031 ($MILLION)
- TABLE 98. AFRICA ADAPTIVE OPTICS MARKET, BY APPLICATION, 2021-2031 ($MILLION)
- TABLE 99.ACTIVE OPTICAL SYSTEMS: COMPANY SNAPSHOT
- TABLE 100.ACTIVE OPTICAL SYSTEMS: OPERATING SEGMENTS
- TABLE 101.ACTIVE OPTICAL SYSTEMS: PRODUCT PORTFOLIO
- TABLE 102.ACTIVE OPTICAL SYSTEMS: NET SALES,
- TABLE 103.ACTIVE OPTICAL SYSTEMS: KEY STRATERGIES
- TABLE 104.ADAPTICA: COMPANY SNAPSHOT
- TABLE 105.ADAPTICA: OPERATING SEGMENTS
- TABLE 106.ADAPTICA: PRODUCT PORTFOLIO
- TABLE 107.ADAPTICA: NET SALES,
- TABLE 108.ADAPTICA: KEY STRATERGIES
- TABLE 109.AKA OPTICS SAS: COMPANY SNAPSHOT
- TABLE 110.AKA OPTICS SAS: OPERATING SEGMENTS
- TABLE 111.AKA OPTICS SAS: PRODUCT PORTFOLIO
- TABLE 112.AKA OPTICS SAS: NET SALES,
- TABLE 113.AKA OPTICS SAS: KEY STRATERGIES
- TABLE 114.ALPAO: COMPANY SNAPSHOT
- TABLE 115.ALPAO: OPERATING SEGMENTS
- TABLE 116.ALPAO: PRODUCT PORTFOLIO
- TABLE 117.ALPAO: NET SALES,
- TABLE 118.ALPAO: KEY STRATERGIES
- TABLE 119.BAKER ADAPTIVE OPTICS: COMPANY SNAPSHOT
- TABLE 120.BAKER ADAPTIVE OPTICS: OPERATING SEGMENTS
- TABLE 121.BAKER ADAPTIVE OPTICS: PRODUCT PORTFOLIO
- TABLE 122.BAKER ADAPTIVE OPTICS: NET SALES,
- TABLE 123.BAKER ADAPTIVE OPTICS: KEY STRATERGIES
- TABLE 124.BENCHMARK ELECTRONICS INC.: COMPANY SNAPSHOT
- TABLE 125.BENCHMARK ELECTRONICS INC.: OPERATING SEGMENTS
- TABLE 126.BENCHMARK ELECTRONICS INC.: PRODUCT PORTFOLIO
- TABLE 127.BENCHMARK ELECTRONICS INC.: NET SALES,
- TABLE 128.BENCHMARK ELECTRONICS INC.: KEY STRATERGIES
- TABLE 129.BOSTON MICROMACHINES CORPORATION: COMPANY SNAPSHOT
- TABLE 130.BOSTON MICROMACHINES CORPORATION: OPERATING SEGMENTS
- TABLE 131.BOSTON MICROMACHINES CORPORATION: PRODUCT PORTFOLIO
- TABLE 132.BOSTON MICROMACHINES CORPORATION: NET SALES,
- TABLE 133.BOSTON MICROMACHINES CORPORATION: KEY STRATERGIES
- TABLE 134.EDMUND OPTICS INC.: COMPANY SNAPSHOT
- TABLE 135.EDMUND OPTICS INC.: OPERATING SEGMENTS
- TABLE 136.EDMUND OPTICS INC.: PRODUCT PORTFOLIO
- TABLE 137.EDMUND OPTICS INC.: NET SALES,
- TABLE 138.EDMUND OPTICS INC.: KEY STRATERGIES
- TABLE 139.ELECTRO OPTIC SYSTEMS PTY LTD: COMPANY SNAPSHOT
- TABLE 140.ELECTRO OPTIC SYSTEMS PTY LTD: OPERATING SEGMENTS
- TABLE 141.ELECTRO OPTIC SYSTEMS PTY LTD: PRODUCT PORTFOLIO
- TABLE 142.ELECTRO OPTIC SYSTEMS PTY LTD: NET SALES,
- TABLE 143.ELECTRO OPTIC SYSTEMS PTY LTD: KEY STRATERGIES
- TABLE 144.FLEXIBLE OPTICAL B.V.: COMPANY SNAPSHOT
- TABLE 145.FLEXIBLE OPTICAL B.V.: OPERATING SEGMENTS
- TABLE 146.FLEXIBLE OPTICAL B.V.: PRODUCT PORTFOLIO
- TABLE 147.FLEXIBLE OPTICAL B.V.: NET SALES,
- TABLE 148.FLEXIBLE OPTICAL B.V.: KEY STRATERGIES
- TABLE 149.IMAGINE OPTIC: COMPANY SNAPSHOT
- TABLE 150.IMAGINE OPTIC: OPERATING SEGMENTS
- TABLE 151.IMAGINE OPTIC: PRODUCT PORTFOLIO
- TABLE 152.IMAGINE OPTIC: NET SALES,
- TABLE 153.IMAGINE OPTIC: KEY STRATERGIES
- TABLE 154.IRIS AO, INC.: COMPANY SNAPSHOT
- TABLE 155.IRIS AO, INC.: OPERATING SEGMENTS
- TABLE 156.IRIS AO, INC.: PRODUCT PORTFOLIO
- TABLE 157.IRIS AO, INC.: NET SALES,
- TABLE 158.IRIS AO, INC.: KEY STRATERGIES
- TABLE 159.NORTHROP GRUMMAN CORPORATION: COMPANY SNAPSHOT
- TABLE 160.NORTHROP GRUMMAN CORPORATION: OPERATING SEGMENTS
- TABLE 161.NORTHROP GRUMMAN CORPORATION: PRODUCT PORTFOLIO
- TABLE 162.NORTHROP GRUMMAN CORPORATION: NET SALES,
- TABLE 163.NORTHROP GRUMMAN CORPORATION: KEY STRATERGIES
- TABLE 164.PHASICS: COMPANY SNAPSHOT
- TABLE 165.PHASICS: OPERATING SEGMENTS
- TABLE 166.PHASICS: PRODUCT PORTFOLIO
- TABLE 167.PHASICS: NET SALES,
- TABLE 168.PHASICS: KEY STRATERGIES
- TABLE 169.SYNOPSYS, INC.: COMPANY SNAPSHOT
- TABLE 170.SYNOPSYS, INC.: OPERATING SEGMENTS
- TABLE 171.SYNOPSYS, INC.: PRODUCT PORTFOLIO
- TABLE 172.SYNOPSYS, INC.: NET SALES,
- TABLE 173.SYNOPSYS, INC.: KEY STRATERGIES
- TABLE 174.TELEDYNE E2V: COMPANY SNAPSHOT
- TABLE 175.TELEDYNE E2V: OPERATING SEGMENTS
- TABLE 176.TELEDYNE E2V: PRODUCT PORTFOLIO
- TABLE 177.TELEDYNE E2V: NET SALES,
- TABLE 178.TELEDYNE E2V: KEY STRATERGIES
- TABLE 179.THORLABS, INC.: COMPANY SNAPSHOT
- TABLE 180.THORLABS, INC.: OPERATING SEGMENTS
- TABLE 181.THORLABS, INC.: PRODUCT PORTFOLIO
- TABLE 182.THORLABS, INC.: NET SALES,
- TABLE 183.THORLABS, INC.: KEY STRATERGIES
LIST OF FIGURES
- FIGURE 1.ADAPTIVE OPTICS MARKET SEGMENTATION
- FIGURE 2.ADAPTIVE OPTICS MARKET,2021-2031
- FIGURE 3.ADAPTIVE OPTICS MARKET,2021-2031
- FIGURE 4. TOP INVESTMENT POCKETS, BY REGION
- FIGURE 5.PORTER FIVE-1
- FIGURE 6.PORTER FIVE-2
- FIGURE 7.PORTER FIVE-3
- FIGURE 8.PORTER FIVE-4
- FIGURE 9.PORTER FIVE-5
- FIGURE 10.TOP PLAYER POSITIONING
- FIGURE 11.ADAPTIVE OPTICS MARKET:DRIVERS, RESTRAINTS AND OPPORTUNITIES
- FIGURE 12.ADAPTIVE OPTICS MARKET,BY COMPONENT,2021(%)
- FIGURE 13.COMPARATIVE SHARE ANALYSIS OF WAVEFRONT SENSOR ADAPTIVE OPTICS MARKET,2021-2031(%)
- FIGURE 14.COMPARATIVE SHARE ANALYSIS OF WAVEFRONT MODULATOR ADAPTIVE OPTICS MARKET,2021-2031(%)
- FIGURE 15.COMPARATIVE SHARE ANALYSIS OF CONTROL SYSTEM ADAPTIVE OPTICS MARKET,2021-2031(%)
- FIGURE 16.ADAPTIVE OPTICS MARKET,BY INDUSTRY VERTICAL,2021(%)
- FIGURE 17.COMPARATIVE SHARE ANALYSIS OF ASTRONOMY ADAPTIVE OPTICS MARKET,2021-2031(%)
- FIGURE 18.COMPARATIVE SHARE ANALYSIS OF BIOMEDICAL ADAPTIVE OPTICS MARKET,2021-2031(%)
- FIGURE 19.COMPARATIVE SHARE ANALYSIS OF MILITARY & DEFENSE ADAPTIVE OPTICS MARKET,2021-2031(%)
- FIGURE 20.COMPARATIVE SHARE ANALYSIS OF INDUSTRIAL & MANUFACTURING ADAPTIVE OPTICS MARKET,2021-2031(%)
- FIGURE 21.COMPARATIVE SHARE ANALYSIS OF OTHERS ADAPTIVE OPTICS MARKET,2021-2031(%)
- FIGURE 22.ADAPTIVE OPTICS MARKET,BY APPLICATION,2021(%)
- FIGURE 23.COMPARATIVE SHARE ANALYSIS OF OPHTHALMOLOGY ADAPTIVE OPTICS MARKET,2021-2031(%)
- FIGURE 24.COMPARATIVE SHARE ANALYSIS OF MICROSCOPY ADAPTIVE OPTICS MARKET,2021-2031(%)
- FIGURE 25.COMPARATIVE SHARE ANALYSIS OF LASER APPLICATION ADAPTIVE OPTICS MARKET,2021-2031(%)
- FIGURE 26.COMPARATIVE SHARE ANALYSIS OF OTHERS ADAPTIVE OPTICS MARKET,2021-2031(%)
- FIGURE 27.ADAPTIVE OPTICS MARKET BY REGION,2021
- FIGURE 28.U.S. ADAPTIVE OPTICS MARKET,2021-2031($MILLION)
- FIGURE 29.CANADA ADAPTIVE OPTICS MARKET,2021-2031($MILLION)
- FIGURE 30.MEXICO ADAPTIVE OPTICS MARKET,2021-2031($MILLION)
- FIGURE 31.UK ADAPTIVE OPTICS MARKET,2021-2031($MILLION)
- FIGURE 32.GERMANY ADAPTIVE OPTICS MARKET,2021-2031($MILLION)
- FIGURE 33.FRANCE ADAPTIVE OPTICS MARKET,2021-2031($MILLION)
- FIGURE 34.RUSSIA ADAPTIVE OPTICS MARKET,2021-2031($MILLION)
- FIGURE 35.ITALY ADAPTIVE OPTICS MARKET,2021-2031($MILLION)
- FIGURE 36.REST OF EUROPE ADAPTIVE OPTICS MARKET,2021-2031($MILLION)
- FIGURE 37.CHINA ADAPTIVE OPTICS MARKET,2021-2031($MILLION)
- FIGURE 38.JAPAN ADAPTIVE OPTICS MARKET,2021-2031($MILLION)
- FIGURE 39.INDIA ADAPTIVE OPTICS MARKET,2021-2031($MILLION)
- FIGURE 40.SOUTH KOREA ADAPTIVE OPTICS MARKET,2021-2031($MILLION)
- FIGURE 41.AUSTRALIA ADAPTIVE OPTICS MARKET,2021-2031($MILLION)
- FIGURE 42.REST OF ASIA-PACIFIC ADAPTIVE OPTICS MARKET,2021-2031($MILLION)
- FIGURE 43.LATIN AMERICA ADAPTIVE OPTICS MARKET,2021-2031($MILLION)
- FIGURE 44.MIDDLE EAST ADAPTIVE OPTICS MARKET,2021-2031($MILLION)
- FIGURE 45.AFRICA ADAPTIVE OPTICS MARKET,2021-2031($MILLION)
- FIGURE 46. TOP WINNING STRATEGIES, BY YEAR
- FIGURE 47. TOP WINNING STRATEGIES, BY DEVELOPMENT
- FIGURE 48. TOP WINNING STRATEGIES, BY COMPANY
- FIGURE 49.PRODUCT MAPPING OF TOP 10 PLAYERS
- FIGURE 50.COMPETITIVE DASHBOARD
- FIGURE 51.COMPETITIVE HEATMAP OF TOP 10 KEY PLAYERS
- FIGURE 52.ACTIVE OPTICAL SYSTEMS.: NET SALES ,($MILLION)
- FIGURE 53.ADAPTICA.: NET SALES ,($MILLION)
- FIGURE 54.AKA OPTICS SAS.: NET SALES ,($MILLION)
- FIGURE 55.ALPAO.: NET SALES ,($MILLION)
- FIGURE 56.BAKER ADAPTIVE OPTICS.: NET SALES ,($MILLION)
- FIGURE 57.BENCHMARK ELECTRONICS INC..: NET SALES ,($MILLION)
- FIGURE 58.BOSTON MICROMACHINES CORPORATION.: NET SALES ,($MILLION)
- FIGURE 59.EDMUND OPTICS INC..: NET SALES ,($MILLION)
- FIGURE 60.ELECTRO OPTIC SYSTEMS PTY LTD.: NET SALES ,($MILLION)
- FIGURE 61.FLEXIBLE OPTICAL B.V..: NET SALES ,($MILLION)
- FIGURE 62.IMAGINE OPTIC.: NET SALES ,($MILLION)
- FIGURE 63.IRIS AO, INC..: NET SALES ,($MILLION)
- FIGURE 64.NORTHROP GRUMMAN CORPORATION.: NET SALES ,($MILLION)
- FIGURE 65.PHASICS.: NET SALES ,($MILLION)
- FIGURE 66.SYNOPSYS, INC..: NET SALES ,($MILLION)
- FIGURE 67.TELEDYNE E2V.: NET SALES ,($MILLION)
- FIGURE 68.THORLABS, INC..: NET SALES ,($MILLION)
The report incorporates the study of the global adaptive optics market that focuses on the technique that removes the atmospheric disturbance and allows a telescope to achieve diffraction-limited imaging from the ground. Optical instruments experience errors while measuring and imaging because of distortions found in light waves. Adaptive optics assists with invalidating these mistakes, in this way, enlightening the performance of the optical instruments. The technology works by measuring the distortions in the wavefront and compensating with a device that corrects those errors, such as a deformable mirror or a liquid crystal array. Currently, adaptive optics is quickly picking up demand as a possibility for enhancing the performance of optical systems. For instance, in January 2020, National Science Foundation (NSF), the newest Inouye Solar 4-meter Telescope, produced the first image that uses adaptive optics to compensate for the blurring created by Earth's atmosphere.
The factors such as adoption in the field of astronomy, growing prevalence of retinal degeneration diseases, and rise in demand for high-resolution microscopy in various biomedical research operations supplement the growth of the adaptive optics market. However, high initial cost of adaptive systems and complex design & optimization of space optical solutions are the factors expected to hamper the growth of the adaptive optics market. In addition, increasing demand for photonics enabled products to enhance system efficiency to aid growth and rising R&D investments in advanced optics technology creates market opportunities for the key players operating in the adaptive optics market.
For the purpose of analysis, the global adaptive optics market is segmented on the basis of component, industry vertical, application, and region. By component, the market is divided into wavefront sensor, wavefront modulator, and control system. By industry vertical, it is fragmented into astronomy, biomedical, military & defense, industrial & manufacturing, and others (free-space optical communication, sensing, and others). By application, it is categorized into ophthalmology, microscopy, laser application, and others. By region, it is analyzed across North America, Europe, Asia-Pacific, and LAMEA.
The leading players operating in the adaptive optics market are Active Optical Systems LLC, Adaptica, Aka Optics SAS, ALPAO, Baker Adaptive Optics, Benchmark Electronics, Inc., Boston Micromachines Corporation, Edmund Optics Inc., Electro Optic Systems Pty Ltd., Flexible Optical B.V., Imagine Optic, Iris AO, Inc., Northrop Grumman Corporation, Phasics, Synopsys, Inc., Teledyne e2v, and Thorlabs, Inc.
Key Benefits For Stakeholders
- This study presents analytical depiction of the global adaptive optics market analysis along with current trends and future estimations to depict imminent investment pockets.
- The overall adaptive optics market opportunity is determined by understanding profitable trends to gain a stronger foothold.
- The report presents information related to the key drivers, restraints, and opportunities of the global adaptive optics market with a detailed impact analysis.
- The current adaptive optics market is quantitatively analyzed from 2021 to 2031 to benchmark the financial competency.
- Porter's five forces analysis illustrates the potency of the buyers and suppliers in the industry.
Key Market Segments
By Component
- Wavefront Sensor
- Wavefront Modulator
- Control System
By Industry Vertical
- Astronomy
- Biomedical
- Military Defense
- Industrial Manufacturing
- Others
By Application
- Ophthalmology
- Laser Application
- Others
- Microscopy
By Region
- North America
- U.S.
- Canada
- Mexico
- Europe
- UK
- Germany
- France
- Russia
- Italy
- Rest of Europe
- Asia-Pacific
- China
- Japan
- India
- South Korea
- Australia
- Rest of Asia-Pacific
- LAMEA
- Latin America
- Middle East
- Africa
- Key Market Players
- Active optical systems
- Adaptica
- Aka optics SAS
- ALPAO
- Baker Adaptive Optics
- Benchmark Electronics Inc.
- Boston Micromachines Corporation
- Edmund Optics Inc.
- Electro Optic Systems Pty Ltd
- Flexible Optical B.V.
- Imagine Optic
- Iris AO, Inc.
- Northrop Grumman Corporation
- Phasics
- Synopsys, Inc.
- Teledyne e2v
- Thorlabs, Inc.
TABLE OF CONTENTS
CHAPTER 1:INTRODUCTION
- 1.1.Report description
- 1.2.Key market segments
- 1.3.Key benefits to the stakeholders
- 1.4.Research Methodology
- 1.4.1.Secondary research
- 1.4.2.Primary research
- 1.4.3.Analyst tools and models
CHAPTER 2:EXECUTIVE SUMMARY
- 2.1.Key findings of the study
- 2.2.CXO Perspective
CHAPTER 3:MARKET OVERVIEW
- 3.1.Market definition and scope
- 3.2.Key findings
- 3.2.1.Top investment pockets
- 3.3.Porter's five forces analysis
- 3.4.Top player positioning
- 3.5.Market dynamics
- 3.5.1.Drivers
- 3.5.2.Restraints
- 3.5.3.Opportunities
- 3.6.COVID-19 Impact Analysis on the market
CHAPTER 4: ADAPTIVE OPTICS MARKET, BY COMPONENT
- 4.1 Overview
- 4.1.1 Market size and forecast
- 4.2 Wavefront Sensor
- 4.2.1 Key market trends, growth factors and opportunities
- 4.2.2 Market size and forecast, by region
- 4.2.3 Market analysis by country
- 4.3 Wavefront Modulator
- 4.3.1 Key market trends, growth factors and opportunities
- 4.3.2 Market size and forecast, by region
- 4.3.3 Market analysis by country
- 4.4 Control System
- 4.4.1 Key market trends, growth factors and opportunities
- 4.4.2 Market size and forecast, by region
- 4.4.3 Market analysis by country
CHAPTER 5: ADAPTIVE OPTICS MARKET, BY INDUSTRY VERTICAL
- 5.1 Overview
- 5.1.1 Market size and forecast
- 5.2 Astronomy
- 5.2.1 Key market trends, growth factors and opportunities
- 5.2.2 Market size and forecast, by region
- 5.2.3 Market analysis by country
- 5.3 Biomedical
- 5.3.1 Key market trends, growth factors and opportunities
- 5.3.2 Market size and forecast, by region
- 5.3.3 Market analysis by country
- 5.4 Military & Defense
- 5.4.1 Key market trends, growth factors and opportunities
- 5.4.2 Market size and forecast, by region
- 5.4.3 Market analysis by country
- 5.5 Industrial & Manufacturing
- 5.5.1 Key market trends, growth factors and opportunities
- 5.5.2 Market size and forecast, by region
- 5.5.3 Market analysis by country
- 5.6 Others
- 5.6.1 Key market trends, growth factors and opportunities
- 5.6.2 Market size and forecast, by region
- 5.6.3 Market analysis by country
CHAPTER 6: ADAPTIVE OPTICS MARKET, BY APPLICATION
- 6.1 Overview
- 6.1.1 Market size and forecast
- 6.2 Ophthalmology
- 6.2.1 Key market trends, growth factors and opportunities
- 6.2.2 Market size and forecast, by region
- 6.2.3 Market analysis by country
- 6.3 Microscopy
- 6.3.1 Key market trends, growth factors and opportunities
- 6.3.2 Market size and forecast, by region
- 6.3.3 Market analysis by country
- 6.4 Laser Application
- 6.4.1 Key market trends, growth factors and opportunities
- 6.4.2 Market size and forecast, by region
- 6.4.3 Market analysis by country
- 6.5 Others
- 6.5.1 Key market trends, growth factors and opportunities
- 6.5.2 Market size and forecast, by region
- 6.5.3 Market analysis by country
CHAPTER 7: ADAPTIVE OPTICS MARKET, BY REGION
- 7.1 Overview
- 7.1.1 Market size and forecast
- 7.2 North America
- 7.2.1 Key trends and opportunities
- 7.2.2 North America Market size and forecast, by Component
- 7.2.3 North America Market size and forecast, by Industry Vertical
- 7.2.4 North America Market size and forecast, by Application
- 7.2.5 North America Market size and forecast, by country
- 7.2.5.1 U.S.
- 7.2.5.1.1 Market size and forecast, by Component
- 7.2.5.1.2 Market size and forecast, by Industry Vertical
- 7.2.5.1.3 Market size and forecast, by Application
- 7.2.5.2 Canada
- 7.2.5.2.1 Market size and forecast, by Component
- 7.2.5.2.2 Market size and forecast, by Industry Vertical
- 7.2.5.2.3 Market size and forecast, by Application
- 7.2.5.3 Mexico
- 7.2.5.3.1 Market size and forecast, by Component
- 7.2.5.3.2 Market size and forecast, by Industry Vertical
- 7.2.5.3.3 Market size and forecast, by Application
- 7.3 Europe
- 7.3.1 Key trends and opportunities
- 7.3.2 Europe Market size and forecast, by Component
- 7.3.3 Europe Market size and forecast, by Industry Vertical
- 7.3.4 Europe Market size and forecast, by Application
- 7.3.5 Europe Market size and forecast, by country
- 7.3.5.1 UK
- 7.3.5.1.1 Market size and forecast, by Component
- 7.3.5.1.2 Market size and forecast, by Industry Vertical
- 7.3.5.1.3 Market size and forecast, by Application
- 7.3.5.2 Germany
- 7.3.5.2.1 Market size and forecast, by Component
- 7.3.5.2.2 Market size and forecast, by Industry Vertical
- 7.3.5.2.3 Market size and forecast, by Application
- 7.3.5.3 France
- 7.3.5.3.1 Market size and forecast, by Component
- 7.3.5.3.2 Market size and forecast, by Industry Vertical
- 7.3.5.3.3 Market size and forecast, by Application
- 7.3.5.4 Russia
- 7.3.5.4.1 Market size and forecast, by Component
- 7.3.5.4.2 Market size and forecast, by Industry Vertical
- 7.3.5.4.3 Market size and forecast, by Application
- 7.3.5.5 Italy
- 7.3.5.5.1 Market size and forecast, by Component
- 7.3.5.5.2 Market size and forecast, by Industry Vertical
- 7.3.5.5.3 Market size and forecast, by Application
- 7.3.5.6 Rest of Europe
- 7.3.5.6.1 Market size and forecast, by Component
- 7.3.5.6.2 Market size and forecast, by Industry Vertical
- 7.3.5.6.3 Market size and forecast, by Application
- 7.4 Asia-Pacific
- 7.4.1 Key trends and opportunities
- 7.4.2 Asia-Pacific Market size and forecast, by Component
- 7.4.3 Asia-Pacific Market size and forecast, by Industry Vertical
- 7.4.4 Asia-Pacific Market size and forecast, by Application
- 7.4.5 Asia-Pacific Market size and forecast, by country
- 7.4.5.1 China
- 7.4.5.1.1 Market size and forecast, by Component
- 7.4.5.1.2 Market size and forecast, by Industry Vertical
- 7.4.5.1.3 Market size and forecast, by Application
- 7.4.5.2 Japan
- 7.4.5.2.1 Market size and forecast, by Component
- 7.4.5.2.2 Market size and forecast, by Industry Vertical
- 7.4.5.2.3 Market size and forecast, by Application
- 7.4.5.3 India
- 7.4.5.3.1 Market size and forecast, by Component
- 7.4.5.3.2 Market size and forecast, by Industry Vertical
- 7.4.5.3.3 Market size and forecast, by Application
- 7.4.5.4 South Korea
- 7.4.5.4.1 Market size and forecast, by Component
- 7.4.5.4.2 Market size and forecast, by Industry Vertical
- 7.4.5.4.3 Market size and forecast, by Application
- 7.4.5.5 Australia
- 7.4.5.5.1 Market size and forecast, by Component
- 7.4.5.5.2 Market size and forecast, by Industry Vertical
- 7.4.5.5.3 Market size and forecast, by Application
- 7.4.5.6 Rest of Asia-Pacific
- 7.4.5.6.1 Market size and forecast, by Component
- 7.4.5.6.2 Market size and forecast, by Industry Vertical
- 7.4.5.6.3 Market size and forecast, by Application
- 7.5 LAMEA
- 7.5.1 Key trends and opportunities
- 7.5.2 LAMEA Market size and forecast, by Component
- 7.5.3 LAMEA Market size and forecast, by Industry Vertical
- 7.5.4 LAMEA Market size and forecast, by Application
- 7.5.5 LAMEA Market size and forecast, by country
- 7.5.5.1 Latin America
- 7.5.5.1.1 Market size and forecast, by Component
- 7.5.5.1.2 Market size and forecast, by Industry Vertical
- 7.5.5.1.3 Market size and forecast, by Application
- 7.5.5.2 Middle East
- 7.5.5.2.1 Market size and forecast, by Component
- 7.5.5.2.2 Market size and forecast, by Industry Vertical
- 7.5.5.2.3 Market size and forecast, by Application
- 7.5.5.3 Africa
- 7.5.5.3.1 Market size and forecast, by Component
- 7.5.5.3.2 Market size and forecast, by Industry Vertical
- 7.5.5.3.3 Market size and forecast, by Application
CHAPTER 8: COMPANY LANDSCAPE
- 8.1. Introduction
- 8.2. Top winning strategies
- 8.3. Product Mapping of Top 10 Player
- 8.4. Competitive Dashboard
- 8.5. Competitive Heatmap
- 8.6. Key developments
CHAPTER 9: COMPANY PROFILES
- 9.1 Active optical systems
- 9.1.1 Company overview
- 9.1.2 Company snapshot
- 9.1.3 Operating business segments
- 9.1.4 Product portfolio
- 9.1.5 Business performance
- 9.1.6 Key strategic moves and developments
- 9.2 Adaptica
- 9.2.1 Company overview
- 9.2.2 Company snapshot
- 9.2.3 Operating business segments
- 9.2.4 Product portfolio
- 9.2.5 Business performance
- 9.2.6 Key strategic moves and developments
- 9.3 Aka optics SAS
- 9.3.1 Company overview
- 9.3.2 Company snapshot
- 9.3.3 Operating business segments
- 9.3.4 Product portfolio
- 9.3.5 Business performance
- 9.3.6 Key strategic moves and developments
- 9.4 ALPAO
- 9.4.1 Company overview
- 9.4.2 Company snapshot
- 9.4.3 Operating business segments
- 9.4.4 Product portfolio
- 9.4.5 Business performance
- 9.4.6 Key strategic moves and developments
- 9.5 Baker Adaptive Optics
- 9.5.1 Company overview
- 9.5.2 Company snapshot
- 9.5.3 Operating business segments
- 9.5.4 Product portfolio
- 9.5.5 Business performance
- 9.5.6 Key strategic moves and developments
- 9.6 Benchmark Electronics Inc.
- 9.6.1 Company overview
- 9.6.2 Company snapshot
- 9.6.3 Operating business segments
- 9.6.4 Product portfolio
- 9.6.5 Business performance
- 9.6.6 Key strategic moves and developments
- 9.7 Boston Micromachines Corporation
- 9.7.1 Company overview
- 9.7.2 Company snapshot
- 9.7.3 Operating business segments
- 9.7.4 Product portfolio
- 9.7.5 Business performance
- 9.7.6 Key strategic moves and developments
- 9.8 Edmund Optics Inc.
- 9.8.1 Company overview
- 9.8.2 Company snapshot
- 9.8.3 Operating business segments
- 9.8.4 Product portfolio
- 9.8.5 Business performance
- 9.8.6 Key strategic moves and developments
- 9.9 Electro Optic Systems Pty Ltd
- 9.9.1 Company overview
- 9.9.2 Company snapshot
- 9.9.3 Operating business segments
- 9.9.4 Product portfolio
- 9.9.5 Business performance
- 9.9.6 Key strategic moves and developments
- 9.10 Flexible Optical B.V.
- 9.10.1 Company overview
- 9.10.2 Company snapshot
- 9.10.3 Operating business segments
- 9.10.4 Product portfolio
- 9.10.5 Business performance
- 9.10.6 Key strategic moves and developments
- 9.11 Imagine Optic
- 9.11.1 Company overview
- 9.11.2 Company snapshot
- 9.11.3 Operating business segments
- 9.11.4 Product portfolio
- 9.11.5 Business performance
- 9.11.6 Key strategic moves and developments
- 9.12 Iris AO, Inc.
- 9.12.1 Company overview
- 9.12.2 Company snapshot
- 9.12.3 Operating business segments
- 9.12.4 Product portfolio
- 9.12.5 Business performance
- 9.12.6 Key strategic moves and developments
- 9.13 Northrop Grumman Corporation
- 9.13.1 Company overview
- 9.13.2 Company snapshot
- 9.13.3 Operating business segments
- 9.13.4 Product portfolio
- 9.13.5 Business performance
- 9.13.6 Key strategic moves and developments
- 9.14 Phasics
- 9.14.1 Company overview
- 9.14.2 Company snapshot
- 9.14.3 Operating business segments
- 9.14.4 Product portfolio
- 9.14.5 Business performance
- 9.14.6 Key strategic moves and developments
- 9.15 Synopsys, Inc.
- 9.15.1 Company overview
- 9.15.2 Company snapshot
- 9.15.3 Operating business segments
- 9.15.4 Product portfolio
- 9.15.5 Business performance
- 9.15.6 Key strategic moves and developments
- 9.16 Teledyne e2v
- 9.16.1 Company overview
- 9.16.2 Company snapshot
- 9.16.3 Operating business segments
- 9.16.4 Product portfolio
- 9.16.5 Business performance
- 9.16.6 Key strategic moves and developments
- 9.17 Thorlabs, Inc.
- 9.17.1 Company overview
- 9.17.2 Company snapshot
- 9.17.3 Operating business segments
- 9.17.4 Product portfolio
- 9.17.5 Business performance
- 9.17.6 Key strategic moves and developments