|
|
市場調査レポート
商品コード
1108585
海洋発電の世界市場 - タイプ別、用途別:機会分析と業界予測(2021年~2031年)Ocean Power Market By Type (Tidal Barrages, Tidal Stream, Wave Energy, Others), By Application (Power Generation, Desalination, Water Pumping): Global Opportunity Analysis and Industry Forecast, 2021-2031 |
||||||
|
|
|||||||


| 海洋発電の世界市場 - タイプ別、用途別:機会分析と業界予測(2021年~2031年) |
|
出版日: 2022年05月01日
発行: Allied Market Research
ページ情報: 英文 200 Pages
納期: 2~3営業日
|
- 全表示
- 概要
- 図表
- 目次
世界の海洋発電の市場規模は、2021年の6億米ドルから2031年までに78億米ドルに達し、2022年~2031年にCAGRで21.4%の成長が予測されています。
当レポートでは、世界の海洋発電市場について調査分析し、市場動向、セグメント分析、地域分析、企業情勢などを提供しています。
目次
第1章 イントロダクション
第2章 エグゼクティブサマリー
第3章 市場の概要
- 市場の定義と範囲
- 主な調査結果
- 主な投資ポケット
- ポーターのファイブフォース分析
- 主要企業のポジショニング
- 市場力学
- 促進要因
- 抑制要因
- 機会
- 市場に対するCOVID-19の影響の分析
- バリューチェーン分析
- 特許情勢
第4章 海洋発電市場:タイプ別
- 概要
- 市場規模と予測
- 潮のダム
- 主要な市場動向、成長要因と機会
- 市場規模と予測:地域別
- 市場分析:国別
- 潮流
- 主要な市場動向、成長要因と機会
- 市場規模と予測:地域別
- 市場分析:国別
- 波のエネルギー
- 主要な市場動向、成長要因と機会
- 市場規模と予測:地域別
- 市場分析:国別
- その他
- 主要な市場動向、成長要因と機会
- 市場規模と予測:地域別
- 市場分析:国別
第5章 海洋発電市場:用途別
- 概要
- 市場規模と予測
- 発電
- 主要な市場動向、成長要因と機会
- 市場規模と予測:地域別
- 市場分析:国別
- 脱塩
- 主要な市場動向、成長要因と機会
- 市場規模と予測:地域別
- 市場分析:国別
- 揚水
- 主要な市場動向、成長要因と機会
- 市場規模と予測:地域別
- 市場分析:国別
第6章 海洋発電市場:地域別
- 概要
- 市場規模と予測
- 北米
- 欧州
- アジア太平洋
- ラテンアメリカ・中東・アフリカ
第7章 企業情勢
- イントロダクション
- 主な成功戦略
- 主要10社の製品マッピング
- 競合ダッシュボード
- 競合ヒートマップ
- 主な発展
第8章 企業プロファイル
- Applied Technologies Company, Ltd.
- Aqua-Magnetics, Inc.
- Atargis Energy Corporation
- Biopower Systems Pty Ltd.
- Blue Energy Canada, Inc.
- Carnegie Clean Energy Limited
- Minesto AB
- Nova Innovation Ltd.
- Ocean Power Technologies, Inc.
- Ocean Renewable Power Company LLC
LIST OF TABLES
- TABLE 1. GLOBAL OCEAN POWER MARKET, BY TYPE, 2021-2031,($MILLION)
- TABLE 2. OCEAN POWER MARKET REVENUE, FOR TIDAL BARRAGES, BY REGION , 2021-2031,($MILLION)
- TABLE 3. OCEAN POWER MARKET FOR TIDAL BARRAGES BY COUNTRY, 2021-2031,($MILLION)
- TABLE 4. OCEAN POWER MARKET REVENUE, FOR TIDAL STREAM, BY REGION , 2021-2031,($MILLION)
- TABLE 5. OCEAN POWER MARKET FOR TIDAL STREAM BY COUNTRY, 2021-2031,($MILLION)
- TABLE 6. OCEAN POWER MARKET REVENUE, FOR WAVE ENERGY, BY REGION , 2021-2031,($MILLION)
- TABLE 7. OCEAN POWER MARKET FOR WAVE ENERGY BY COUNTRY, 2021-2031,($MILLION)
- TABLE 8. OCEAN POWER MARKET REVENUE, FOR OTHERS, BY REGION , 2021-2031,($MILLION)
- TABLE 9. OCEAN POWER MARKET FOR OTHERS BY COUNTRY, 2021-2031,($MILLION)
- TABLE 10. GLOBAL OCEAN POWER MARKET, BY APPLICATION, 2021-2031,($MILLION)
- TABLE 11. OCEAN POWER MARKET REVENUE, FOR POWER GENERATION, BY REGION , 2021-2031,($MILLION)
- TABLE 12. OCEAN POWER MARKET FOR POWER GENERATION BY COUNTRY, 2021-2031,($MILLION)
- TABLE 13. OCEAN POWER MARKET REVENUE, FOR DESALINATION, BY REGION , 2021-2031,($MILLION)
- TABLE 14. OCEAN POWER MARKET FOR DESALINATION BY COUNTRY, 2021-2031,($MILLION)
- TABLE 15. OCEAN POWER MARKET REVENUE, FOR WATER PUMPING, BY REGION , 2021-2031,($MILLION)
- TABLE 16. OCEAN POWER MARKET FOR WATER PUMPING BY COUNTRY, 2021-2031,($MILLION)
- TABLE 17. OCEAN POWER MARKET, BY REGION, 2021-2031,($MILLION)
- TABLE 18. NORTH AMERICA OCEAN POWER MARKET, BY TYPE, 2021-2031,($MILLION)
- TABLE 19. NORTH AMERICA OCEAN POWER MARKET, BY APPLICATION, 2021-2031,($MILLION)
- TABLE 20. NORTH AMERICA OCEAN POWER MARKET, BY COUNTRY, 2021-2031,($MILLION)
- TABLE 21. U.S. OCEAN POWER MARKET, BY TYPE, 2021-2031,($MILLION)
- TABLE 22. U.S. OCEAN POWER MARKET, BY APPLICATION, 2021-2031,($MILLION)
- TABLE 23. CANADA OCEAN POWER MARKET, BY TYPE, 2021-2031,($MILLION)
- TABLE 24. CANADA OCEAN POWER MARKET, BY APPLICATION, 2021-2031,($MILLION)
- TABLE 25. MEXICO OCEAN POWER MARKET, BY TYPE, 2021-2031,($MILLION)
- TABLE 26. MEXICO OCEAN POWER MARKET, BY APPLICATION, 2021-2031,($MILLION)
- TABLE 27. EUROPE OCEAN POWER MARKET, BY TYPE, 2021-2031,($MILLION)
- TABLE 28. EUROPE OCEAN POWER MARKET, BY APPLICATION, 2021-2031,($MILLION)
- TABLE 29. EUROPE OCEAN POWER MARKET, BY COUNTRY, 2021-2031,($MILLION)
- TABLE 30. GERMANY OCEAN POWER MARKET, BY TYPE, 2021-2031,($MILLION)
- TABLE 31. GERMANY OCEAN POWER MARKET, BY APPLICATION, 2021-2031,($MILLION)
- TABLE 32. FRANCE OCEAN POWER MARKET, BY TYPE, 2021-2031,($MILLION)
- TABLE 33. FRANCE OCEAN POWER MARKET, BY APPLICATION, 2021-2031,($MILLION)
- TABLE 34. U.K. OCEAN POWER MARKET, BY TYPE, 2021-2031,($MILLION)
- TABLE 35. U.K. OCEAN POWER MARKET, BY APPLICATION, 2021-2031,($MILLION)
- TABLE 36. ITALY OCEAN POWER MARKET, BY TYPE, 2021-2031,($MILLION)
- TABLE 37. ITALY OCEAN POWER MARKET, BY APPLICATION, 2021-2031,($MILLION)
- TABLE 38. SPAIN OCEAN POWER MARKET, BY TYPE, 2021-2031,($MILLION)
- TABLE 39. SPAIN OCEAN POWER MARKET, BY APPLICATION, 2021-2031,($MILLION)
- TABLE 40. RUSSIA OCEAN POWER MARKET, BY TYPE, 2021-2031,($MILLION)
- TABLE 41. RUSSIA OCEAN POWER MARKET, BY APPLICATION, 2021-2031,($MILLION)
- TABLE 42. REST OF EUROPE OCEAN POWER MARKET, BY TYPE, 2021-2031,($MILLION)
- TABLE 43. REST OF EUROPE OCEAN POWER MARKET, BY APPLICATION, 2021-2031,($MILLION)
- TABLE 44. ASIA-PACIFIC OCEAN POWER MARKET, BY TYPE, 2021-2031,($MILLION)
- TABLE 45. ASIA-PACIFIC OCEAN POWER MARKET, BY APPLICATION, 2021-2031,($MILLION)
- TABLE 46. ASIA-PACIFIC OCEAN POWER MARKET, BY COUNTRY, 2021-2031,($MILLION)
- TABLE 47. CHINA OCEAN POWER MARKET, BY TYPE, 2021-2031,($MILLION)
- TABLE 48. CHINA OCEAN POWER MARKET, BY APPLICATION, 2021-2031,($MILLION)
- TABLE 49. JAPAN OCEAN POWER MARKET, BY TYPE, 2021-2031,($MILLION)
- TABLE 50. JAPAN OCEAN POWER MARKET, BY APPLICATION, 2021-2031,($MILLION)
- TABLE 51. INDIA OCEAN POWER MARKET, BY TYPE, 2021-2031,($MILLION)
- TABLE 52. INDIA OCEAN POWER MARKET, BY APPLICATION, 2021-2031,($MILLION)
- TABLE 53. SOUTH KOREA OCEAN POWER MARKET, BY TYPE, 2021-2031,($MILLION)
- TABLE 54. SOUTH KOREA OCEAN POWER MARKET, BY APPLICATION, 2021-2031,($MILLION)
- TABLE 55. AUSTRALIA OCEAN POWER MARKET, BY TYPE, 2021-2031,($MILLION)
- TABLE 56. AUSTRALIA OCEAN POWER MARKET, BY APPLICATION, 2021-2031,($MILLION)
- TABLE 57. REST OF ASIA PACIFIC OCEAN POWER MARKET, BY TYPE, 2021-2031,($MILLION)
- TABLE 58. REST OF ASIA PACIFIC OCEAN POWER MARKET, BY APPLICATION, 2021-2031,($MILLION)
- TABLE 59. LAMEA OCEAN POWER MARKET, BY TYPE, 2021-2031,($MILLION)
- TABLE 60. LAMEA OCEAN POWER MARKET, BY APPLICATION, 2021-2031,($MILLION)
- TABLE 61. LAMEA OCEAN POWER MARKET, BY COUNTRY, 2021-2031,($MILLION)
- TABLE 62. BRAZIL OCEAN POWER MARKET, BY TYPE, 2021-2031,($MILLION)
- TABLE 63. BRAZIL OCEAN POWER MARKET, BY APPLICATION, 2021-2031,($MILLION)
- TABLE 64. SAUDI ARABIA OCEAN POWER MARKET, BY TYPE, 2021-2031,($MILLION)
- TABLE 65. SAUDI ARABIA OCEAN POWER MARKET, BY APPLICATION, 2021-2031,($MILLION)
- TABLE 66. SOUTH AFRICA OCEAN POWER MARKET, BY TYPE, 2021-2031,($MILLION)
- TABLE 67. SOUTH AFRICA OCEAN POWER MARKET, BY APPLICATION, 2021-2031,($MILLION)
- TABLE 68. REST OF LAMEA OCEAN POWER MARKET, BY TYPE, 2021-2031,($MILLION)
- TABLE 69. REST OF LAMEA OCEAN POWER MARKET, BY APPLICATION, 2021-2031,($MILLION)
- TABLE 70.APPLIED TECHNOLOGIES COMPANY, LTD.: COMPANY SNAPSHOT
- TABLE 71.APPLIED TECHNOLOGIES COMPANY, LTD.: OPERATING SEGMENTS
- TABLE 72.APPLIED TECHNOLOGIES COMPANY, LTD.: PRODUCT PORTFOLIO
- TABLE 73.APPLIED TECHNOLOGIES COMPANY, LTD.: NET SALES,
- TABLE 74.APPLIED TECHNOLOGIES COMPANY, LTD.: KEY STRATERGIES
- TABLE 75.AQUA-MAGNETICS, INC.: COMPANY SNAPSHOT
- TABLE 76.AQUA-MAGNETICS, INC.: OPERATING SEGMENTS
- TABLE 77.AQUA-MAGNETICS, INC.: PRODUCT PORTFOLIO
- TABLE 78.AQUA-MAGNETICS, INC.: NET SALES,
- TABLE 79.AQUA-MAGNETICS, INC.: KEY STRATERGIES
- TABLE 80.ATARGIS ENERGY CORPORATION: COMPANY SNAPSHOT
- TABLE 81.ATARGIS ENERGY CORPORATION: OPERATING SEGMENTS
- TABLE 82.ATARGIS ENERGY CORPORATION: PRODUCT PORTFOLIO
- TABLE 83.ATARGIS ENERGY CORPORATION: NET SALES,
- TABLE 84.ATARGIS ENERGY CORPORATION: KEY STRATERGIES
- TABLE 85.BIOPOWER SYSTEMS PTY LTD.: COMPANY SNAPSHOT
- TABLE 86.BIOPOWER SYSTEMS PTY LTD.: OPERATING SEGMENTS
- TABLE 87.BIOPOWER SYSTEMS PTY LTD.: PRODUCT PORTFOLIO
- TABLE 88.BIOPOWER SYSTEMS PTY LTD.: NET SALES,
- TABLE 89.BIOPOWER SYSTEMS PTY LTD.: KEY STRATERGIES
- TABLE 90.BLUE ENERGY CANADA, INC.: COMPANY SNAPSHOT
- TABLE 91.BLUE ENERGY CANADA, INC.: OPERATING SEGMENTS
- TABLE 92.BLUE ENERGY CANADA, INC.: PRODUCT PORTFOLIO
- TABLE 93.BLUE ENERGY CANADA, INC.: NET SALES,
- TABLE 94.BLUE ENERGY CANADA, INC.: KEY STRATERGIES
- TABLE 95.CARNEGIE CLEAN ENERGY LIMITED: COMPANY SNAPSHOT
- TABLE 96.CARNEGIE CLEAN ENERGY LIMITED: OPERATING SEGMENTS
- TABLE 97.CARNEGIE CLEAN ENERGY LIMITED: PRODUCT PORTFOLIO
- TABLE 98.CARNEGIE CLEAN ENERGY LIMITED: NET SALES,
- TABLE 99.CARNEGIE CLEAN ENERGY LIMITED: KEY STRATERGIES
- TABLE 100.MINESTO AB: COMPANY SNAPSHOT
- TABLE 101.MINESTO AB: OPERATING SEGMENTS
- TABLE 102.MINESTO AB: PRODUCT PORTFOLIO
- TABLE 103.MINESTO AB: NET SALES,
- TABLE 104.MINESTO AB: KEY STRATERGIES
- TABLE 105.NOVA INNOVATION LTD.: COMPANY SNAPSHOT
- TABLE 106.NOVA INNOVATION LTD.: OPERATING SEGMENTS
- TABLE 107.NOVA INNOVATION LTD.: PRODUCT PORTFOLIO
- TABLE 108.NOVA INNOVATION LTD.: NET SALES,
- TABLE 109.NOVA INNOVATION LTD.: KEY STRATERGIES
- TABLE 110.OCEAN POWER TECHNOLOGIES, INC.: COMPANY SNAPSHOT
- TABLE 111.OCEAN POWER TECHNOLOGIES, INC.: OPERATING SEGMENTS
- TABLE 112.OCEAN POWER TECHNOLOGIES, INC.: PRODUCT PORTFOLIO
- TABLE 113.OCEAN POWER TECHNOLOGIES, INC.: NET SALES,
- TABLE 114.OCEAN POWER TECHNOLOGIES, INC.: KEY STRATERGIES
- TABLE 115.OCEAN RENEWABLE POWER COMPANY LLC: COMPANY SNAPSHOT
- TABLE 116.OCEAN RENEWABLE POWER COMPANY LLC: OPERATING SEGMENTS
- TABLE 117.OCEAN RENEWABLE POWER COMPANY LLC: PRODUCT PORTFOLIO
- TABLE 118.OCEAN RENEWABLE POWER COMPANY LLC: NET SALES,
- TABLE 119.OCEAN RENEWABLE POWER COMPANY LLC: KEY STRATERGIES
LIST OF FIGURES
- FIGURE 1.OCEAN POWER MARKET SEGMENTATION
- FIGURE 2.OCEAN POWER MARKET,2021-2031
- FIGURE 3.OCEAN POWER MARKET,2021-2031
- FIGURE 4. TOP INVESTMENT POCKETS, BY REGION
- FIGURE 5.PORTER FIVE-1
- FIGURE 6.PORTER FIVE-2
- FIGURE 7.PORTER FIVE-3
- FIGURE 8.PORTER FIVE-4
- FIGURE 9.PORTER FIVE-5
- FIGURE 10.TOP PLAYER POSITIONING
- FIGURE 11.OCEAN POWER MARKET:DRIVERS, RESTRAINTS AND OPPORTUNITIES
- FIGURE 12.VALUE CHAIN ANALYSIS
- FIGURE 13.PATENT ANALYSIS BY COMPANY
- FIGURE 14.PATENT ANALYSIS BY COUNTRY
- FIGURE 15.OCEAN POWER MARKET,BY TYPE,2021(%)
- FIGURE 16.COMPARATIVE SHARE ANALYSIS OF TIDAL BARRAGES OCEAN POWER MARKET,2021-2031(%)
- FIGURE 17.COMPARATIVE SHARE ANALYSIS OF TIDAL STREAM OCEAN POWER MARKET,2021-2031(%)
- FIGURE 18.COMPARATIVE SHARE ANALYSIS OF WAVE ENERGY OCEAN POWER MARKET,2021-2031(%)
- FIGURE 19.COMPARATIVE SHARE ANALYSIS OF OTHERS OCEAN POWER MARKET,2021-2031(%)
- FIGURE 20.OCEAN POWER MARKET,BY APPLICATION,2021(%)
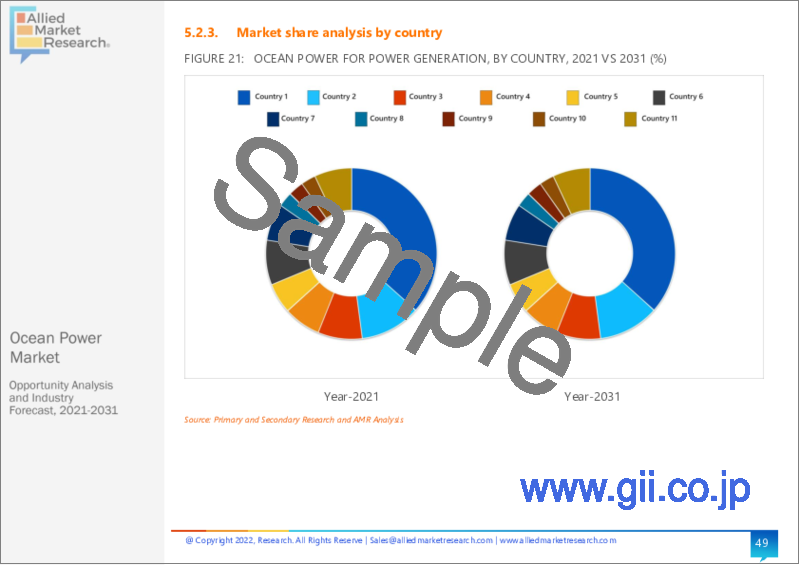
- FIGURE 21.COMPARATIVE SHARE ANALYSIS OF POWER GENERATION OCEAN POWER MARKET,2021-2031(%)
- FIGURE 22.COMPARATIVE SHARE ANALYSIS OF DESALINATION OCEAN POWER MARKET,2021-2031(%)
- FIGURE 23.COMPARATIVE SHARE ANALYSIS OF WATER PUMPING OCEAN POWER MARKET,2021-2031(%)
- FIGURE 24.OCEAN POWER MARKET BY REGION,2021
- FIGURE 25.U.S. OCEAN POWER MARKET,2021-2031($MILLION)
- FIGURE 26.CANADA OCEAN POWER MARKET,2021-2031($MILLION)
- FIGURE 27.MEXICO OCEAN POWER MARKET,2021-2031($MILLION)
- FIGURE 28.GERMANY OCEAN POWER MARKET,2021-2031($MILLION)
- FIGURE 29.FRANCE OCEAN POWER MARKET,2021-2031($MILLION)
- FIGURE 30.U.K. OCEAN POWER MARKET,2021-2031($MILLION)
- FIGURE 31.ITALY OCEAN POWER MARKET,2021-2031($MILLION)
- FIGURE 32.SPAIN OCEAN POWER MARKET,2021-2031($MILLION)
- FIGURE 33.RUSSIA OCEAN POWER MARKET,2021-2031($MILLION)
- FIGURE 34.REST OF EUROPE OCEAN POWER MARKET,2021-2031($MILLION)
- FIGURE 35.CHINA OCEAN POWER MARKET,2021-2031($MILLION)
- FIGURE 36.JAPAN OCEAN POWER MARKET,2021-2031($MILLION)
- FIGURE 37.INDIA OCEAN POWER MARKET,2021-2031($MILLION)
- FIGURE 38.SOUTH KOREA OCEAN POWER MARKET,2021-2031($MILLION)
- FIGURE 39.AUSTRALIA OCEAN POWER MARKET,2021-2031($MILLION)
- FIGURE 40.REST OF ASIA PACIFIC OCEAN POWER MARKET,2021-2031($MILLION)
- FIGURE 41.BRAZIL OCEAN POWER MARKET,2021-2031($MILLION)
- FIGURE 42.SAUDI ARABIA OCEAN POWER MARKET,2021-2031($MILLION)
- FIGURE 43.SOUTH AFRICA OCEAN POWER MARKET,2021-2031($MILLION)
- FIGURE 44.REST OF LAMEA OCEAN POWER MARKET,2021-2031($MILLION)
- FIGURE 45. TOP WINNING STRATEGIES, BY YEAR
- FIGURE 46. TOP WINNING STRATEGIES, BY DEVELOPMENT
- FIGURE 47. TOP WINNING STRATEGIES, BY COMPANY
- FIGURE 48.PRODUCT MAPPING OF TOP 10 PLAYERS
- FIGURE 49.COMPETITIVE DASHBOARD
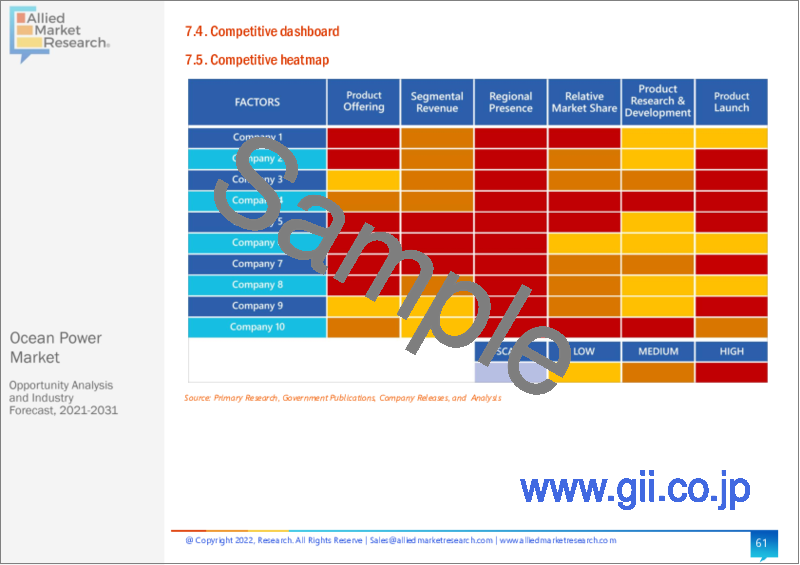
- FIGURE 50.COMPETITIVE HEATMAP OF TOP 10 KEY PLAYERS
- FIGURE 51.APPLIED TECHNOLOGIES COMPANY, LTD..: NET SALES ,($MILLION)
- FIGURE 52.AQUA-MAGNETICS, INC..: NET SALES ,($MILLION)
- FIGURE 53.ATARGIS ENERGY CORPORATION.: NET SALES ,($MILLION)
- FIGURE 54.BIOPOWER SYSTEMS PTY LTD..: NET SALES ,($MILLION)
- FIGURE 55.BLUE ENERGY CANADA, INC..: NET SALES ,($MILLION)
- FIGURE 56.CARNEGIE CLEAN ENERGY LIMITED.: NET SALES ,($MILLION)
- FIGURE 57.MINESTO AB.: NET SALES ,($MILLION)
- FIGURE 58.NOVA INNOVATION LTD..: NET SALES ,($MILLION)
- FIGURE 59.OCEAN POWER TECHNOLOGIES, INC..: NET SALES ,($MILLION)
- FIGURE 60.OCEAN RENEWABLE POWER COMPANY LLC.: NET SALES ,($MILLION)
The global ocean power market was valued at $0.6 billion in 2021, and is projected to reach $7.8 billion by 2031, growing at a CAGR of 21.4% from 2022 to 2031.
Ocean power is a type of renewable energy, which is derived from all form of resources from sea. Ocean power finds application in water desalination, power generation, heating, water pumping, and other applications. It is one of the largest renewable contributors for power generation applications in coastal communities. Sources of ocean power production includes tidal stream, wave energy, ocean thermal energy conversion, tidal barrages, and others. Ocean power technologies such as wave energy and tidal stream are developing at a significant rate, which further opens up more revenue generation from these technologies.
Rapid growth of the renewable energy industry, owing to rise in investments and awareness toward benefits of renewable energy in developing economies significantly contribute toward growth of the global ocean power market. However, high initial cost associated with installation of tidal power plants is expected to hamper growth of the ocean power market, globally from 2022 to 2031. Conversely, rise in investments toward R&D of ocean power technologies for commercialization at a significant pace is expected to create potential growth opportunities for key players operating in this market in the upcoming years. The global ocean power market is segmented on the basis of type, application, and region. Depending on type, the market is divided into tidal barrages, tidal stream, wave energy, and others. On the basis of application, it is categorized into power generation, water desalination, and water pumping. Region wise, it is analyzed across North America, Europe, Asia-Pacific, and LAMEA.
KEY BENEFITS FOR STAKEHOLDERS
- The report includes in-depth analysis of different segments and provides market estimations between 2021 and 2031.
- A comprehensive analysis of the factors that drive and restrict the growth of the global ocean power market is provided.
- Porter's five forces model illustrates the potency of buyers & sellers, which is estimated to assist the market players to adopt effective strategies.
- Estimations and forecast are based on factors impacting the global ocean power market growth, in terms of value.
- Key market players are profiled to gain an understanding of the strategies adopted by them.
- This report provides a detailed analysis of the current global ocean power market trends and future estimations from 2021 to 2030, which helps identify the prevailing market opportunities.
Key Market Segments
By Type
- Tidal Barrages
- Tidal Stream
- Wave Energy
- Others
By Application
- Power Generation
- Desalination
- Water Pumping
By Region
- North America
- U.S.
- Canada
- Mexico
- Europe
- Germany
- France
- U.K.
- Italy
- Spain
- Russia
- Rest of Europe
- Asia-Pacific
- China
- Japan
- India
- South Korea
- Australia
- Rest Of Asia Pacific
- LAMEA
- Brazil
- Saudi Arabia
- South Africa
- Rest of LAMEA
- Key Market Players
- Applied Technologies Company, Ltd.
- Aqua-Magnetics, Inc.
- Atargis Energy Corporation
- Biopower Systems Pty Ltd.
- Blue Energy Canada, Inc.
- Carnegie Clean Energy Limited
- Minesto AB
- Nova Innovation Ltd.
- Ocean Power Technologies, Inc.
- Ocean Renewable Power Company LLC
TABLE OF CONTENTS
CHAPTER 1:INTRODUCTION
- 1.1.Report description
- 1.2.Key market segments
- 1.3.Key benefits to the stakeholders
- 1.4.Research Methodology
- 1.4.1.Secondary research
- 1.4.2.Primary research
- 1.4.3.Analyst tools and models
CHAPTER 2:EXECUTIVE SUMMARY
- 2.1.Key findings of the study
- 2.2.CXO Perspective
CHAPTER 3:MARKET OVERVIEW
- 3.1.Market definition and scope
- 3.2.Key findings
- 3.2.1.Top investment pockets
- 3.3.Porter's five forces analysis
- 3.4.Top player positioning
- 3.5.Market dynamics
- 3.5.1.Drivers
- 3.5.2.Restraints
- 3.5.3.Opportunities
- 3.6.COVID-19 Impact Analysis on the market
- 3.7.Value Chain Analysis
- 3.8.Patent Landscape
CHAPTER 4: OCEAN POWER MARKET, BY TYPE
- 4.1 Overview
- 4.1.1 Market size and forecast
- 4.2 Tidal Barrages
- 4.2.1 Key market trends, growth factors and opportunities
- 4.2.2 Market size and forecast, by region
- 4.2.3 Market analysis by country
- 4.3 Tidal Stream
- 4.3.1 Key market trends, growth factors and opportunities
- 4.3.2 Market size and forecast, by region
- 4.3.3 Market analysis by country
- 4.4 Wave Energy
- 4.4.1 Key market trends, growth factors and opportunities
- 4.4.2 Market size and forecast, by region
- 4.4.3 Market analysis by country
- 4.5 Others
- 4.5.1 Key market trends, growth factors and opportunities
- 4.5.2 Market size and forecast, by region
- 4.5.3 Market analysis by country
CHAPTER 5: OCEAN POWER MARKET, BY APPLICATION
- 5.1 Overview
- 5.1.1 Market size and forecast
- 5.2 Power Generation
- 5.2.1 Key market trends, growth factors and opportunities
- 5.2.2 Market size and forecast, by region
- 5.2.3 Market analysis by country
- 5.3 Desalination
- 5.3.1 Key market trends, growth factors and opportunities
- 5.3.2 Market size and forecast, by region
- 5.3.3 Market analysis by country
- 5.4 Water Pumping
- 5.4.1 Key market trends, growth factors and opportunities
- 5.4.2 Market size and forecast, by region
- 5.4.3 Market analysis by country
CHAPTER 6: OCEAN POWER MARKET, BY REGION
- 6.1 Overview
- 6.1.1 Market size and forecast
- 6.2 North America
- 6.2.1 Key trends and opportunities
- 6.2.2 North America Market size and forecast, by Type
- 6.2.3 North America Market size and forecast, by Application
- 6.2.4 North America Market size and forecast, by country
- 6.2.4.1 U.S.
- 6.2.4.1.1 Market size and forecast, by Type
- 6.2.4.1.2 Market size and forecast, by Application
- 6.2.4.2 Canada
- 6.2.4.2.1 Market size and forecast, by Type
- 6.2.4.2.2 Market size and forecast, by Application
- 6.2.4.3 Mexico
- 6.2.4.3.1 Market size and forecast, by Type
- 6.2.4.3.2 Market size and forecast, by Application
- 6.3 Europe
- 6.3.1 Key trends and opportunities
- 6.3.2 Europe Market size and forecast, by Type
- 6.3.3 Europe Market size and forecast, by Application
- 6.3.4 Europe Market size and forecast, by country
- 6.3.4.1 Germany
- 6.3.4.1.1 Market size and forecast, by Type
- 6.3.4.1.2 Market size and forecast, by Application
- 6.3.4.2 France
- 6.3.4.2.1 Market size and forecast, by Type
- 6.3.4.2.2 Market size and forecast, by Application
- 6.3.4.3 U.K.
- 6.3.4.3.1 Market size and forecast, by Type
- 6.3.4.3.2 Market size and forecast, by Application
- 6.3.4.4 Italy
- 6.3.4.4.1 Market size and forecast, by Type
- 6.3.4.4.2 Market size and forecast, by Application
- 6.3.4.5 Spain
- 6.3.4.5.1 Market size and forecast, by Type
- 6.3.4.5.2 Market size and forecast, by Application
- 6.3.4.6 Russia
- 6.3.4.6.1 Market size and forecast, by Type
- 6.3.4.6.2 Market size and forecast, by Application
- 6.3.4.7 Rest of Europe
- 6.3.4.7.1 Market size and forecast, by Type
- 6.3.4.7.2 Market size and forecast, by Application
- 6.4 Asia-Pacific
- 6.4.1 Key trends and opportunities
- 6.4.2 Asia-Pacific Market size and forecast, by Type
- 6.4.3 Asia-Pacific Market size and forecast, by Application
- 6.4.4 Asia-Pacific Market size and forecast, by country
- 6.4.4.1 China
- 6.4.4.1.1 Market size and forecast, by Type
- 6.4.4.1.2 Market size and forecast, by Application
- 6.4.4.2 Japan
- 6.4.4.2.1 Market size and forecast, by Type
- 6.4.4.2.2 Market size and forecast, by Application
- 6.4.4.3 India
- 6.4.4.3.1 Market size and forecast, by Type
- 6.4.4.3.2 Market size and forecast, by Application
- 6.4.4.4 South Korea
- 6.4.4.4.1 Market size and forecast, by Type
- 6.4.4.4.2 Market size and forecast, by Application
- 6.4.4.5 Australia
- 6.4.4.5.1 Market size and forecast, by Type
- 6.4.4.5.2 Market size and forecast, by Application
- 6.4.4.6 Rest Of Asia Pacific
- 6.4.4.6.1 Market size and forecast, by Type
- 6.4.4.6.2 Market size and forecast, by Application
- 6.5 LAMEA
- 6.5.1 Key trends and opportunities
- 6.5.2 LAMEA Market size and forecast, by Type
- 6.5.3 LAMEA Market size and forecast, by Application
- 6.5.4 LAMEA Market size and forecast, by country
- 6.5.4.1 Brazil
- 6.5.4.1.1 Market size and forecast, by Type
- 6.5.4.1.2 Market size and forecast, by Application
- 6.5.4.2 Saudi Arabia
- 6.5.4.2.1 Market size and forecast, by Type
- 6.5.4.2.2 Market size and forecast, by Application
- 6.5.4.3 South Africa
- 6.5.4.3.1 Market size and forecast, by Type
- 6.5.4.3.2 Market size and forecast, by Application
- 6.5.4.4 Rest of LAMEA
- 6.5.4.4.1 Market size and forecast, by Type
- 6.5.4.4.2 Market size and forecast, by Application
CHAPTER 7: COMPANY LANDSCAPE
- 7.1. Introduction
- 7.2. Top winning strategies
- 7.3. Product Mapping of Top 10 Player
- 7.4. Competitive Dashboard
- 7.5. Competitive Heatmap
- 7.6. Key developments
CHAPTER 8: COMPANY PROFILES
- 8.1 Applied Technologies Company, Ltd.
- 8.1.1 Company overview
- 8.1.2 Company snapshot
- 8.1.3 Operating business segments
- 8.1.4 Product portfolio
- 8.1.5 Business performance
- 8.1.6 Key strategic moves and developments
- 8.2 Aqua-Magnetics, Inc.
- 8.2.1 Company overview
- 8.2.2 Company snapshot
- 8.2.3 Operating business segments
- 8.2.4 Product portfolio
- 8.2.5 Business performance
- 8.2.6 Key strategic moves and developments
- 8.3 Atargis Energy Corporation
- 8.3.1 Company overview
- 8.3.2 Company snapshot
- 8.3.3 Operating business segments
- 8.3.4 Product portfolio
- 8.3.5 Business performance
- 8.3.6 Key strategic moves and developments
- 8.4 Biopower Systems Pty Ltd.
- 8.4.1 Company overview
- 8.4.2 Company snapshot
- 8.4.3 Operating business segments
- 8.4.4 Product portfolio
- 8.4.5 Business performance
- 8.4.6 Key strategic moves and developments
- 8.5 Blue Energy Canada, Inc.
- 8.5.1 Company overview
- 8.5.2 Company snapshot
- 8.5.3 Operating business segments
- 8.5.4 Product portfolio
- 8.5.5 Business performance
- 8.5.6 Key strategic moves and developments
- 8.6 Carnegie Clean Energy Limited
- 8.6.1 Company overview
- 8.6.2 Company snapshot
- 8.6.3 Operating business segments
- 8.6.4 Product portfolio
- 8.6.5 Business performance
- 8.6.6 Key strategic moves and developments
- 8.7 Minesto AB
- 8.7.1 Company overview
- 8.7.2 Company snapshot
- 8.7.3 Operating business segments
- 8.7.4 Product portfolio
- 8.7.5 Business performance
- 8.7.6 Key strategic moves and developments
- 8.8 Nova Innovation Ltd.
- 8.8.1 Company overview
- 8.8.2 Company snapshot
- 8.8.3 Operating business segments
- 8.8.4 Product portfolio
- 8.8.5 Business performance
- 8.8.6 Key strategic moves and developments
- 8.9 Ocean Power Technologies, Inc.
- 8.9.1 Company overview
- 8.9.2 Company snapshot
- 8.9.3 Operating business segments
- 8.9.4 Product portfolio
- 8.9.5 Business performance
- 8.9.6 Key strategic moves and developments
- 8.10 Ocean Renewable Power Company LLC
- 8.10.1 Company overview
- 8.10.2 Company snapshot
- 8.10.3 Operating business segments
- 8.10.4 Product portfolio
- 8.10.5 Business performance
- 8.10.6 Key strategic moves and developments