|
|
市場調査レポート
商品コード
1665874
FPGA市場 - 成長、将来展望、競合分析、2025年~2033年FPGA Market - Growth, Future Prospects and Competitive Analysis, 2025 - 2033 |
||||||
|
|||||||
|
|||||||


| FPGA市場 - 成長、将来展望、競合分析、2025年~2033年 |
|
出版日: 2025年01月06日
発行: Acute Market Reports
ページ情報: 英文 179 Pages
納期: 即日から翌営業日
|

全表示
- 概要
- 図表
- 目次
FPGA(Field-Programmable Gate Array)市場は、顧客や設計者が製造後にコンフィギュレーションできるプログラマブル・シリコン・チップの開発、製造、販売で構成されます。FPGAは、従来の固定機能チップとは異なり、必要に応じて特定のタスクを実行するようにプログラムできるように設計された集積回路です。これらのデバイスは、その柔軟性と適応性により、通信、自動車システム、航空宇宙・防衛、データセンター運用など、さまざまな用途で使用されています。FPGAの市場規模は、8%の年間平均成長率(CAGR)で拡大すると予測されています。この堅調な成長率は、FPGAが現代のエレクトロニクスやデジタル・アプリケーションで果たす重要な役割を反映したもので、技術の絶え間ない進歩と、より汎用性の高いハードウェア・ソリューションに対する需要の高まりが背景にあります。
FPGA市場の主な促進要因は、データセンターとクラウド・コンピューティングの急激な成長です。デジタルデータの生成が世界的に増加するにつれ、膨大な量のデータを管理、処理、保存するための効率的で柔軟なコンピューティング・インフラに対する需要が高まっています。FPGAは、特定のプロセスやワークロードに合わせてハードウェアを最適化し、パフォーマンスとエネルギー効率を向上させる機能を提供するため、最新のデータセンターに不可欠です。例えば、FPGAは機械学習アルゴリズムやデータ処理タスクのような特定のアプリケーションの高速化を可能にし、これはビッグデータ分析やAI技術において極めて重要です。企業や組織がデータ分析やクラウドベースのサービスに依存し続ける中、FPGAの導入はサーバー機能やネットワーク機能を強化し、急速に進化するデータセンター分野での採用を促進しています。
FPGA市場における新たな機会は、自律走行システムや電気自動車などの先進自動車技術の拡大です。FPGAは複数のセンサー入力を処理し、複雑なアルゴリズムを迅速に実行できるため、自動車用途で極めて重要な役割を果たしています。自動車業界ではAIやIoT技術の統合が進んでいるため、必要な演算能力と適応性を提供できるFPGAの需要は大きく伸びると予想されます。この動向は、FPGAメーカーが革新的な製品を提供し、自動車分野の特定のニーズに対応できるように拡張することで、FPGAメーカーに新たな収益源をもたらすことになります。
当レポートでは、世界のFPGA市場について調査し、市場の概要とともに、コンフィギュレーション別、ノードサイズ別、アーキテクチャ別、最終用途産業別、地域別の動向、および市場に参入する企業のプロファイルなどを提供しています。
目次
第1章 序文
第2章 エグゼクティブサマリー
第3章 FPGA市場:競合分析
- 主要ベンダーの市場ポジショニング
- ベンダーが採用した戦略
- 主要業界戦略
第4章 FPGA市場:マクロ分析と市場力学
- イントロダクション
- 世界のFPGAの市場価値、2023年~2033年
- 市場力学
- 促進要因と抑制要因の影響分析
- シーソー分析
- ポーターのファイブフォースモデル
- PESTEL分析
第5章 FPGA市場:2023~2033年
- 市場概要
- 成長と収益分析:2024年対2033年
- 市場セグメンテーション
第6章 FPGA市場:コンフィギュレーション別、2023年~2033年
- 市場概要
- 成長と収益分析:2024年対2033年
- 市場セグメンテーション
- ローエンドFPGA
- ミッドレンジFPGA
- ハイエンドFPGA
第7章 FPGA市場:ノードサイズ別、2023年~2033年
- 市場概要
- 成長と収益分析:2024年対2033年
- 市場セグメンテーション
- 28nm以下
- 28~90nm
- 90nm超
第8章 FPGA市場:アーキテクチャ別、2023年~2033年
- 市場概要
- 成長と収益分析:2024年対2033年
- 市場セグメンテーション
- SRAMベースのFPGA
- アンチヒューズベースのFPGA
- フラッシュベースのFPGA
第9章 FPGA市場:最終用途産業別、2023年~2033年
- 市場概要
- 成長と収益分析:2024年対2033年
- 市場セグメンテーション
- 家電
- ITおよび通信
- 航空宇宙および防衛
- 産業
- その他(自動車・運輸、ヘルスケア等)
第10章 北米のFPGA市場:2023年~2033年
第11章 英国およびEUのFPGA市場:2023年~2033年
第12章 アジア太平洋地域のFPGA市場:2023年~2033年
第13章 ラテンアメリカのFPGA市場:2023年~2033年
第14章 中東・アフリカのFPGA市場:2023年~2033年
第15章 企業プロファイル
- Xilinx Inc.
- Intel Corporation
- Microchip Technology Inc.
- Lattice Semiconductor Corporation
- QuickLogic Corporation
- Efinix Inc.
- Flex Logix Technologies
- GOWIN Semiconductor Corporation
- Achronix Semiconductor Corporation
- Microsemi Corporation
- S2C Inc.
List of Tables
- TABLE 1 Global FPGA Market By , 2023-2033, USD (Million)
- TABLE 2 Global FPGA Market By Configuration, 2023-2033, USD (Million)
- TABLE 3 Global FPGA Market By Node Size, 2023-2033, USD (Million)
- TABLE 4 Global FPGA Market By Architecture, 2023-2033, USD (Million)
- TABLE 5 Global FPGA Market By End-use Industry, 2023-2033, USD (Million)
- TABLE 6 North America FPGA Market By , 2023-2033, USD (Million)
- TABLE 7 North America FPGA Market By Configuration, 2023-2033, USD (Million)
- TABLE 8 North America FPGA Market By Node Size, 2023-2033, USD (Million)
- TABLE 9 North America FPGA Market By Architecture, 2023-2033, USD (Million)
- TABLE 10 North America FPGA Market By End-use Industry, 2023-2033, USD (Million)
- TABLE 11 U.S. FPGA Market By , 2023-2033, USD (Million)
- TABLE 12 U.S. FPGA Market By Configuration, 2023-2033, USD (Million)
- TABLE 13 U.S. FPGA Market By Node Size, 2023-2033, USD (Million)
- TABLE 14 U.S. FPGA Market By Architecture, 2023-2033, USD (Million)
- TABLE 15 U.S. FPGA Market By End-use Industry, 2023-2033, USD (Million)
- TABLE 16 Canada FPGA Market By , 2023-2033, USD (Million)
- TABLE 17 Canada FPGA Market By Configuration, 2023-2033, USD (Million)
- TABLE 18 Canada FPGA Market By Node Size, 2023-2033, USD (Million)
- TABLE 19 Canada FPGA Market By Architecture, 2023-2033, USD (Million)
- TABLE 20 Canada FPGA Market By End-use Industry, 2023-2033, USD (Million)
- TABLE 21 Rest of North America FPGA Market By , 2023-2033, USD (Million)
- TABLE 22 Rest of North America FPGA Market By Configuration, 2023-2033, USD (Million)
- TABLE 23 Rest of North America FPGA Market By Node Size, 2023-2033, USD (Million)
- TABLE 24 Rest of North America FPGA Market By Architecture, 2023-2033, USD (Million)
- TABLE 25 Rest of North America FPGA Market By End-use Industry, 2023-2033, USD (Million)
- TABLE 26 UK and European Union FPGA Market By , 2023-2033, USD (Million)
- TABLE 27 UK and European Union FPGA Market By Configuration, 2023-2033, USD (Million)
- TABLE 28 UK and European Union FPGA Market By Node Size, 2023-2033, USD (Million)
- TABLE 29 UK and European Union FPGA Market By Architecture, 2023-2033, USD (Million)
- TABLE 30 UK and European Union FPGA Market By End-use Industry, 2023-2033, USD (Million)
- TABLE 31 UK FPGA Market By , 2023-2033, USD (Million)
- TABLE 32 UK FPGA Market By Configuration, 2023-2033, USD (Million)
- TABLE 33 UK FPGA Market By Node Size, 2023-2033, USD (Million)
- TABLE 34 UK FPGA Market By Architecture, 2023-2033, USD (Million)
- TABLE 35 UK FPGA Market By End-use Industry, 2023-2033, USD (Million)
- TABLE 36 Germany FPGA Market By , 2023-2033, USD (Million)
- TABLE 37 Germany FPGA Market By Configuration, 2023-2033, USD (Million)
- TABLE 38 Germany FPGA Market By Node Size, 2023-2033, USD (Million)
- TABLE 39 Germany FPGA Market By Architecture, 2023-2033, USD (Million)
- TABLE 40 Germany FPGA Market By End-use Industry, 2023-2033, USD (Million)
- TABLE 41 Spain FPGA Market By , 2023-2033, USD (Million)
- TABLE 42 Spain FPGA Market By Configuration, 2023-2033, USD (Million)
- TABLE 43 Spain FPGA Market By Node Size, 2023-2033, USD (Million)
- TABLE 44 Spain FPGA Market By Architecture, 2023-2033, USD (Million)
- TABLE 45 Spain FPGA Market By End-use Industry, 2023-2033, USD (Million)
- TABLE 46 Italy FPGA Market By , 2023-2033, USD (Million)
- TABLE 47 Italy FPGA Market By Configuration, 2023-2033, USD (Million)
- TABLE 48 Italy FPGA Market By Node Size, 2023-2033, USD (Million)
- TABLE 49 Italy FPGA Market By Architecture, 2023-2033, USD (Million)
- TABLE 50 Italy FPGA Market By End-use Industry, 2023-2033, USD (Million)
- TABLE 51 France FPGA Market By , 2023-2033, USD (Million)
- TABLE 52 France FPGA Market By Configuration, 2023-2033, USD (Million)
- TABLE 53 France FPGA Market By Node Size, 2023-2033, USD (Million)
- TABLE 54 France FPGA Market By Architecture, 2023-2033, USD (Million)
- TABLE 55 France FPGA Market By End-use Industry, 2023-2033, USD (Million)
- TABLE 56 Rest of Europe FPGA Market By , 2023-2033, USD (Million)
- TABLE 57 Rest of Europe FPGA Market By Configuration, 2023-2033, USD (Million)
- TABLE 58 Rest of Europe FPGA Market By Node Size, 2023-2033, USD (Million)
- TABLE 59 Rest of Europe FPGA Market By Architecture, 2023-2033, USD (Million)
- TABLE 60 Rest of Europe FPGA Market By End-use Industry, 2023-2033, USD (Million)
- TABLE 61 Asia FPGA Market By , 2023-2033, USD (Million)
- TABLE 62 Asia FPGA Market By Configuration, 2023-2033, USD (Million)
- TABLE 63 Asia FPGA Market By Node Size, 2023-2033, USD (Million)
- TABLE 64 Asia FPGA Market By Architecture, 2023-2033, USD (Million)
- TABLE 65 Asia FPGA Market By End-use Industry, 2023-2033, USD (Million)
- TABLE 66 China FPGA Market By , 2023-2033, USD (Million)
- TABLE 67 China FPGA Market By Configuration, 2023-2033, USD (Million)
- TABLE 68 China FPGA Market By Node Size, 2023-2033, USD (Million)
- TABLE 69 China FPGA Market By Architecture, 2023-2033, USD (Million)
- TABLE 70 China FPGA Market By End-use Industry, 2023-2033, USD (Million)
- TABLE 71 Japan FPGA Market By , 2023-2033, USD (Million)
- TABLE 72 Japan FPGA Market By Configuration, 2023-2033, USD (Million)
- TABLE 73 Japan FPGA Market By Node Size, 2023-2033, USD (Million)
- TABLE 74 Japan FPGA Market By Architecture, 2023-2033, USD (Million)
- TABLE 75 Japan FPGA Market By End-use Industry, 2023-2033, USD (Million)
- TABLE 76 India FPGA Market By , 2023-2033, USD (Million)
- TABLE 77 India FPGA Market By Configuration, 2023-2033, USD (Million)
- TABLE 78 India FPGA Market By Node Size, 2023-2033, USD (Million)
- TABLE 79 India FPGA Market By Architecture, 2023-2033, USD (Million)
- TABLE 80 India FPGA Market By End-use Industry, 2023-2033, USD (Million)
- TABLE 81 Australia FPGA Market By , 2023-2033, USD (Million)
- TABLE 82 Australia FPGA Market By Configuration, 2023-2033, USD (Million)
- TABLE 83 Australia FPGA Market By Node Size, 2023-2033, USD (Million)
- TABLE 84 Australia FPGA Market By Architecture, 2023-2033, USD (Million)
- TABLE 85 Australia FPGA Market By End-use Industry, 2023-2033, USD (Million)
- TABLE 86 South Korea FPGA Market By , 2023-2033, USD (Million)
- TABLE 87 South Korea FPGA Market By Configuration, 2023-2033, USD (Million)
- TABLE 88 South Korea FPGA Market By Node Size, 2023-2033, USD (Million)
- TABLE 89 South Korea FPGA Market By Architecture, 2023-2033, USD (Million)
- TABLE 90 South Korea FPGA Market By End-use Industry, 2023-2033, USD (Million)
- TABLE 91 Latin America FPGA Market By , 2023-2033, USD (Million)
- TABLE 92 Latin America FPGA Market By Configuration, 2023-2033, USD (Million)
- TABLE 93 Latin America FPGA Market By Node Size, 2023-2033, USD (Million)
- TABLE 94 Latin America FPGA Market By Architecture, 2023-2033, USD (Million)
- TABLE 95 Latin America FPGA Market By End-use Industry, 2023-2033, USD (Million)
- TABLE 96 Brazil FPGA Market By , 2023-2033, USD (Million)
- TABLE 97 Brazil FPGA Market By Configuration, 2023-2033, USD (Million)
- TABLE 98 Brazil FPGA Market By Node Size, 2023-2033, USD (Million)
- TABLE 99 Brazil FPGA Market By Architecture, 2023-2033, USD (Million)
- TABLE 100 Brazil FPGA Market By End-use Industry, 2023-2033, USD (Million)
- TABLE 101 Mexico FPGA Market By , 2023-2033, USD (Million)
- TABLE 102 Mexico FPGA Market By Configuration, 2023-2033, USD (Million)
- TABLE 103 Mexico FPGA Market By Node Size, 2023-2033, USD (Million)
- TABLE 104 Mexico FPGA Market By Architecture, 2023-2033, USD (Million)
- TABLE 105 Mexico FPGA Market By End-use Industry, 2023-2033, USD (Million)
- TABLE 106 Rest of Latin America FPGA Market By , 2023-2033, USD (Million)
- TABLE 107 Rest of Latin America FPGA Market By Configuration, 2023-2033, USD (Million)
- TABLE 108 Rest of Latin America FPGA Market By Node Size, 2023-2033, USD (Million)
- TABLE 109 Rest of Latin America FPGA Market By Architecture, 2023-2033, USD (Million)
- TABLE 110 Rest of Latin America FPGA Market By End-use Industry, 2023-2033, USD (Million)
- TABLE 111 Middle East and Africa FPGA Market By , 2023-2033, USD (Million)
- TABLE 112 Middle East and Africa FPGA Market By Configuration, 2023-2033, USD (Million)
- TABLE 113 Middle East and Africa FPGA Market By Node Size, 2023-2033, USD (Million)
- TABLE 114 Middle East and Africa FPGA Market By Architecture, 2023-2033, USD (Million)
- TABLE 115 Middle East and Africa FPGA Market By End-use Industry, 2023-2033, USD (Million)
- TABLE 116 GCC FPGA Market By , 2023-2033, USD (Million)
- TABLE 117 GCC FPGA Market By Configuration, 2023-2033, USD (Million)
- TABLE 118 GCC FPGA Market By Node Size, 2023-2033, USD (Million)
- TABLE 119 GCC FPGA Market By Architecture, 2023-2033, USD (Million)
- TABLE 120 GCC FPGA Market By End-use Industry, 2023-2033, USD (Million)
- TABLE 121 Africa FPGA Market By , 2023-2033, USD (Million)
- TABLE 122 Africa FPGA Market By Configuration, 2023-2033, USD (Million)
- TABLE 123 Africa FPGA Market By Node Size, 2023-2033, USD (Million)
- TABLE 124 Africa FPGA Market By Architecture, 2023-2033, USD (Million)
- TABLE 125 Africa FPGA Market By End-use Industry, 2023-2033, USD (Million)
- TABLE 126 Rest of Middle East and Africa FPGA Market By , 2023-2033, USD (Million)
- TABLE 127 Rest of Middle East and Africa FPGA Market By Configuration, 2023-2033, USD (Million)
- TABLE 128 Rest of Middle East and Africa FPGA Market By Node Size, 2023-2033, USD (Million)
- TABLE 129 Rest of Middle East and Africa FPGA Market By Architecture, 2023-2033, USD (Million)
- TABLE 130 Rest of Middle East and Africa FPGA Market By End-use Industry, 2023-2033, USD (Million)
List of Figures
- FIG. 1 Global FPGA Market: Market Coverage
- FIG. 2 Research Methodology and Data Sources
- FIG. 3 Market Size Estimation - Top Down & Bottom-Up Approach
- FIG. 4 Global FPGA Market: Quality Assurance
- FIG. 5 Global FPGA Market, By , 2024
- FIG. 6 Global FPGA Market, By Configuration, 2024
- FIG. 7 Global FPGA Market, By Node Size, 2024
- FIG. 8 Global FPGA Market, By Architecture, 2024
- FIG. 9 Global FPGA Market, By End-use Industry, 2024
- FIG. 10 Global FPGA Market, By Geography, 2024
- FIG. 11 Market Geographical Opportunity Matrix - Global FPGA Market, 2024
- FIG. 12Market Positioning of Key FPGA Market Players, 2024
- FIG. 13 Global FPGA Market, By , 2024 Vs 2033, %
- FIG. 14 Global FPGA Market, By Configuration, 2024 Vs 2033, %
- FIG. 15 Global FPGA Market, By Node Size, 2024 Vs 2033, %
- FIG. 16 Global FPGA Market, By Architecture, 2024 Vs 2033, %
- FIG. 17 Global FPGA Market, By End-use Industry, 2024 Vs 2033, %
The FPGA (Field-Programmable Gate Array) market comprises the development, manufacturing, and sales of programmable silicon chips that can be configured by a customer or a designer after manufacturing hence the name "field-programmable". FPGAs are integrated circuits that are designed to be programmed to perform particular tasks as needed, differing from conventional fixed-function chips. These devices are used in various applications, including telecommunications, automotive systems, aerospace and defense, and data center operations, due to their flexibility and adaptability. The FPGA market is projected to grow at a Compound Annual Growth Rate (CAGR) of 8%. This robust growth rate reflects the critical role FPGAs play in modern electronics and digital applications, driven by continuous advancements in technology and growing demands for more versatile hardware solutions.
Rise of Data Centers and Cloud Computing
The primary driver for the FPGA market is the exponential growth in data centers and cloud computing. As digital data generation increases globally, there is a rising demand for efficient and flexible computing infrastructure to manage, process, and store vast amounts of data. FPGAs are integral to modern data centers because they provide the ability to optimize hardware for specific processes and workloads, improving performance and energy efficiency. For instance, FPGAs allow for the acceleration of specific applications like machine learning algorithms and data processing tasks, which are crucial in big data analytics and AI technologies. As businesses and organizations continue to rely on data analytics and cloud-based services, the deployment of FPGAs enhances server capabilities and network functions, driving their adoption in the rapidly evolving data center sector.
Expansion in Automotive Technology
An emerging opportunity within the FPGA market is the expansion of advanced automotive technologies, including autonomous driving systems and electric vehicles. FPGAs play a pivotal role in automotive applications due to their ability to handle multiple sensor inputs and execute complex algorithms quickly, a necessity for real-time decision-making in autonomous vehicles. As the automotive industry increasingly integrates AI and IoT technologies, the demand for FPGAs that can provide the necessary computational power and adaptability is expected to grow significantly. This trend is set to open new revenue streams for FPGA manufacturers as they innovate and expand their offerings to meet the specific needs of the automotive sector.
High Costs and Design Complexity
A significant restraint in the FPGA market is the high cost and complexity of FPGA design and development. Unlike standard chips, FPGAs require specialized skills to program and integrate, which can lead to higher initial costs in terms of both development and time-to-market. Moreover, the design process for FPGAs is complex and resource-intensive, which can be a barrier for adoption, especially for smaller organizations and startups. The need for sophisticated design tools and expert knowledge to effectively utilize FPGAs means that the technology remains out of reach for some potential users, limiting broader market penetration and adoption.
Keeping Pace with Rapid Technological Advancements
One major challenge facing the FPGA market is keeping pace with rapid technological advancements and changing industry standards. As the technology landscape evolves, FPGAs must continually adapt to support newer or emerging standards, especially in high-growth areas like 5G, AI, and machine learning. This requires ongoing research and development efforts and frequent updates to FPGA architectures and software tools. Additionally, the fast pace of innovation often necessitates collaborations with other technology providers, requiring FPGA manufacturers to maintain strong partnerships within the ecosystem to integrate their products seamlessly with other hardware and software solutions. Balancing these demands while ensuring product reliability and performance is a complex endeavor that poses ongoing challenges for companies in the FPGA space.
Market Segmentation by Configuration
In the FPGA market, the segmentation by configuration includes low-end FPGA, mid-range FPGA, and high-end FPGA. High-end FPGAs command the highest revenue within this segment, driven by their extensive use in advanced applications that require high performance, extensive programmability, and large densities, such as data centers, automotive driver assistance systems, and wireless communications. These devices cater to high-speed, complex processing tasks, making them indispensable in industries that are at the forefront of technological innovation. Conversely, mid-range FPGAs are expected to exhibit the highest Compound Annual Growth Rate (CAGR). This growth is fueled by their versatility and optimal balance between cost, performance, and power consumption, making them suitable for a broad spectrum of mainstream applications, including industrial automation, medical devices, and broadcast equipment. As these sectors continue to advance and incorporate more digital and AI functionalities, the demand for mid-range FPGAs is anticipated to increase significantly.
Market Segmentation by Node Size
The FPGA market is also segmented by node size, categorized into <=28 nm, 28-90 nm, and >90 nm. The <=28 nm segment dominates in terms of revenue, as these smaller node sizes offer greater performance efficiency, lower power consumption, and higher density, traits that are critically important in high-performance computing environments and applications requiring extensive computational power and minimal latency. These characteristics make <=28 nm FPGAs particularly popular in sectors such as telecommunications, advanced automotive systems, and military applications, where cutting-edge technology is paramount. Meanwhile, the 28-90 nm segment is projected to experience the highest CAGR over the forecast period. This growth can be attributed to the expanding utilization of FPGAs in consumer electronics and the ongoing need for cost-effective, reasonably powerful solutions in medium-complexity applications. As technology migrates towards more compact and efficient solutions, the demand for 28-90 nm FPGAs is likely to surge, supported by their adequate performance and relatively lower cost compared to sub-28 nm technologies.
Geographic Segmentation
In 2024, the FPGA market was predominantly led by the North American region, which accounted for the highest revenue percentage. This dominance is largely due to the concentrated presence of leading technology firms, substantial investments in R&D, and rapid adoption of advanced technologies in sectors like telecommunications, defense, and data centers. North America's leading position is also reinforced by its robust semiconductor industry infrastructure and early access to cutting-edge manufacturing technologies. However, the Asia-Pacific region is expected to witness the highest CAGR from 2025 to 2033. This growth will be driven by the expanding electronics manufacturing sector, increasing investments in network infrastructure, and government initiatives promoting technological advancements in countries such as China, South Korea, and India. The burgeoning demand for consumer electronics and the automotive industry's rapid evolution in these countries are significant catalysts for the region's accelerated growth.
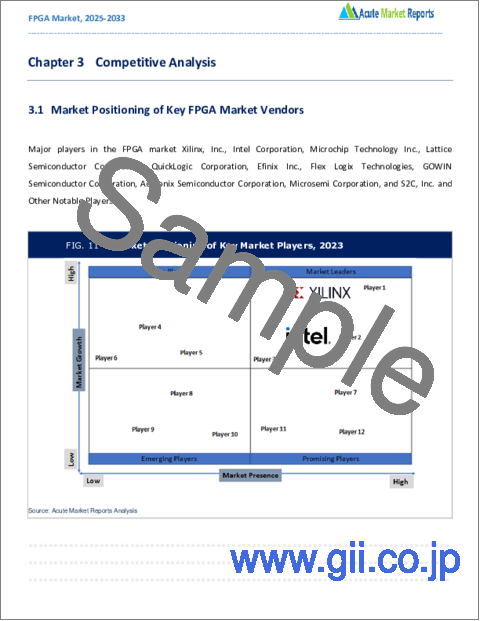
Competitive Trends and Top Players
In 2024, the competitive landscape of the FPGA market featured key players including Xilinx, Inc., Intel Corporation, Microchip Technology Inc., Lattice Semiconductor Corporation, QuickLogic Corporation, Efinix Inc., Flex Logix Technologies, GOWIN Semiconductor Corporation, Achronix Semiconductor Corporation, Microsemi Corporation, and S2C, Inc. These companies primarily focused on innovation, strategic collaborations, and expanding their product portfolios to include FPGAs that meet a diverse range of applications from consumer electronics to high-end computing solutions. Xilinx and Intel, as market leaders, heavily invested in developing high-capacity, high-performance FPGAs that cater to the needs of emerging applications such as AI, machine learning, and 5G technologies. Smaller players like QuickLogic and Efinix concentrated on niche markets, offering specialized solutions tailored to low-power and small-form-factor applications, which are critical in mobile and IoT devices. From 2025 to 2033, these companies are expected to further their advancements in FPGA technology by enhancing the programmability, efficiency, and integration capabilities of their products. There will likely be a significant push towards sustainability in manufacturing processes and a stronger emphasis on developing FPGAs that can efficiently handle the increasing data processing demands of future technologies. Collaborations with technology partners and expansion into new geographical markets will be crucial strategies for maintaining competitiveness and fostering growth in the rapidly evolving FPGA landscape.
Historical & Forecast Period
This study report represents an analysis of each segment from 2023 to 2033 considering 2024 as the base year. Compounded Annual Growth Rate (CAGR) for each of the respective segments estimated for the forecast period of 2025 to 2033.
The current report comprises quantitative market estimations for each micro market for every geographical region and qualitative market analysis such as micro and macro environment analysis, market trends, competitive intelligence, segment analysis, porters five force model, top winning strategies, top investment markets, emerging trends & technological analysis, case studies, strategic conclusions and recommendations and other key market insights.
Research Methodology
The complete research study was conducted in three phases, namely: secondary research, primary research, and expert panel review. The key data points that enable the estimation of FPGA market are as follows:
Research and development budgets of manufacturers and government spending
Revenues of key companies in the market segment
Number of end users & consumption volume, price, and value.
Geographical revenues generated by countries considered in the report
Micro and macro environment factors that are currently influencing the FPGA market and their expected impact during the forecast period.
Market forecast was performed through proprietary software that analyzes various qualitative and quantitative factors. Growth rate and CAGR were estimated through intensive secondary and primary research. Data triangulation across various data points provides accuracy across various analyzed market segments in the report. Application of both top-down and bottom-up approach for validation of market estimation assures logical, methodical, and mathematical consistency of the quantitative data.
- Market Segmentation
- Configuration
- Low-end FPGA
- Mid-range FPGA
- High-end FPGA
- Node Size
- <=28 nm
- 28-90 nm
- >90 nm
- Architecture
- SRAM-based FPGA
- Anti-fuse-based FPGA
- Flash-based FPGA
- End-use Industry
- Consumer Electronics
- IT & Telecommunication
- Aerospace & Defense
- Industrial
- Others (Automotive & Transportation, Healthcare, etc.)
- Region Segment (2023-2033; US$ Million)
- North America
- U.S.
- Canada
- Rest of North America
- UK and European Union
- UK
- Germany
- Spain
- Italy
- France
- Rest of Europe
- Asia Pacific
- China
- Japan
- India
- Australia
- South Korea
- Rest of Asia Pacific
- Latin America
- Brazil
- Mexico
- Rest of Latin America
- Middle East and Africa
- GCC
- Africa
- Rest of Middle East and Africa
Key questions answered in this report
- What are the key micro and macro environmental factors that are impacting the growth of FPGA market?
- What are the key investment pockets concerning product segments and geographies currently and during the forecast period?
- Estimated forecast and market projections up to 2033.
- Which segment accounts for the fastest CAGR during the forecast period?
- Which market segment holds a larger market share and why?
- Are low and middle-income economies investing in the FPGA market?
- Which is the largest regional market for FPGA market?
- What are the market trends and dynamics in emerging markets such as Asia Pacific, Latin America, and Middle East & Africa?
- Which are the key trends driving FPGA market growth?
- Who are the key competitors and what are their key strategies to enhance their market presence in the FPGA market worldwide?
Table of Contents
1. Preface
- 1.1. Report Description
- 1.1.1. Purpose of the Report
- 1.1.2. Target Audience
- 1.1.3. Key Offerings
- 1.2. Market Segmentation
- 1.3. Research Methodology
- 1.3.1. Phase I - Secondary Research
- 1.3.2. Phase II - Primary Research
- 1.3.3. Phase III - Expert Panel Review
- 1.3.4. Assumptions
- 1.3.5. Approach Adopted
2. Executive Summary
- 2.1. Market Snapshot: Global FPGA Market
- 2.2. Global FPGA Market, By , 2024 (US$ Million)
- 2.3. Global FPGA Market, By Configuration, 2024 (US$ Million)
- 2.4. Global FPGA Market, By Node Size, 2024 (US$ Million)
- 2.5. Global FPGA Market, By Architecture, 2024 (US$ Million)
- 2.6. Global FPGA Market, By End-use Industry, 2024 (US$ Million)
- 2.7. Global FPGA Market, By Geography, 2024 (US$ Million)
- 2.8. Attractive Investment Proposition by Geography, 2024
3. FPGA Market: Competitive Analysis
- 3.1. Market Positioning of Key FPGA Market Vendors
- 3.2. Strategies Adopted by FPGA Market Vendors
- 3.3. Key Industry Strategies
4. FPGA Market: Macro Analysis & Market Dynamics
- 4.1. Introduction
- 4.2. Global FPGA Market Value, 2023 - 2033, (US$ Million)
- 4.3. Market Dynamics
- 4.3.1. Market Drivers
- 4.3.2. Market Restraints
- 4.3.3. Key Challenges
- 4.3.4. Key Opportunities
- 4.4. Impact Analysis of Drivers and Restraints
- 4.5. See-Saw Analysis
- 4.6. Porter's Five Force Model
- 4.6.1. Supplier Power
- 4.6.2. Buyer Power
- 4.6.3. Threat Of Substitutes
- 4.6.4. Threat Of New Entrants
- 4.6.5. Competitive Rivalry
- 4.7. PESTEL Analysis
- 4.7.1. Political Landscape
- 4.7.2. Economic Landscape
- 4.7.3. Technology Landscape
- 4.7.4. Legal Landscape
- 4.7.5. Social Landscape
5. FPGA Market: By , 2023-2033, USD (Million)
- 5.1. Market Overview
- 5.2. Growth & Revenue Analysis: 2024 Versus 2033
- 5.3. Market Segmentation
6. FPGA Market: By Configuration, 2023-2033, USD (Million)
- 6.1. Market Overview
- 6.2. Growth & Revenue Analysis: 2024 Versus 2033
- 6.3. Market Segmentation
- 6.3.1. Low-end FPGA
- 6.3.2. Mid-range FPGA
- 6.3.3. High-end FPGA
7. FPGA Market: By Node Size, 2023-2033, USD (Million)
- 7.1. Market Overview
- 7.2. Growth & Revenue Analysis: 2024 Versus 2033
- 7.3. Market Segmentation
- 7.3.1. <=28 nm
- 7.3.2. 28-90 nm
- 7.3.3. >90 nm
8. FPGA Market: By Architecture, 2023-2033, USD (Million)
- 8.1. Market Overview
- 8.2. Growth & Revenue Analysis: 2024 Versus 2033
- 8.3. Market Segmentation
- 8.3.1. SRAM-based FPGA
- 8.3.2. Anti-fuse-based FPGA
- 8.3.3. Flash-based FPGA
9. FPGA Market: By End-use Industry, 2023-2033, USD (Million)
- 9.1. Market Overview
- 9.2. Growth & Revenue Analysis: 2024 Versus 2033
- 9.3. Market Segmentation
- 9.3.1. Consumer Electronics
- 9.3.2. IT & Telecommunication
- 9.3.3. Aerospace & Defense
- 9.3.4. Industrial
- 9.3.5. Others (Automotive & Transportation, Healthcare, etc.)
10. North America FPGA Market, 2023-2033, USD (Million)
- 10.1. Market Overview
- 10.2. FPGA Market: By , 2023-2033, USD (Million)
- 10.3. FPGA Market: By Configuration, 2023-2033, USD (Million)
- 10.4. FPGA Market: By Node Size, 2023-2033, USD (Million)
- 10.5. FPGA Market: By Architecture, 2023-2033, USD (Million)
- 10.6. FPGA Market: By End-use Industry, 2023-2033, USD (Million)
- 10.7.FPGA Market: By Region, 2023-2033, USD (Million)
- 10.7.1.North America
- 10.7.1.1. U.S.
- 10.7.1.1.1. FPGA Market: By , 2023-2033, USD (Million)
- 10.7.1.1.2. FPGA Market: By Configuration, 2023-2033, USD (Million)
- 10.7.1.1.3. FPGA Market: By Node Size, 2023-2033, USD (Million)
- 10.7.1.1.4. FPGA Market: By Architecture, 2023-2033, USD (Million)
- 10.7.1.1.5. FPGA Market: By End-use Industry, 2023-2033, USD (Million)
- 10.7.1.2. Canada
- 10.7.1.2.1. FPGA Market: By , 2023-2033, USD (Million)
- 10.7.1.2.2. FPGA Market: By Configuration, 2023-2033, USD (Million)
- 10.7.1.2.3. FPGA Market: By Node Size, 2023-2033, USD (Million)
- 10.7.1.2.4. FPGA Market: By Architecture, 2023-2033, USD (Million)
- 10.7.1.2.5. FPGA Market: By End-use Industry, 2023-2033, USD (Million)
- 10.7.1.3. Rest of North America
- 10.7.1.3.1. FPGA Market: By , 2023-2033, USD (Million)
- 10.7.1.3.2. FPGA Market: By Configuration, 2023-2033, USD (Million)
- 10.7.1.3.3. FPGA Market: By Node Size, 2023-2033, USD (Million)
- 10.7.1.3.4. FPGA Market: By Architecture, 2023-2033, USD (Million)
- 10.7.1.3.5. FPGA Market: By End-use Industry, 2023-2033, USD (Million)
- 10.7.1.1. U.S.
- 10.7.1.North America
11. UK and European Union FPGA Market, 2023-2033, USD (Million)
- 11.1. Market Overview
- 11.2. FPGA Market: By , 2023-2033, USD (Million)
- 11.3. FPGA Market: By Configuration, 2023-2033, USD (Million)
- 11.4. FPGA Market: By Node Size, 2023-2033, USD (Million)
- 11.5. FPGA Market: By Architecture, 2023-2033, USD (Million)
- 11.6. FPGA Market: By End-use Industry, 2023-2033, USD (Million)
- 11.7.FPGA Market: By Region, 2023-2033, USD (Million)
- 11.7.1.UK and European Union
- 11.7.1.1. UK
- 11.7.1.1.1. FPGA Market: By , 2023-2033, USD (Million)
- 11.7.1.1.2. FPGA Market: By Configuration, 2023-2033, USD (Million)
- 11.7.1.1.3. FPGA Market: By Node Size, 2023-2033, USD (Million)
- 11.7.1.1.4. FPGA Market: By Architecture, 2023-2033, USD (Million)
- 11.7.1.1.5. FPGA Market: By End-use Industry, 2023-2033, USD (Million)
- 11.7.1.2. Germany
- 11.7.1.2.1. FPGA Market: By , 2023-2033, USD (Million)
- 11.7.1.2.2. FPGA Market: By Configuration, 2023-2033, USD (Million)
- 11.7.1.2.3. FPGA Market: By Node Size, 2023-2033, USD (Million)
- 11.7.1.2.4. FPGA Market: By Architecture, 2023-2033, USD (Million)
- 11.7.1.2.5. FPGA Market: By End-use Industry, 2023-2033, USD (Million)
- 11.7.1.3. Spain
- 11.7.1.3.1. FPGA Market: By , 2023-2033, USD (Million)
- 11.7.1.3.2. FPGA Market: By Configuration, 2023-2033, USD (Million)
- 11.7.1.3.3. FPGA Market: By Node Size, 2023-2033, USD (Million)
- 11.7.1.3.4. FPGA Market: By Architecture, 2023-2033, USD (Million)
- 11.7.1.3.5. FPGA Market: By End-use Industry, 2023-2033, USD (Million)
- 11.7.1.4. Italy
- 11.7.1.4.1. FPGA Market: By , 2023-2033, USD (Million)
- 11.7.1.4.2. FPGA Market: By Configuration, 2023-2033, USD (Million)
- 11.7.1.4.3. FPGA Market: By Node Size, 2023-2033, USD (Million)
- 11.7.1.4.4. FPGA Market: By Architecture, 2023-2033, USD (Million)
- 11.7.1.4.5. FPGA Market: By End-use Industry, 2023-2033, USD (Million)
- 11.7.1.5. France
- 11.7.1.5.1. FPGA Market: By , 2023-2033, USD (Million)
- 11.7.1.5.2. FPGA Market: By Configuration, 2023-2033, USD (Million)
- 11.7.1.5.3. FPGA Market: By Node Size, 2023-2033, USD (Million)
- 11.7.1.5.4. FPGA Market: By Architecture, 2023-2033, USD (Million)
- 11.7.1.5.5. FPGA Market: By End-use Industry, 2023-2033, USD (Million)
- 11.7.1.6. Rest of Europe
- 11.7.1.6.1. FPGA Market: By , 2023-2033, USD (Million)
- 11.7.1.6.2. FPGA Market: By Configuration, 2023-2033, USD (Million)
- 11.7.1.6.3. FPGA Market: By Node Size, 2023-2033, USD (Million)
- 11.7.1.6.4. FPGA Market: By Architecture, 2023-2033, USD (Million)
- 11.7.1.6.5. FPGA Market: By End-use Industry, 2023-2033, USD (Million)
- 11.7.1.1. UK
- 11.7.1.UK and European Union
12. Asia Pacific FPGA Market, 2023-2033, USD (Million)
- 12.1. Market Overview
- 12.2. FPGA Market: By , 2023-2033, USD (Million)
- 12.3. FPGA Market: By Configuration, 2023-2033, USD (Million)
- 12.4. FPGA Market: By Node Size, 2023-2033, USD (Million)
- 12.5. FPGA Market: By Architecture, 2023-2033, USD (Million)
- 12.6. FPGA Market: By End-use Industry, 2023-2033, USD (Million)
- 12.7.FPGA Market: By Region, 2023-2033, USD (Million)
- 12.7.1.Asia Pacific
- 12.7.1.1. China
- 12.7.1.1.1. FPGA Market: By , 2023-2033, USD (Million)
- 12.7.1.1.2. FPGA Market: By Configuration, 2023-2033, USD (Million)
- 12.7.1.1.3. FPGA Market: By Node Size, 2023-2033, USD (Million)
- 12.7.1.1.4. FPGA Market: By Architecture, 2023-2033, USD (Million)
- 12.7.1.1.5. FPGA Market: By End-use Industry, 2023-2033, USD (Million)
- 12.7.1.2. Japan
- 12.7.1.2.1. FPGA Market: By , 2023-2033, USD (Million)
- 12.7.1.2.2. FPGA Market: By Configuration, 2023-2033, USD (Million)
- 12.7.1.2.3. FPGA Market: By Node Size, 2023-2033, USD (Million)
- 12.7.1.2.4. FPGA Market: By Architecture, 2023-2033, USD (Million)
- 12.7.1.2.5. FPGA Market: By End-use Industry, 2023-2033, USD (Million)
- 12.7.1.3. India
- 12.7.1.3.1. FPGA Market: By , 2023-2033, USD (Million)
- 12.7.1.3.2. FPGA Market: By Configuration, 2023-2033, USD (Million)
- 12.7.1.3.3. FPGA Market: By Node Size, 2023-2033, USD (Million)
- 12.7.1.3.4. FPGA Market: By Architecture, 2023-2033, USD (Million)
- 12.7.1.3.5. FPGA Market: By End-use Industry, 2023-2033, USD (Million)
- 12.7.1.4. Australia
- 12.7.1.4.1. FPGA Market: By , 2023-2033, USD (Million)
- 12.7.1.4.2. FPGA Market: By Configuration, 2023-2033, USD (Million)
- 12.7.1.4.3. FPGA Market: By Node Size, 2023-2033, USD (Million)
- 12.7.1.4.4. FPGA Market: By Architecture, 2023-2033, USD (Million)
- 12.7.1.4.5. FPGA Market: By End-use Industry, 2023-2033, USD (Million)
- 12.7.1.5. South Korea
- 12.7.1.5.1. FPGA Market: By , 2023-2033, USD (Million)
- 12.7.1.5.2. FPGA Market: By Configuration, 2023-2033, USD (Million)
- 12.7.1.5.3. FPGA Market: By Node Size, 2023-2033, USD (Million)
- 12.7.1.5.4. FPGA Market: By Architecture, 2023-2033, USD (Million)
- 12.7.1.5.5. FPGA Market: By End-use Industry, 2023-2033, USD (Million)
- 12.7.1.6. Rest of Asia Pacific
- 12.7.1.6.1. FPGA Market: By , 2023-2033, USD (Million)
- 12.7.1.6.2. FPGA Market: By Configuration, 2023-2033, USD (Million)
- 12.7.1.6.3. FPGA Market: By Node Size, 2023-2033, USD (Million)
- 12.7.1.6.4. FPGA Market: By Architecture, 2023-2033, USD (Million)
- 12.7.1.6.5. FPGA Market: By End-use Industry, 2023-2033, USD (Million)
- 12.7.1.1. China
- 12.7.1.Asia Pacific
13. Latin America FPGA Market, 2023-2033, USD (Million)
- 13.1. Market Overview
- 13.2. FPGA Market: By , 2023-2033, USD (Million)
- 13.3. FPGA Market: By Configuration, 2023-2033, USD (Million)
- 13.4. FPGA Market: By Node Size, 2023-2033, USD (Million)
- 13.5. FPGA Market: By Architecture, 2023-2033, USD (Million)
- 13.6. FPGA Market: By End-use Industry, 2023-2033, USD (Million)
- 13.7.FPGA Market: By Region, 2023-2033, USD (Million)
- 13.7.1.Latin America
- 13.7.1.1. Brazil
- 13.7.1.1.1. FPGA Market: By , 2023-2033, USD (Million)
- 13.7.1.1.2. FPGA Market: By Configuration, 2023-2033, USD (Million)
- 13.7.1.1.3. FPGA Market: By Node Size, 2023-2033, USD (Million)
- 13.7.1.1.4. FPGA Market: By Architecture, 2023-2033, USD (Million)
- 13.7.1.1.5. FPGA Market: By End-use Industry, 2023-2033, USD (Million)
- 13.7.1.2. Mexico
- 13.7.1.2.1. FPGA Market: By , 2023-2033, USD (Million)
- 13.7.1.2.2. FPGA Market: By Configuration, 2023-2033, USD (Million)
- 13.7.1.2.3. FPGA Market: By Node Size, 2023-2033, USD (Million)
- 13.7.1.2.4. FPGA Market: By Architecture, 2023-2033, USD (Million)
- 13.7.1.2.5. FPGA Market: By End-use Industry, 2023-2033, USD (Million)
- 13.7.1.3. Rest of Latin America
- 13.7.1.3.1. FPGA Market: By , 2023-2033, USD (Million)
- 13.7.1.3.2. FPGA Market: By Configuration, 2023-2033, USD (Million)
- 13.7.1.3.3. FPGA Market: By Node Size, 2023-2033, USD (Million)
- 13.7.1.3.4. FPGA Market: By Architecture, 2023-2033, USD (Million)
- 13.7.1.3.5. FPGA Market: By End-use Industry, 2023-2033, USD (Million)
- 13.7.1.1. Brazil
- 13.7.1.Latin America
14. Middle East and Africa FPGA Market, 2023-2033, USD (Million)
- 14.1. Market Overview
- 14.2. FPGA Market: By , 2023-2033, USD (Million)
- 14.3. FPGA Market: By Configuration, 2023-2033, USD (Million)
- 14.4. FPGA Market: By Node Size, 2023-2033, USD (Million)
- 14.5. FPGA Market: By Architecture, 2023-2033, USD (Million)
- 14.6. FPGA Market: By End-use Industry, 2023-2033, USD (Million)
- 14.7.FPGA Market: By Region, 2023-2033, USD (Million)
- 14.7.1.Middle East and Africa
- 14.7.1.1. GCC
- 14.7.1.1.1. FPGA Market: By , 2023-2033, USD (Million)
- 14.7.1.1.2. FPGA Market: By Configuration, 2023-2033, USD (Million)
- 14.7.1.1.3. FPGA Market: By Node Size, 2023-2033, USD (Million)
- 14.7.1.1.4. FPGA Market: By Architecture, 2023-2033, USD (Million)
- 14.7.1.1.5. FPGA Market: By End-use Industry, 2023-2033, USD (Million)
- 14.7.1.2. Africa
- 14.7.1.2.1. FPGA Market: By , 2023-2033, USD (Million)
- 14.7.1.2.2. FPGA Market: By Configuration, 2023-2033, USD (Million)
- 14.7.1.2.3. FPGA Market: By Node Size, 2023-2033, USD (Million)
- 14.7.1.2.4. FPGA Market: By Architecture, 2023-2033, USD (Million)
- 14.7.1.2.5. FPGA Market: By End-use Industry, 2023-2033, USD (Million)
- 14.7.1.3. Rest of Middle East and Africa
- 14.7.1.3.1. FPGA Market: By , 2023-2033, USD (Million)
- 14.7.1.3.2. FPGA Market: By Configuration, 2023-2033, USD (Million)
- 14.7.1.3.3. FPGA Market: By Node Size, 2023-2033, USD (Million)
- 14.7.1.3.4. FPGA Market: By Architecture, 2023-2033, USD (Million)
- 14.7.1.3.5. FPGA Market: By End-use Industry, 2023-2033, USD (Million)
- 14.7.1.1. GCC
- 14.7.1.Middle East and Africa
15. Company Profile
- 15.1. Xilinx, Inc.
- 15.1.1. Company Overview
- 15.1.2. Financial Performance
- 15.1.3. Product Portfolio
- 15.1.4. Strategic Initiatives
- 15.2. Intel Corporation
- 15.2.1. Company Overview
- 15.2.2. Financial Performance
- 15.2.3. Product Portfolio
- 15.2.4. Strategic Initiatives
- 15.3. Microchip Technology Inc.
- 15.3.1. Company Overview
- 15.3.2. Financial Performance
- 15.3.3. Product Portfolio
- 15.3.4. Strategic Initiatives
- 15.4. Lattice Semiconductor Corporation
- 15.4.1. Company Overview
- 15.4.2. Financial Performance
- 15.4.3. Product Portfolio
- 15.4.4. Strategic Initiatives
- 15.5. QuickLogic Corporation
- 15.5.1. Company Overview
- 15.5.2. Financial Performance
- 15.5.3. Product Portfolio
- 15.5.4. Strategic Initiatives
- 15.6. Efinix Inc.
- 15.6.1. Company Overview
- 15.6.2. Financial Performance
- 15.6.3. Product Portfolio
- 15.6.4. Strategic Initiatives
- 15.7. Flex Logix Technologies
- 15.7.1. Company Overview
- 15.7.2. Financial Performance
- 15.7.3. Product Portfolio
- 15.7.4. Strategic Initiatives
- 15.8. GOWIN Semiconductor Corporation
- 15.8.1. Company Overview
- 15.8.2. Financial Performance
- 15.8.3. Product Portfolio
- 15.8.4. Strategic Initiatives
- 15.9. Achronix Semiconductor Corporation
- 15.9.1. Company Overview
- 15.9.2. Financial Performance
- 15.9.3. Product Portfolio
- 15.9.4. Strategic Initiatives
- 15.10. Microsemi Corporation
- 15.10.1. Company Overview
- 15.10.2. Financial Performance
- 15.10.3. Product Portfolio
- 15.10.4. Strategic Initiatives
- 15.11. S2C, Inc.
- 15.11.1. Company Overview
- 15.11.2. Financial Performance
- 15.11.3. Product Portfolio
- 15.11.4. Strategic Initiatives
