|
|
市場調査レポート
商品コード
1422201
腫瘍溶解性ウイルス療法市場-2023~2031年の成長、将来展望、競合分析Oncolytic Virus Therapy Market - Growth, Future Prospects and Competitive Analysis, 2023 - 2031 |
||||||

|
|||||||
|
|||||||


| 腫瘍溶解性ウイルス療法市場-2023~2031年の成長、将来展望、競合分析 |
|
出版日: 2024年01月11日
発行: Acute Market Reports
ページ情報: 英文 114 Pages
納期: 即日から翌営業日
|

全表示
- 概要
- 図表
- 目次
腫瘍溶解性ウイルス療法市場は、技術革新、アプリケーションの拡大、堅調な調査状況により、2024年から2032年の予測期間中にCAGR 27.5%で成長すると予測されます。遺伝子組換え型オンコライトウイルス、オンコライト野生型ウイルス、固形がんやメラノーマを対象とした標的アプリケーションなどが、治療の展望を規定しています。課題は山積しているもの、ヘルスケア専門家、研究者、業界リーダーの総力を結集することで、市場は楽観的な軌道をたどっています。地域力学は、市場の将来形成における北米とアジア太平洋地域の重要性を強調しています。競合動向は、主要プレイヤーの戦略的策略を浮き彫りにし、市場の競争力を強化しています。予測期間中、腫瘍溶解性ウイルス療法市場は変革的な市場開拓が予想され、がん領域における重要性が再確認されます。
腫瘍溶解性ウイルス療法市場の主な市場促進要因
遺伝子組換えがん溶解ウイルスの進歩
遺伝子操作された腫瘍溶解ウイルスの使用は、がん治療における画期的なフロンティアです。これらのウイルスは、健康な組織を温存しながらがん細胞を選択的に標的とするように調整されており、従来の治療に伴う副作用を最小限に抑えています。腫瘍特異性を高め、複製能力を増強し、治療ペイロードを増強した新興国産ウイルスの市場開拓が、この市場を前進させています。臨床試験から得られた証拠は、さまざまながん種におけるこれらのウイルスの有効性と安全性を浮き彫りにしており、研究者や臨床医の間に楽観的な見方が広まっています。
治療革新の原動力となるがん細胞野生型ウイルス
固形がんとメラノーマへの応用が中心
腫瘍溶解性ウイルス療法市場における抑制要因
均一な治療反応を得るための課題
有望な進歩にもかかわらず、多様な患者集団で均一な治療反応を達成するには課題が残る。個々人の免疫反応のばらつき、腫瘍の不均一性、がんの進化という性質が、腫瘍溶解性ウイルス療法の治療成果を標準化する上での障害となっています。ある種の患者では反応性が限定的であることを示す証拠が指摘されており、個別化された治療戦略の必要性が強調されています。これらの課題を克服するには、ウイルス、腫瘍、免疫系間の複雑な相互作用をより深く理解する必要があります。
市場セグメンテーション分析
ウイルスタイプ別セグメンテーション遺伝子工学的に設計された腫瘍溶解性ウイルスと腫瘍溶解性野生型ウイルスの比較(500ワード)
2023年の腫瘍溶解性ウイルス療法市場では、遺伝子組み換えウイルスと野生型ウイルスの両方が大きな収益シェアを占めました。遺伝子組換えウイルスは、がん治療のカスタマイズ化の動向を反映して、圧倒的なシェアを占めています。2024年から2032年にかけての予測では、持続的な研究努力と実証された有効性により、遺伝子組み換えウイルスの優位が続くと予想されます。しかし、特にウイルス本来の特性が治療目標と合致する用途では、溶媒和野生型ウイルスが勢いを増すと予想されます。
用途別セグメンテーション:固形がんvs.メラノーマ(500ワード)
2023年に腫瘍溶解性ウイルス療法の主要用途として浮上したのは、さまざまながん種を網羅する固形がんでした。予測期間中の収益とCAGRが最も高いのは固形がんへの応用であり、この治療法の広範な有用性が強調されています。困難な治療状況を特徴とするメラノーマは大幅な成長を示し、CAGRの点でトップランナーに位置づけられます。免疫原性を含むメラノーマの明確な特性は、腫瘍溶解性ウイルス療法の理想的な候補となっています。
最終用途別のセグメンテーション病院、専門クリニック、がん研究機関(500文字)
病院、専門クリニック、がん研究機関は、腫瘍溶解性ウイルス療法市場を形成する主要なエンドユーザーです。2023年には、総合的ながん治療の提供における中心的役割を反映し、病院が売上高とCAGRの両方で首位に立った。専門クリニックは、がん治療への集中的なアプローチによって高いCAGRを示しました。技術革新の最前線にあるがん研究機関は、治療の発展に大きく貢献しました。本予測は、専門クリニックが顕著な成長を遂げる中、病院が持続的に優位を占めていることを強調しています。
北米が世界のリーダーであり続ける
強固なヘルスケアインフラと充実した研究投資を有する北米は、2023年の売上高比率とCAGRの両方で首位となった。同地域の技術革新と共同研究イニシアティブへの取り組みは、市場拡大に有利な環境を育んでいます。欧州は、CAGRは高いもの、売上高比率では北米にやや遅れをとった。アジア太平洋地域は、ヘルスケア市場の急成長と先進治療に対する意識の高まりが顕著で、CAGRが最も高く、未開拓の可能性を示しています。中東・アフリカ地域の市場貢献は小幅であり、地域力学に影響を与える要因は多岐にわたる。
市場シェア拡大のための戦略的提携
製薬大手や革新的なバイオテクノロジー企業を含む主要企業は、戦略的提携や技術的進歩によって形成された市場情勢をナビゲートしています。2023年、これらのプレーヤーは多額の収益を計上し、2024年から2032年までの予測はさらなる成長を示しています。Amgen、Genelux Corporation、Oncolytics Biotech、Sorrento Therapeutics、Transgene SA、Daiichi Sankyo Company、Shanghai Sunway Biotech Co Ltd、Takara Bio Inc.、PsiOxus Therapeutics、SillaJen Inc.、ViroCureなどの大手企業は、多様な戦略を採用して市場での地位を維持しています。研究機関との提携、製品ポートフォリオの拡大、臨床試験への投資などは、これらの企業を前進させる重要な戦略的イニシアチブです。
目次
第1章 序文
- レポート内容
- 報告書の目的
- 対象者
- 主な提供商品
- 市場セグメンテーション
- 調査手法
- フェーズⅠ-二次調査
- フェーズⅡ-一次調査
- フェーズⅢ-有識者レビュー
- 前提条件
- 採用したアプローチ
第2章 エグゼクティブサマリー
第3章 腫瘍溶解性ウイルス療法市場:競合分析
- 主要ベンダーの市場での位置付け
- ベンダーが採用する戦略
- 主要な産業戦略
- ティア分析:2023 vs 2032
第4章 腫瘍溶解性ウイルス療法市場:マクロ分析と市場力学
- イントロダクション
- 世界の腫瘍溶解性ウイルス療法市場金額 2022-2032
- 市場力学
- 市場促進要因
- 市場抑制要因
- 主な課題
- 主な機会
- 促進要因と抑制要因の影響分析
- シーソー分析
- ポーターのファイブフォースモデル
- サプライヤーパワー
- バイヤーパワー
- 代替品の脅威
- 新規参入業者の脅威
- 競争企業間の敵対関係
- PESTEL分析
- 政治的情勢
- 経済情勢
- テクノロジーの情勢
- 法的情勢
- 社会的情勢
第5章 腫瘍溶解性ウイルス療法市場:ウイルスタイプ別 2022-2032
- 市場概要
- 成長・収益分析:2023 vs 2032
- 数量と価格の分析2022-2032
- 市場セグメンテーション
- 遺伝子組み換え腫瘍溶解性ウイルス
- 単純ヘルペスウイルス
- アデノウイルス
- ワクシニアウイルス
- 腫瘍溶解性野生型ウイルス
- レオウイルス
- ニューカッスル病ウイルス
- 水疱性口内炎ウイルス
- 遺伝子組み換え腫瘍溶解性ウイルス
第6章 腫瘍溶解性ウイルス療法市場:用途別 2022-2032
- 市場概要
- 成長・収益分析:2023 vs 2032
- 数量と価格の分析2022-2032
- 市場セグメンテーション
- 固形腫瘍
- 乳がん
- 前立腺がん
- 肺がん
- 膠芽腫
- 黒色腫
- 血液悪性腫瘍
- リンパ腫
- 白血病
- 骨髄腫
- 固形腫瘍
第7章 腫瘍溶解性ウイルス療法市場:最終用途別 2022-2032
- 市場概要
- 成長・収益分析:2023 vs 2032
- 数量と価格の分析2022-2032
- 市場セグメンテーション
- 病院
- 専門クリニック
- がん研究
第8章 北米の腫瘍溶解性ウイルス療法市場 2022-2032
- 市場概要
- 腫瘍溶解性ウイルス療法市場:ウイルスタイプ別 2022-2032
- 腫瘍溶解性ウイルス療法市場:用途別 2022-2032
- 腫瘍溶解性ウイルス療法市場:最終用途別 2022-2032
- 腫瘍溶解性ウイルス療法市場:地域別 2022-2032
- 北米
- 米国
- カナダ
- その他北米地域
- 北米
第9章 英国と欧州連合の腫瘍溶解性ウイルス療法市場 2022-2032
- 市場概要
- 腫瘍溶解性ウイルス療法市場:ウイルスタイプ別 2022-2032
- 腫瘍溶解性ウイルス療法市場:用途別 2022-2032
- 腫瘍溶解性ウイルス療法市場:最終用途別 2022-2032
- 腫瘍溶解性ウイルス療法市場:地域別 2022-2032
- 英国と欧州連合
- 英国
- ドイツ
- スペイン
- イタリア
- フランス
- その他欧州地域
- 英国と欧州連合
第10章 アジア太平洋の腫瘍溶解性ウイルス療法市場 2022-2032
- 市場概要
- 腫瘍溶解性ウイルス療法市場:ウイルスタイプ別 2022-2032
- 腫瘍溶解性ウイルス療法市場:用途別 2022-2032
- 腫瘍溶解性ウイルス療法市場:最終用途別 2022-2032
- 腫瘍溶解性ウイルス療法市場:地域別 2022-2032
- アジア太平洋
- 中国
- 日本
- インド
- オーストラリア
- 韓国
- その他アジア太平洋地域
- アジア太平洋
第11章 ラテンアメリカの腫瘍溶解性ウイルス療法市場 2022-2032
- 市場概要
- 腫瘍溶解性ウイルス療法市場:ウイルスタイプ別 2022-2032
- 腫瘍溶解性ウイルス療法市場:用途別 2022-2032
- 腫瘍溶解性ウイルス療法市場:最終用途別 2022-2032
- 腫瘍溶解性ウイルス療法市場:地域別 2022-2032
- ラテンアメリカ
- ブラジル
- メキシコ
- その他ラテンアメリカ地域
- ラテンアメリカ
第12章 中東・アフリカの腫瘍溶解性ウイルス療法市場 2022-2032
- 市場概要
- 腫瘍溶解性ウイルス療法市場:ウイルスタイプ別 2022-2032
- 腫瘍溶解性ウイルス療法市場:用途別 2022-2032
- 腫瘍溶解性ウイルス療法市場:最終用途別 2022-2032
- 腫瘍溶解性ウイルス療法市場:地域別 2022-2032
- 中東・アフリカ
- GCC
- アフリカ
- その他中東・アフリカ地域
- 中東・アフリカ
第13章 企業プロファイル
- Amgen
- Genelux Corporation
- Oncolytics Biotech
- Sorrento Therapeutics
- Transgene SA
- Daiichi Sankyo Company
- Shanghai Sunway Biotech Co Ltd
- Takara Bio Inc.
- PsiOxus Therapeutics
- SillaJen Inc.
- ViroCure
- その他の主要企業
List of Tables
- TABLE 1 Global Oncolytic Virus Therapy Market By Virus Type, 2022-2032, USD (Million)
- TABLE 2 Global Oncolytic Virus Therapy Market By Genetically Engineered Oncolytic Viruses, 2022-2032, USD (Million)
TABLE 3 Global Oncolytic Virus Therapy Market By Oncolytic Wild-type Viruses, 2022-2032, USD (Million)
TABLE 4 Global Oncolytic Virus Therapy Market By Application, 2022-2032, USD (Million)
- TABLE 5 Global Oncolytic Virus Therapy Market By Solid Tumor, 2022-2032, USD (Million)
TABLE 6 Global Oncolytic Virus Therapy Market By Melanoma, 2022-2032, USD (Million)
TABLE 7 Global Oncolytic Virus Therapy Market By End Use, 2022-2032, USD (Million)
- TABLE 8 North America Oncolytic Virus Therapy Market By Virus Type, 2022-2032, USD (Million)
- TABLE 9 North America Oncolytic Virus Therapy Market By Genetically Engineered Oncolytic Viruses, 2022-2032, USD (Million)
TABLE 10 North America Oncolytic Virus Therapy Market By Oncolytic Wild-type Viruses, 2022-2032, USD (Million)
TABLE 11 North America Oncolytic Virus Therapy Market By Application, 2022-2032, USD (Million)
- TABLE 12 North America Oncolytic Virus Therapy Market By Solid Tumor, 2022-2032, USD (Million)
TABLE 13 North America Oncolytic Virus Therapy Market By Melanoma, 2022-2032, USD (Million)
TABLE 14 North America Oncolytic Virus Therapy Market By End Use, 2022-2032, USD (Million)
- TABLE 15 U.S. Oncolytic Virus Therapy Market By Virus Type, 2022-2032, USD (Million)
- TABLE 16 U.S. Oncolytic Virus Therapy Market By Genetically Engineered Oncolytic Viruses, 2022-2032, USD (Million)
TABLE 17 U.S. Oncolytic Virus Therapy Market By Oncolytic Wild-type Viruses, 2022-2032, USD (Million)
TABLE 18 U.S. Oncolytic Virus Therapy Market By Application, 2022-2032, USD (Million)
- TABLE 19 U.S. Oncolytic Virus Therapy Market By Solid Tumor, 2022-2032, USD (Million)
TABLE 20 U.S. Oncolytic Virus Therapy Market By Melanoma, 2022-2032, USD (Million)
TABLE 21 U.S. Oncolytic Virus Therapy Market By End Use, 2022-2032, USD (Million)
- TABLE 22 Canada Oncolytic Virus Therapy Market By Virus Type, 2022-2032, USD (Million)
- TABLE 23 Canada Oncolytic Virus Therapy Market By Genetically Engineered Oncolytic Viruses, 2022-2032, USD (Million)
TABLE 24 Canada Oncolytic Virus Therapy Market By Oncolytic Wild-type Viruses, 2022-2032, USD (Million)
TABLE 25 Canada Oncolytic Virus Therapy Market By Application, 2022-2032, USD (Million)
- TABLE 26 Canada Oncolytic Virus Therapy Market By Solid Tumor, 2022-2032, USD (Million)
TABLE 27 Canada Oncolytic Virus Therapy Market By Melanoma, 2022-2032, USD (Million)
TABLE 28 Canada Oncolytic Virus Therapy Market By End Use, 2022-2032, USD (Million)
- TABLE 29 Rest of North America Oncolytic Virus Therapy Market By Virus Type, 2022-2032, USD (Million)
- TABLE 30 Rest of North America Oncolytic Virus Therapy Market By Genetically Engineered Oncolytic Viruses, 2022-2032, USD (Million)
TABLE 31 Rest of North America Oncolytic Virus Therapy Market By Oncolytic Wild-type Viruses, 2022-2032, USD (Million)
TABLE 32 Rest of North America Oncolytic Virus Therapy Market By Application, 2022-2032, USD (Million)
- TABLE 33 Rest of North America Oncolytic Virus Therapy Market By Solid Tumor, 2022-2032, USD (Million)
TABLE 34 Rest of North America Oncolytic Virus Therapy Market By Melanoma, 2022-2032, USD (Million)
TABLE 35 Rest of North America Oncolytic Virus Therapy Market By End Use, 2022-2032, USD (Million)
- TABLE 36 UK and European Union Oncolytic Virus Therapy Market By Virus Type, 2022-2032, USD (Million)
- TABLE 37 UK and European Union Oncolytic Virus Therapy Market By Genetically Engineered Oncolytic Viruses, 2022-2032, USD (Million)
TABLE 38 UK and European Union Oncolytic Virus Therapy Market By Oncolytic Wild-type Viruses, 2022-2032, USD (Million)
TABLE 39 UK and European Union Oncolytic Virus Therapy Market By Application, 2022-2032, USD (Million)
- TABLE 40 UK and European Union Oncolytic Virus Therapy Market By Solid Tumor, 2022-2032, USD (Million)
TABLE 41 UK and European Union Oncolytic Virus Therapy Market By Melanoma, 2022-2032, USD (Million)
TABLE 42 UK and European Union Oncolytic Virus Therapy Market By End Use, 2022-2032, USD (Million)
- TABLE 43 UK Oncolytic Virus Therapy Market By Virus Type, 2022-2032, USD (Million)
- TABLE 44 UK Oncolytic Virus Therapy Market By Genetically Engineered Oncolytic Viruses, 2022-2032, USD (Million)
TABLE 45 UK Oncolytic Virus Therapy Market By Oncolytic Wild-type Viruses, 2022-2032, USD (Million)
TABLE 46 UK Oncolytic Virus Therapy Market By Application, 2022-2032, USD (Million)
- TABLE 47 UK Oncolytic Virus Therapy Market By Solid Tumor, 2022-2032, USD (Million)
TABLE 48 UK Oncolytic Virus Therapy Market By Melanoma, 2022-2032, USD (Million)
TABLE 49 UK Oncolytic Virus Therapy Market By End Use, 2022-2032, USD (Million)
- TABLE 50 Germany Oncolytic Virus Therapy Market By Virus Type, 2022-2032, USD (Million)
- TABLE 51 Germany Oncolytic Virus Therapy Market By Genetically Engineered Oncolytic Viruses, 2022-2032, USD (Million)
TABLE 52 Germany Oncolytic Virus Therapy Market By Oncolytic Wild-type Viruses, 2022-2032, USD (Million)
TABLE 53 Germany Oncolytic Virus Therapy Market By Application, 2022-2032, USD (Million)
- TABLE 54 Germany Oncolytic Virus Therapy Market By Solid Tumor, 2022-2032, USD (Million)
TABLE 55 Germany Oncolytic Virus Therapy Market By Melanoma, 2022-2032, USD (Million)
TABLE 56 Germany Oncolytic Virus Therapy Market By End Use, 2022-2032, USD (Million)
- TABLE 57 Spain Oncolytic Virus Therapy Market By Virus Type, 2022-2032, USD (Million)
- TABLE 58 Spain Oncolytic Virus Therapy Market By Genetically Engineered Oncolytic Viruses, 2022-2032, USD (Million)
TABLE 59 Spain Oncolytic Virus Therapy Market By Oncolytic Wild-type Viruses, 2022-2032, USD (Million)
TABLE 60 Spain Oncolytic Virus Therapy Market By Application, 2022-2032, USD (Million)
- TABLE 61 Spain Oncolytic Virus Therapy Market By Solid Tumor, 2022-2032, USD (Million)
TABLE 62 Spain Oncolytic Virus Therapy Market By Melanoma, 2022-2032, USD (Million)
TABLE 63 Spain Oncolytic Virus Therapy Market By End Use, 2022-2032, USD (Million)
- TABLE 64 Italy Oncolytic Virus Therapy Market By Virus Type, 2022-2032, USD (Million)
- TABLE 65 Italy Oncolytic Virus Therapy Market By Genetically Engineered Oncolytic Viruses, 2022-2032, USD (Million)
TABLE 66 Italy Oncolytic Virus Therapy Market By Oncolytic Wild-type Viruses, 2022-2032, USD (Million)
TABLE 67 Italy Oncolytic Virus Therapy Market By Application, 2022-2032, USD (Million)
- TABLE 68 Italy Oncolytic Virus Therapy Market By Solid Tumor, 2022-2032, USD (Million)
TABLE 69 Italy Oncolytic Virus Therapy Market By Melanoma, 2022-2032, USD (Million)
TABLE 70 Italy Oncolytic Virus Therapy Market By End Use, 2022-2032, USD (Million)
- TABLE 71 France Oncolytic Virus Therapy Market By Virus Type, 2022-2032, USD (Million)
- TABLE 72 France Oncolytic Virus Therapy Market By Genetically Engineered Oncolytic Viruses, 2022-2032, USD (Million)
TABLE 73 France Oncolytic Virus Therapy Market By Oncolytic Wild-type Viruses, 2022-2032, USD (Million)
TABLE 74 France Oncolytic Virus Therapy Market By Application, 2022-2032, USD (Million)
- TABLE 75 France Oncolytic Virus Therapy Market By Solid Tumor, 2022-2032, USD (Million)
TABLE 76 France Oncolytic Virus Therapy Market By Melanoma, 2022-2032, USD (Million)
TABLE 77 France Oncolytic Virus Therapy Market By End Use, 2022-2032, USD (Million)
- TABLE 78 Rest of Europe Oncolytic Virus Therapy Market By Virus Type, 2022-2032, USD (Million)
- TABLE 79 Rest of Europe Oncolytic Virus Therapy Market By Genetically Engineered Oncolytic Viruses, 2022-2032, USD (Million)
TABLE 80 Rest of Europe Oncolytic Virus Therapy Market By Oncolytic Wild-type Viruses, 2022-2032, USD (Million)
TABLE 81 Rest of Europe Oncolytic Virus Therapy Market By Application, 2022-2032, USD (Million)
- TABLE 82 Rest of Europe Oncolytic Virus Therapy Market By Solid Tumor, 2022-2032, USD (Million)
TABLE 83 Rest of Europe Oncolytic Virus Therapy Market By Melanoma, 2022-2032, USD (Million)
TABLE 84 Rest of Europe Oncolytic Virus Therapy Market By End Use, 2022-2032, USD (Million)
- TABLE 85 Asia Oncolytic Virus Therapy Market By Virus Type, 2022-2032, USD (Million)
- TABLE 86 Asia Oncolytic Virus Therapy Market By Genetically Engineered Oncolytic Viruses, 2022-2032, USD (Million)
TABLE 87 Asia Oncolytic Virus Therapy Market By Oncolytic Wild-type Viruses, 2022-2032, USD (Million)
TABLE 88 Asia Oncolytic Virus Therapy Market By Application, 2022-2032, USD (Million)
- TABLE 89 Asia Oncolytic Virus Therapy Market By Solid Tumor, 2022-2032, USD (Million)
TABLE 90 Asia Oncolytic Virus Therapy Market By Melanoma, 2022-2032, USD (Million)
TABLE 91 Asia Oncolytic Virus Therapy Market By End Use, 2022-2032, USD (Million)
- TABLE 92 China Oncolytic Virus Therapy Market By Virus Type, 2022-2032, USD (Million)
- TABLE 93 China Oncolytic Virus Therapy Market By Genetically Engineered Oncolytic Viruses, 2022-2032, USD (Million)
TABLE 94 China Oncolytic Virus Therapy Market By Oncolytic Wild-type Viruses, 2022-2032, USD (Million)
TABLE 95 China Oncolytic Virus Therapy Market By Application, 2022-2032, USD (Million)
- TABLE 96 China Oncolytic Virus Therapy Market By Solid Tumor, 2022-2032, USD (Million)
TABLE 97 China Oncolytic Virus Therapy Market By Melanoma, 2022-2032, USD (Million)
TABLE 98 China Oncolytic Virus Therapy Market By End Use, 2022-2032, USD (Million)
- TABLE 99 Japan Oncolytic Virus Therapy Market By Virus Type, 2022-2032, USD (Million)
- TABLE 100 Japan Oncolytic Virus Therapy Market By Genetically Engineered Oncolytic Viruses, 2022-2032, USD (Million)
TABLE 101 Japan Oncolytic Virus Therapy Market By Oncolytic Wild-type Viruses, 2022-2032, USD (Million)
TABLE 102 Japan Oncolytic Virus Therapy Market By Application, 2022-2032, USD (Million)
- TABLE 103 Japan Oncolytic Virus Therapy Market By Solid Tumor, 2022-2032, USD (Million)
TABLE 104 Japan Oncolytic Virus Therapy Market By Melanoma, 2022-2032, USD (Million)
TABLE 105 Japan Oncolytic Virus Therapy Market By End Use, 2022-2032, USD (Million)
- TABLE 106 India Oncolytic Virus Therapy Market By Virus Type, 2022-2032, USD (Million)
- TABLE 107 India Oncolytic Virus Therapy Market By Genetically Engineered Oncolytic Viruses, 2022-2032, USD (Million)
TABLE 108 India Oncolytic Virus Therapy Market By Oncolytic Wild-type Viruses, 2022-2032, USD (Million)
TABLE 109 India Oncolytic Virus Therapy Market By Application, 2022-2032, USD (Million)
- TABLE 110 India Oncolytic Virus Therapy Market By Solid Tumor, 2022-2032, USD (Million)
TABLE 111 India Oncolytic Virus Therapy Market By Melanoma, 2022-2032, USD (Million)
TABLE 112 India Oncolytic Virus Therapy Market By End Use, 2022-2032, USD (Million)
- TABLE 113 Australia Oncolytic Virus Therapy Market By Virus Type, 2022-2032, USD (Million)
- TABLE 114 Australia Oncolytic Virus Therapy Market By Genetically Engineered Oncolytic Viruses, 2022-2032, USD (Million)
TABLE 115 Australia Oncolytic Virus Therapy Market By Oncolytic Wild-type Viruses, 2022-2032, USD (Million)
TABLE 116 Australia Oncolytic Virus Therapy Market By Application, 2022-2032, USD (Million)
- TABLE 117 Australia Oncolytic Virus Therapy Market By Solid Tumor, 2022-2032, USD (Million)
TABLE 118 Australia Oncolytic Virus Therapy Market By Melanoma, 2022-2032, USD (Million)
TABLE 119 Australia Oncolytic Virus Therapy Market By End Use, 2022-2032, USD (Million)
- TABLE 120 South Korea Oncolytic Virus Therapy Market By Virus Type, 2022-2032, USD (Million)
- TABLE 121 South Korea Oncolytic Virus Therapy Market By Genetically Engineered Oncolytic Viruses, 2022-2032, USD (Million)
TABLE 122 South Korea Oncolytic Virus Therapy Market By Oncolytic Wild-type Viruses, 2022-2032, USD (Million)
TABLE 123 South Korea Oncolytic Virus Therapy Market By Application, 2022-2032, USD (Million)
- TABLE 124 South Korea Oncolytic Virus Therapy Market By Solid Tumor, 2022-2032, USD (Million)
TABLE 125 South Korea Oncolytic Virus Therapy Market By Melanoma, 2022-2032, USD (Million)
TABLE 126 South Korea Oncolytic Virus Therapy Market By End Use, 2022-2032, USD (Million)
- TABLE 127 Latin America Oncolytic Virus Therapy Market By Virus Type, 2022-2032, USD (Million)
- TABLE 128 Latin America Oncolytic Virus Therapy Market By Genetically Engineered Oncolytic Viruses, 2022-2032, USD (Million)
TABLE 129 Latin America Oncolytic Virus Therapy Market By Oncolytic Wild-type Viruses, 2022-2032, USD (Million)
TABLE 130 Latin America Oncolytic Virus Therapy Market By Application, 2022-2032, USD (Million)
- TABLE 131 Latin America Oncolytic Virus Therapy Market By Solid Tumor, 2022-2032, USD (Million)
TABLE 132 Latin America Oncolytic Virus Therapy Market By Melanoma, 2022-2032, USD (Million)
TABLE 133 Latin America Oncolytic Virus Therapy Market By End Use, 2022-2032, USD (Million)
- TABLE 134 Brazil Oncolytic Virus Therapy Market By Virus Type, 2022-2032, USD (Million)
- TABLE 135 Brazil Oncolytic Virus Therapy Market By Genetically Engineered Oncolytic Viruses, 2022-2032, USD (Million)
TABLE 136 Brazil Oncolytic Virus Therapy Market By Oncolytic Wild-type Viruses, 2022-2032, USD (Million)
TABLE 137 Brazil Oncolytic Virus Therapy Market By Application, 2022-2032, USD (Million)
- TABLE 138 Brazil Oncolytic Virus Therapy Market By Solid Tumor, 2022-2032, USD (Million)
TABLE 139 Brazil Oncolytic Virus Therapy Market By Melanoma, 2022-2032, USD (Million)
TABLE 140 Brazil Oncolytic Virus Therapy Market By End Use, 2022-2032, USD (Million)
- TABLE 141 Mexico Oncolytic Virus Therapy Market By Virus Type, 2022-2032, USD (Million)
- TABLE 142 Mexico Oncolytic Virus Therapy Market By Genetically Engineered Oncolytic Viruses, 2022-2032, USD (Million)
TABLE 143 Mexico Oncolytic Virus Therapy Market By Oncolytic Wild-type Viruses, 2022-2032, USD (Million)
TABLE 144 Mexico Oncolytic Virus Therapy Market By Application, 2022-2032, USD (Million)
- TABLE 145 Mexico Oncolytic Virus Therapy Market By Solid Tumor, 2022-2032, USD (Million)
TABLE 146 Mexico Oncolytic Virus Therapy Market By Melanoma, 2022-2032, USD (Million)
TABLE 147 Mexico Oncolytic Virus Therapy Market By End Use, 2022-2032, USD (Million)
- TABLE 148 Rest of Latin America Oncolytic Virus Therapy Market By Virus Type, 2022-2032, USD (Million)
- TABLE 149 Rest of Latin America Oncolytic Virus Therapy Market By Genetically Engineered Oncolytic Viruses, 2022-2032, USD (Million)
TABLE 150 Rest of Latin America Oncolytic Virus Therapy Market By Oncolytic Wild-type Viruses, 2022-2032, USD (Million)
TABLE 151 Rest of Latin America Oncolytic Virus Therapy Market By Application, 2022-2032, USD (Million)
- TABLE 152 Rest of Latin America Oncolytic Virus Therapy Market By Solid Tumor, 2022-2032, USD (Million)
TABLE 153 Rest of Latin America Oncolytic Virus Therapy Market By Melanoma, 2022-2032, USD (Million)
TABLE 154 Rest of Latin America Oncolytic Virus Therapy Market By End Use, 2022-2032, USD (Million)
- TABLE 155 Middle East and Africa Oncolytic Virus Therapy Market By Virus Type, 2022-2032, USD (Million)
- TABLE 156 Middle East and Africa Oncolytic Virus Therapy Market By Genetically Engineered Oncolytic Viruses, 2022-2032, USD (Million)
TABLE 157 Middle East and Africa Oncolytic Virus Therapy Market By Oncolytic Wild-type Viruses, 2022-2032, USD (Million)
TABLE 158 Middle East and Africa Oncolytic Virus Therapy Market By Application, 2022-2032, USD (Million)
- TABLE 159 Middle East and Africa Oncolytic Virus Therapy Market By Solid Tumor, 2022-2032, USD (Million)
TABLE 160 Middle East and Africa Oncolytic Virus Therapy Market By Melanoma, 2022-2032, USD (Million)
TABLE 161 Middle East and Africa Oncolytic Virus Therapy Market By End Use, 2022-2032, USD (Million)
- TABLE 162 GCC Oncolytic Virus Therapy Market By Virus Type, 2022-2032, USD (Million)
- TABLE 163 GCC Oncolytic Virus Therapy Market By Genetically Engineered Oncolytic Viruses, 2022-2032, USD (Million)
TABLE 164 GCC Oncolytic Virus Therapy Market By Oncolytic Wild-type Viruses, 2022-2032, USD (Million)
TABLE 165 GCC Oncolytic Virus Therapy Market By Application, 2022-2032, USD (Million)
- TABLE 166 GCC Oncolytic Virus Therapy Market By Solid Tumor, 2022-2032, USD (Million)
TABLE 167 GCC Oncolytic Virus Therapy Market By Melanoma, 2022-2032, USD (Million)
TABLE 168 GCC Oncolytic Virus Therapy Market By End Use, 2022-2032, USD (Million)
- TABLE 169 Africa Oncolytic Virus Therapy Market By Virus Type, 2022-2032, USD (Million)
- TABLE 170 Africa Oncolytic Virus Therapy Market By Genetically Engineered Oncolytic Viruses, 2022-2032, USD (Million)
TABLE 171 Africa Oncolytic Virus Therapy Market By Oncolytic Wild-type Viruses, 2022-2032, USD (Million)
TABLE 172 Africa Oncolytic Virus Therapy Market By Application, 2022-2032, USD (Million)
- TABLE 173 Africa Oncolytic Virus Therapy Market By Solid Tumor, 2022-2032, USD (Million)
TABLE 174 Africa Oncolytic Virus Therapy Market By Melanoma, 2022-2032, USD (Million)
TABLE 175 Africa Oncolytic Virus Therapy Market By End Use, 2022-2032, USD (Million)
- TABLE 176 Rest of Middle East and Africa Oncolytic Virus Therapy Market By Virus Type, 2022-2032, USD (Million)
- TABLE 177 Rest of Middle East and Africa Oncolytic Virus Therapy Market By Genetically Engineered Oncolytic Viruses, 2022-2032, USD (Million)
TABLE 178 Rest of Middle East and Africa Oncolytic Virus Therapy Market By Oncolytic Wild-type Viruses, 2022-2032, USD (Million)
TABLE 179 Rest of Middle East and Africa Oncolytic Virus Therapy Market By Application, 2022-2032, USD (Million)
- TABLE 180 Rest of Middle East and Africa Oncolytic Virus Therapy Market By Solid Tumor, 2022-2032, USD (Million)
TABLE 181 Rest of Middle East and Africa Oncolytic Virus Therapy Market By Melanoma, 2022-2032, USD (Million)
TABLE 182 Rest of Middle East and Africa Oncolytic Virus Therapy Market By End Use, 2022-2032, USD (Million)
List of Figures
- FIG. 1 Global Oncolytic Virus Therapy Market: Market Coverage
- FIG. 2 Research Methodology and Data Sources
- FIG. 3 Market Size Estimation - Top Down & Bottom-Up Approach
- FIG. 4 Global Oncolytic Virus Therapy Market: Quality Assurance
- FIG. 5 Global Oncolytic Virus Therapy Market, By Virus Type, 2023
- FIG. 6 Global Oncolytic Virus Therapy Market, By Application, 2023
- FIG. 7 Global Oncolytic Virus Therapy Market, By End Use, 2023
- FIG. 8 Global Oncolytic Virus Therapy Market, By Geography, 2023
- FIG. 9 Market Geographical Opportunity Matrix - Global Oncolytic Virus Therapy Market, 2023
FIG. 10Market Positioning of Key Oncolytic Virus Therapy Market Players, 2023
FIG. 11Global Oncolytic Virus Therapy Market - Tier Analysis - Percentage of Revenues by Tier Level, 2023 Versus 2032
- FIG. 12 Global Oncolytic Virus Therapy Market, By Virus Type, 2023 Vs 2032, %
- FIG. 13 Global Oncolytic Virus Therapy Market, By Application, 2023 Vs 2032, %
- FIG. 14 Global Oncolytic Virus Therapy Market, By End Use, 2023 Vs 2032, %
- FIG. 15 U.S. Oncolytic Virus Therapy Market (US$ Million), 2022 - 2032
- FIG. 16 Canada Oncolytic Virus Therapy Market (US$ Million), 2022 - 2032
- FIG. 17 Rest of North America Oncolytic Virus Therapy Market (US$ Million), 2022 - 2032
- FIG. 18 UK Oncolytic Virus Therapy Market (US$ Million), 2022 - 2032
- FIG. 19 Germany Oncolytic Virus Therapy Market (US$ Million), 2022 - 2032
- FIG. 20 Spain Oncolytic Virus Therapy Market (US$ Million), 2022 - 2032
- FIG. 21 Italy Oncolytic Virus Therapy Market (US$ Million), 2022 - 2032
- FIG. 22 France Oncolytic Virus Therapy Market (US$ Million), 2022 - 2032
- FIG. 23 Rest of Europe Oncolytic Virus Therapy Market (US$ Million), 2022 - 2032
- FIG. 24 China Oncolytic Virus Therapy Market (US$ Million), 2022 - 2032
- FIG. 25 Japan Oncolytic Virus Therapy Market (US$ Million), 2022 - 2032
- FIG. 26 India Oncolytic Virus Therapy Market (US$ Million), 2022 - 2032
- FIG. 27 Australia Oncolytic Virus Therapy Market (US$ Million), 2022 - 2032
- FIG. 28 South Korea Oncolytic Virus Therapy Market (US$ Million), 2022 - 2032
- FIG. 29 Rest of Asia Oncolytic Virus Therapy Market (US$ Million), 2022 - 2032
- FIG. 30 Brazil Oncolytic Virus Therapy Market (US$ Million), 2022 - 2032
- FIG. 31 Mexico Oncolytic Virus Therapy Market (US$ Million), 2022 - 2032
- FIG. 32 Rest of Latin America Oncolytic Virus Therapy Market (US$ Million), 2022 - 2032
- FIG. 33 GCC Oncolytic Virus Therapy Market (US$ Million), 2022 - 2032
- FIG. 34 Africa Oncolytic Virus Therapy Market (US$ Million), 2022 - 2032
- FIG. 35 Rest of Middle East and Africa Oncolytic Virus Therapy Market (US$ Million), 2022 - 2032
The oncolytic virus therapy market is expected to grow at a CAGR of 27.5% during the forecast period of 2024 to 2032, driven by technological innovations, expanding applications, and a robust research landscape. Genetically engineered oncolytic viruses, oncolytic wild-type viruses, and targeted applications for solid tumors and melanoma define the therapeutic landscape. While challenges persist, the market's trajectory is optimistic, propelled by the collective efforts of healthcare professionals, researchers, and industry leaders. Regional dynamics underscore the importance of North America and the Asia-Pacific in shaping the market's future. Competitive trends highlight the strategic maneuvers of key players, reinforcing the market's competitive nature. As the forecast period unfolds, the oncolytic virus therapy market is expected to witness transformative developments, reaffirming its significance in the oncology domain.
Key Market Drivers of Oncolytic Virus Therapy Market
Advances in Genetically Engineered Oncolytic Viruses
The use of genetically engineered oncolytic viruses represents a groundbreaking frontier in cancer treatment. These viruses are tailored to selectively target cancer cells while sparing healthy tissues, minimizing side effects associated with traditional therapies. The development of engineered viruses with enhanced tumor specificity, increased replication capacity, and augmented therapeutic payloads has propelled the market forward. Evidence from clinical trials highlights the efficacy and safety of these viruses in various cancer types, fostering optimism among researchers and clinicians.
Oncolytic Wild-type Viruses Driving Therapeutic Innovation
Beyond engineered viruses, oncolytic wild-type viruses have emerged as key players in oncolytic virus therapy. These naturally occurring viruses exhibit inherent oncolytic properties, and ongoing research is uncovering their potential in cancer treatment. The adaptability of wild-type viruses to different tumor microenvironments and their ability to induce immunogenic cell death contribute to their therapeutic effectiveness. Evidence-based studies showcase the diverse applications of oncolytic wild-type viruses, providing a compelling narrative for their continued integration into cancer treatment protocols.
Application Focus on Solid Tumors and Melanoma
The increasing prevalence of solid tumors, coupled with the rising incidence of melanoma, has directed the spotlight toward these specific applications of oncolytic virus therapy. Clinical successes in treating solid tumors, including breast, lung, and colorectal cancers, underscore the therapy's potential across a spectrum of malignancies. Melanoma, notorious for its resistance to conventional treatments, has witnessed remarkable responses to oncolytic virus therapy, paving the way for tailored interventions. An in-depth analysis of market data from 2023 reveals the dominance of solid tumor applications, with melanoma exhibiting the highest CAGR during the forecast period.
Restraints in Oncolytic Virus Therapy Market
Challenges in Achieving Uniform Therapeutic Responses
Despite the promising advancements, challenges persist in achieving uniform therapeutic responses across diverse patient populations. Variability in individual immune responses, tumor heterogeneity, and the evolving nature of cancer present hurdles in standardizing oncolytic virus therapy outcomes. Evidence points to instances where certain patients exhibit limited responsiveness, emphasizing the need for personalized treatment strategies. Overcoming these challenges requires a deeper understanding of the complex interactions between viruses, tumors, and the immune system.
Market Segmentation Analysis
Segmentation by Virus Type Segmentation: Genetically Engineered Oncolytic Viruses vs. Oncolytic Wild-type Viruses (500 words)
In 2023, the oncolytic virus therapy market witnessed a significant revenue share from both genetically engineered and wild-type viruses. Genetically engineered viruses dominated the landscape, reflecting the ongoing trend of customization in cancer treatment. The forecast for 2024 to 2032 anticipates a continued dominance of genetically engineered viruses, driven by sustained research efforts and their proven efficacy. However, oncolytic wild-type viruses are expected to gain momentum, particularly in applications where their natural attributes align with therapeutic goals.
Segmentation by Application: Solid Tumor vs. Melanoma (500 words)
Solid tumors, encompassing a range of cancer types, emerged as the primary application of oncolytic virus therapy in 2023. The highest revenue and CAGR during the forecast period are attributed to solid tumor applications, emphasizing the broad utility of this therapy. Melanoma, characterized by its challenging treatment landscape, exhibited substantial growth, positioning itself as a frontrunner in terms of CAGR. The distinct characteristics of melanoma, including its immunogenic nature, make it an ideal candidate for oncolytic virus therapy.
Segmentation by End-use: Hospitals, Specialty Clinics, Cancer Research Institutes (500 words)
Hospitals, specialty clinics, and cancer research institutes constitute key end-users shaping the oncolytic virus therapy market. In 2023, hospitals led in both revenue generation and CAGR, reflecting their central role in providing comprehensive cancer care. Specialty clinics demonstrated a high CAGR, driven by their focused approach to cancer treatment. Cancer research institutes, at the forefront of innovation, contributed significantly to the therapy's development. The forecast underscores the sustained dominance of hospitals, with specialty clinics experiencing notable growth.
North America Remains the Global Leader
North America, with its robust healthcare infrastructure and substantial research investments, led in both the highest revenue percentage and CAGR in 2023. The region's commitment to technological innovation and collaborative research initiatives fosters a favorable environment for market expansion. Europe, while demonstrating a commendable CAGR, lagged slightly behind North America in revenue percentage. The Asia-Pacific region, marked by burgeoning healthcare markets and increasing awareness of advanced therapies, exhibited the highest CAGR, indicating untapped potential. The Middle East and Africa contributed modestly to the market, with diverse factors influencing regional dynamics.
Strategic Collaborations to Increase Market Share
Top players in the oncolytic virus therapy market, including pharmaceutical giants and innovative biotech firms, navigate a landscape shaped by strategic collaborations and technological advancements. In 2023, these players reported substantial revenues, with projections for the 2024 to 2032 period indicating further growth. Leading companies, such as Amgen, Genelux Corporation, Oncolytics Biotech, Sorrento Therapeutics, Transgene SA, Daiichi Sankyo Company, Shanghai Sunway Biotech Co Ltd, Takara Bio Inc., PsiOxus Therapeutics, SillaJen Inc. and ViroCure, employed diverse strategies to maintain their market positions. Collaborations with research institutions, expansion of product portfolios, and investments in clinical trials are key strategic initiatives driving these companies forward.
Historical & Forecast Period
This study report represents analysis of each segment from 2021 to 2031 considering 2022 as the base year. Compounded Annual Growth Rate (CAGR) for each of the respective segments estimated for the forecast period of 2023 to 2031.
The current report comprises of quantitative market estimations for each micro market for every geographical region and qualitative market analysis such as micro and macro environment analysis, market trends, competitive intelligence, segment analysis, porters five force model, top winning strategies, top investment markets, emerging trends and technological analysis, case studies, strategic conclusions and recommendations and other key market insights.
Research Methodology
The complete research study was conducted in three phases, namely: secondary research, primary research, and expert panel review. key data point that enables the estimation ofOncolytic Virus Therapy market are as follows:
- Research and development budgets of manufacturers and government spending
- Revenues of key companies in the market segment
- Number of end users and consumption volume, price and value.
Geographical revenues generate by countries considered in the report:
Micro and macro environment factors that are currently influencing the Oncolytic Virus Therapy market and their expected impact during the forecast period.
Market forecast was performed through proprietary software that analyzes various qualitative and quantitative factors. Growth rate and CAGR were estimated through intensive secondary and primary research. Data triangulation across various data points provides accuracy across various analyzed market segments in the report. Application of both top down and bottom-up approach for validation of market estimation assures logical, methodical and mathematical consistency of the quantitative data.
Market Segmentation
Virus Type
- Genetically Engineered Oncolytic Viruses
- Herpes Simplex Virus
- Adenovirus
- Vaccinia Virus
- Oncolytic Wild-type Viruses
- Reovirus
- Newcastle Disease Virus
- Vesicular Stomatitis Virus
Application
- Solid Tumor
- Breast Cancer
- Prostate Cancer
- Lung Cancer
- Glioblastoma
- Melanoma
- Hematological Malignancies
- Lymphoma
- Leukemia
- Myeloma
End Use
- Hospitals
- Specialty Clinics
- Cancer Research Institutes
Region Segment (2021-2031; US$ Million)
- North America
- U.S.
- Canada
- Rest of North America
- UK and European Union
- UK
- Germany
- Spain
- Italy
- France
- Rest of Europe
- Asia Pacific
- China
- Japan
- India
- Australia
- South Korea
- Rest of Asia Pacific
- Latin America
- Brazil
- Mexico
- Rest of Latin America
- Middle East and Africa
- GCC
- Africa
- Rest of Middle East and Africa
Key questions answered in this report:
- What are the key micro and macro environmental factors that are impacting the growth of Oncolytic Virus Therapy market?
- What are the key investment pockets with respect to product segments and geographies currently and during the forecast period?
- Estimated forecast and market projections up to 2031.
- Which segment accounts for the fastest CAGR during the forecast period?
- Which market segment holds a larger market share and why?
- Are low and middle-income economies investing in the Oncolytic Virus Therapy market?
- Which is the largest regional market for Oncolytic Virus Therapy market?
- What are the market trends and dynamics in emerging markets such as Asia Pacific, Latin America, and Middle East & Africa?
- Which are the key trends driving Oncolytic Virus Therapy market growth?
- Who are the key competitors and what are their key strategies to enhance their market presence in the Oncolytic Virus Therapy market worldwide?
Table of Contents
1. Preface
- 1.1. Report Description
- 1.1.1. Purpose of the Report
- 1.1.2. Target Audience
- 1.1.3. Key Offerings
- 1.2. Market Segmentation
- 1.3. Research Methodology
- 1.3.1. Phase I - Secondary Research
- 1.3.2. Phase II - Primary Research
- 1.3.3. Phase III - Expert Panel Review
- 1.3.4. Assumptions
- 1.3.5. Approach Adopted
2. Executive Summary
- 2.1. Market Snapshot: Global Oncolytic Virus Therapy Market
- 2.2. Global Oncolytic Virus Therapy Market, By Virus Type, 2023 (US$ Million)
- 2.3. Global Oncolytic Virus Therapy Market, By Application, 2023 (US$ Million)
- 2.4. Global Oncolytic Virus Therapy Market, By End Use, 2023 (US$ Million)
- 2.5. Global Oncolytic Virus Therapy Market, By Geography, 2023 (US$ Million)
- 2.6. Attractive Investment Proposition by Geography, 2023
3. Oncolytic Virus Therapy Market: Competitive Analysis
- 3.1. Market Positioning of Key Oncolytic Virus Therapy Market Vendors
- 3.2. Strategies Adopted by Oncolytic Virus Therapy Market Vendors
- 3.3. Key Industry Strategies
- 3.4. Tier Analysis 2023 Versus 2032
4. Oncolytic Virus Therapy Market: Macro Analysis & Market Dynamics
- 4.1. Introduction
- 4.2. Global Oncolytic Virus Therapy Market Value, 2022 - 2032, (US$ Million)
- 4.3. Market Dynamics
- 4.3.1. Market Drivers
- 4.3.2. Market Restraints
- 4.3.3. Key Challenges
- 4.3.4. Key Opportunities
- 4.4. Impact Analysis of Drivers and Restraints
- 4.5. See-Saw Analysis
- 4.6. Porter's Five Force Model
- 4.6.1. Supplier Power
- 4.6.2. Buyer Power
- 4.6.3. Threat Of Substitutes
- 4.6.4. Threat Of New Entrants
- 4.6.5. Competitive Rivalry
- 4.7. PESTEL Analysis
- 4.7.1. Political Landscape
- 4.7.2. Economic Landscape
- 4.7.3. Technology Landscape
- 4.7.4. Legal Landscape
- 4.7.5. Social Landscape
5. Oncolytic Virus Therapy Market: By Virus Type, 2022-2032, USD (Million)
- 5.1. Market Overview
- 5.2. Growth & Revenue Analysis: 2023 Versus 2032
- 5.3. Volume and Pricing Analysis, 2022-2032
- 5.4. Market Segmentation
- 5.4.1. Genetically Engineered Oncolytic Viruses
- 5.4.1.1. Herpes Simplex Virus
- 5.4.1.2. Adenovirus
- 5.4.1.3. Vaccinia Virus
- 5.4.2. Oncolytic Wild-type Viruses
- 5.4.2.1. Reovirus
- 5.4.2.2. Newcastle Disease Virus
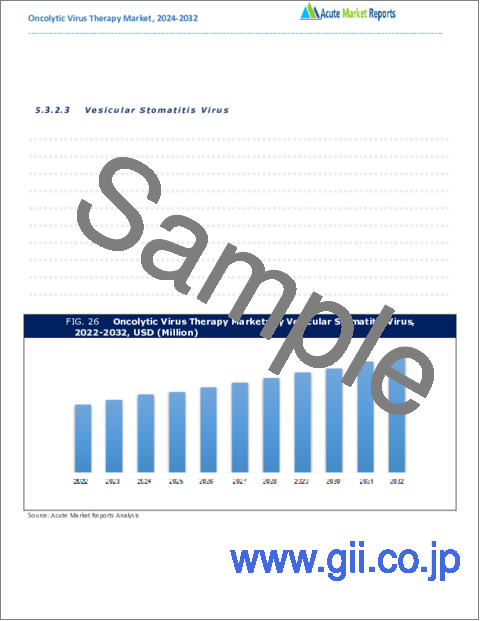
- 5.4.2.3. Vesicular Stomatitis Virus
- 5.4.1. Genetically Engineered Oncolytic Viruses
6. Oncolytic Virus Therapy Market: By Application, 2022-2032, USD (Million)
- 6.1. Market Overview
- 6.2. Growth & Revenue Analysis: 2023 Versus 2032
- 6.3. Volume and Pricing Analysis, 2022-2032
- 6.4. Market Segmentation
- 6.4.1. Solid Tumor
- 6.4.1.1. Breast Cancer
- 6.4.1.2. Prostate Cancer
- 6.4.1.3. Lung Cancer
- 6.4.1.4. Glioblastoma
- 6.4.2. Melanoma
- 6.4.2.1. Hematological Malignancies
- 6.4.2.2. Lymphoma
- 6.4.2.3. Leukemia
- 6.4.2.4. Myeloma
- 6.4.1. Solid Tumor
7. Oncolytic Virus Therapy Market: By End Use, 2022-2032, USD (Million)
- 7.1. Market Overview
- 7.2. Growth & Revenue Analysis: 2023 Versus 2032
- 7.3. Volume and Pricing Analysis, 2022-2032
- 7.4. Market Segmentation
- 7.4.1. Hospitals
- 7.4.2. Specialty Clinics
- 7.4.3. Cancer Research Institutes
8. North America Oncolytic Virus Therapy Market, 2022-2032, USD (Million)
- 8.1. Market Overview
- 8.2. Oncolytic Virus Therapy Market: By Virus Type, 2022-2032, USD (Million)
- 8.3. Oncolytic Virus Therapy Market: By Application, 2022-2032, USD (Million)
- 8.4. Oncolytic Virus Therapy Market: By End Use, 2022-2032, USD (Million)
- 8.5.Oncolytic Virus Therapy Market: By Region, 2022-2032, USD (Million)
- 8.5.1.North America
- 8.5.1.1. U.S.
- 8.5.1.1.1. Oncolytic Virus Therapy Market: By Virus Type, 2022-2032, USD (Million)
- 8.5.1.1.2. Oncolytic Virus Therapy Market: By Application, 2022-2032, USD (Million)
- 8.5.1.1.3. Oncolytic Virus Therapy Market: By End Use, 2022-2032, USD (Million)
- 8.5.1.2. Canada
- 8.5.1.2.1. Oncolytic Virus Therapy Market: By Virus Type, 2022-2032, USD (Million)
- 8.5.1.2.2. Oncolytic Virus Therapy Market: By Application, 2022-2032, USD (Million)
- 8.5.1.2.3. Oncolytic Virus Therapy Market: By End Use, 2022-2032, USD (Million)
- 8.5.1.3. Rest of North America
- 8.5.1.3.1. Oncolytic Virus Therapy Market: By Virus Type, 2022-2032, USD (Million)
- 8.5.1.3.2. Oncolytic Virus Therapy Market: By Application, 2022-2032, USD (Million)
- 8.5.1.3.3. Oncolytic Virus Therapy Market: By End Use, 2022-2032, USD (Million)
- 8.5.1.1. U.S.
- 8.5.1.North America
9. UK and European Union Oncolytic Virus Therapy Market, 2022-2032, USD (Million)
- 9.1. Market Overview
- 9.2. Oncolytic Virus Therapy Market: By Virus Type, 2022-2032, USD (Million)
- 9.3. Oncolytic Virus Therapy Market: By Application, 2022-2032, USD (Million)
- 9.4. Oncolytic Virus Therapy Market: By End Use, 2022-2032, USD (Million)
- 9.5.Oncolytic Virus Therapy Market: By Region, 2022-2032, USD (Million)
- 9.5.1.UK and European Union
- 9.5.1.1. UK
- 9.5.1.1.1. Oncolytic Virus Therapy Market: By Virus Type, 2022-2032, USD (Million)
- 9.5.1.1.2. Oncolytic Virus Therapy Market: By Application, 2022-2032, USD (Million)
- 9.5.1.1.3. Oncolytic Virus Therapy Market: By End Use, 2022-2032, USD (Million)
- 9.5.1.2. Germany
- 9.5.1.2.1. Oncolytic Virus Therapy Market: By Virus Type, 2022-2032, USD (Million)
- 9.5.1.2.2. Oncolytic Virus Therapy Market: By Application, 2022-2032, USD (Million)
- 9.5.1.2.3. Oncolytic Virus Therapy Market: By End Use, 2022-2032, USD (Million)
- 9.5.1.3. Spain
- 9.5.1.3.1. Oncolytic Virus Therapy Market: By Virus Type, 2022-2032, USD (Million)
- 9.5.1.3.2. Oncolytic Virus Therapy Market: By Application, 2022-2032, USD (Million)
- 9.5.1.3.3. Oncolytic Virus Therapy Market: By End Use, 2022-2032, USD (Million)
- 9.5.1.4. Italy
- 9.5.1.4.1. Oncolytic Virus Therapy Market: By Virus Type, 2022-2032, USD (Million)
- 9.5.1.4.2. Oncolytic Virus Therapy Market: By Application, 2022-2032, USD (Million)
- 9.5.1.4.3. Oncolytic Virus Therapy Market: By End Use, 2022-2032, USD (Million)
- 9.5.1.5. France
- 9.5.1.5.1. Oncolytic Virus Therapy Market: By Virus Type, 2022-2032, USD (Million)
- 9.5.1.5.2. Oncolytic Virus Therapy Market: By Application, 2022-2032, USD (Million)
- 9.5.1.5.3. Oncolytic Virus Therapy Market: By End Use, 2022-2032, USD (Million)
- 9.5.1.6. Rest of Europe
- 9.5.1.6.1. Oncolytic Virus Therapy Market: By Virus Type, 2022-2032, USD (Million)
- 9.5.1.6.2. Oncolytic Virus Therapy Market: By Application, 2022-2032, USD (Million)
- 9.5.1.6.3. Oncolytic Virus Therapy Market: By End Use, 2022-2032, USD (Million)
- 9.5.1.1. UK
- 9.5.1.UK and European Union
10. Asia Pacific Oncolytic Virus Therapy Market, 2022-2032, USD (Million)
- 10.1. Market Overview
- 10.2. Oncolytic Virus Therapy Market: By Virus Type, 2022-2032, USD (Million)
- 10.3. Oncolytic Virus Therapy Market: By Application, 2022-2032, USD (Million)
- 10.4. Oncolytic Virus Therapy Market: By End Use, 2022-2032, USD (Million)
- 10.5.Oncolytic Virus Therapy Market: By Region, 2022-2032, USD (Million)
- 10.5.1.Asia Pacific
- 10.5.1.1. China
- 10.5.1.1.1. Oncolytic Virus Therapy Market: By Virus Type, 2022-2032, USD (Million)
- 10.5.1.1.2. Oncolytic Virus Therapy Market: By Application, 2022-2032, USD (Million)
- 10.5.1.1.3. Oncolytic Virus Therapy Market: By End Use, 2022-2032, USD (Million)
- 10.5.1.2. Japan
- 10.5.1.2.1. Oncolytic Virus Therapy Market: By Virus Type, 2022-2032, USD (Million)
- 10.5.1.2.2. Oncolytic Virus Therapy Market: By Application, 2022-2032, USD (Million)
- 10.5.1.2.3. Oncolytic Virus Therapy Market: By End Use, 2022-2032, USD (Million)
- 10.5.1.3. India
- 10.5.1.3.1. Oncolytic Virus Therapy Market: By Virus Type, 2022-2032, USD (Million)
- 10.5.1.3.2. Oncolytic Virus Therapy Market: By Application, 2022-2032, USD (Million)
- 10.5.1.3.3. Oncolytic Virus Therapy Market: By End Use, 2022-2032, USD (Million)
- 10.5.1.4. Australia
- 10.5.1.4.1. Oncolytic Virus Therapy Market: By Virus Type, 2022-2032, USD (Million)
- 10.5.1.4.2. Oncolytic Virus Therapy Market: By Application, 2022-2032, USD (Million)
- 10.5.1.4.3. Oncolytic Virus Therapy Market: By End Use, 2022-2032, USD (Million)
- 10.5.1.5. South Korea
- 10.5.1.5.1. Oncolytic Virus Therapy Market: By Virus Type, 2022-2032, USD (Million)
- 10.5.1.5.2. Oncolytic Virus Therapy Market: By Application, 2022-2032, USD (Million)
- 10.5.1.5.3. Oncolytic Virus Therapy Market: By End Use, 2022-2032, USD (Million)
- 10.5.1.6. Rest of Asia Pacific
- 10.5.1.6.1. Oncolytic Virus Therapy Market: By Virus Type, 2022-2032, USD (Million)
- 10.5.1.6.2. Oncolytic Virus Therapy Market: By Application, 2022-2032, USD (Million)
- 10.5.1.6.3. Oncolytic Virus Therapy Market: By End Use, 2022-2032, USD (Million)
- 10.5.1.1. China
- 10.5.1.Asia Pacific
11. Latin America Oncolytic Virus Therapy Market, 2022-2032, USD (Million)
- 11.1. Market Overview
- 11.2. Oncolytic Virus Therapy Market: By Virus Type, 2022-2032, USD (Million)
- 11.3. Oncolytic Virus Therapy Market: By Application, 2022-2032, USD (Million)
- 11.4. Oncolytic Virus Therapy Market: By End Use, 2022-2032, USD (Million)
- 11.5.Oncolytic Virus Therapy Market: By Region, 2022-2032, USD (Million)
- 11.5.1.Latin America
- 11.5.1.1. Brazil
- 11.5.1.1.1. Oncolytic Virus Therapy Market: By Virus Type, 2022-2032, USD (Million)
- 11.5.1.1.2. Oncolytic Virus Therapy Market: By Application, 2022-2032, USD (Million)
- 11.5.1.1.3. Oncolytic Virus Therapy Market: By End Use, 2022-2032, USD (Million)
- 11.5.1.2. Mexico
- 11.5.1.2.1. Oncolytic Virus Therapy Market: By Virus Type, 2022-2032, USD (Million)
- 11.5.1.2.2. Oncolytic Virus Therapy Market: By Application, 2022-2032, USD (Million)
- 11.5.1.2.3. Oncolytic Virus Therapy Market: By End Use, 2022-2032, USD (Million)
- 11.5.1.3. Rest of Latin America
- 11.5.1.3.1. Oncolytic Virus Therapy Market: By Virus Type, 2022-2032, USD (Million)
- 11.5.1.3.2. Oncolytic Virus Therapy Market: By Application, 2022-2032, USD (Million)
- 11.5.1.3.3. Oncolytic Virus Therapy Market: By End Use, 2022-2032, USD (Million)
- 11.5.1.1. Brazil
- 11.5.1.Latin America
12. Middle East and Africa Oncolytic Virus Therapy Market, 2022-2032, USD (Million)
- 12.1. Market Overview
- 12.2. Oncolytic Virus Therapy Market: By Virus Type, 2022-2032, USD (Million)
- 12.3. Oncolytic Virus Therapy Market: By Application, 2022-2032, USD (Million)
- 12.4. Oncolytic Virus Therapy Market: By End Use, 2022-2032, USD (Million)
- 12.5.Oncolytic Virus Therapy Market: By Region, 2022-2032, USD (Million)
- 12.5.1.Middle East and Africa
- 12.5.1.1. GCC
- 12.5.1.1.1. Oncolytic Virus Therapy Market: By Virus Type, 2022-2032, USD (Million)
- 12.5.1.1.2. Oncolytic Virus Therapy Market: By Application, 2022-2032, USD (Million)
- 12.5.1.1.3. Oncolytic Virus Therapy Market: By End Use, 2022-2032, USD (Million)
- 12.5.1.2. Africa
- 12.5.1.2.1. Oncolytic Virus Therapy Market: By Virus Type, 2022-2032, USD (Million)
- 12.5.1.2.2. Oncolytic Virus Therapy Market: By Application, 2022-2032, USD (Million)
- 12.5.1.2.3. Oncolytic Virus Therapy Market: By End Use, 2022-2032, USD (Million)
- 12.5.1.3. Rest of Middle East and Africa
- 12.5.1.3.1. Oncolytic Virus Therapy Market: By Virus Type, 2022-2032, USD (Million)
- 12.5.1.3.2. Oncolytic Virus Therapy Market: By Application, 2022-2032, USD (Million)
- 12.5.1.3.3. Oncolytic Virus Therapy Market: By End Use, 2022-2032, USD (Million)
- 12.5.1.1. GCC
- 12.5.1.Middle East and Africa
13. Company Profile
- 13.1. Amgen
- 13.1.1. Company Overview
- 13.1.2. Financial Performance
- 13.1.3. Product Portfolio
- 13.1.4. Strategic Initiatives
- 13.2. Genelux Corporation
- 13.2.1. Company Overview
- 13.2.2. Financial Performance
- 13.2.3. Product Portfolio
- 13.2.4. Strategic Initiatives
- 13.3. Oncolytics Biotech
- 13.3.1. Company Overview
- 13.3.2. Financial Performance
- 13.3.3. Product Portfolio
- 13.3.4. Strategic Initiatives
- 13.4. Sorrento Therapeutics
- 13.4.1. Company Overview
- 13.4.2. Financial Performance
- 13.4.3. Product Portfolio
- 13.4.4. Strategic Initiatives
- 13.5. Transgene SA
- 13.5.1. Company Overview
- 13.5.2. Financial Performance
- 13.5.3. Product Portfolio
- 13.5.4. Strategic Initiatives
- 13.6. Daiichi Sankyo Company
- 13.6.1. Company Overview
- 13.6.2. Financial Performance
- 13.6.3. Product Portfolio
- 13.6.4. Strategic Initiatives
- 13.7. Shanghai Sunway Biotech Co Ltd
- 13.7.1. Company Overview
- 13.7.2. Financial Performance
- 13.7.3. Product Portfolio
- 13.7.4. Strategic Initiatives
- 13.8. Takara Bio Inc.
- 13.8.1. Company Overview
- 13.8.2. Financial Performance
- 13.8.3. Product Portfolio
- 13.8.4. Strategic Initiatives
- 13.9. PsiOxus Therapeutics
- 13.9.1. Company Overview
- 13.9.2. Financial Performance
- 13.9.3. Product Portfolio
- 13.9.4. Strategic Initiatives
- 13.10. SillaJen Inc.
- 13.10.1. Company Overview
- 13.10.2. Financial Performance
- 13.10.3. Product Portfolio
- 13.10.4. Strategic Initiatives
- 13.11. ViroCure
- 13.11.1. Company Overview
- 13.11.2. Financial Performance
- 13.11.3. Product Portfolio
- 13.11.4. Strategic Initiatives
- 13.12. Other Notable Players
- 13.12.1. Company Overview
- 13.12.2. Financial Performance
- 13.12.3. Product Portfolio
- 13.12.4. Strategic Initiatives
