|
|
市場調査レポート
商品コード
1402949
仮想発電所市場- 成長、将来展望、競合分析、2024年~2032年Virtual Power Plant Market - Growth, Future Prospects and Competitive Analysis, 2024 - 2032 |
||||||
|
|
|||||||
|
|||||||


| 仮想発電所市場- 成長、将来展望、競合分析、2024年~2032年 |
|
出版日: 2023年12月20日
発行: Acute Market Reports
ページ情報: 英文 111 Pages
納期: 即日から翌営業日
|

- 全表示
- 概要
- 図表
- 目次
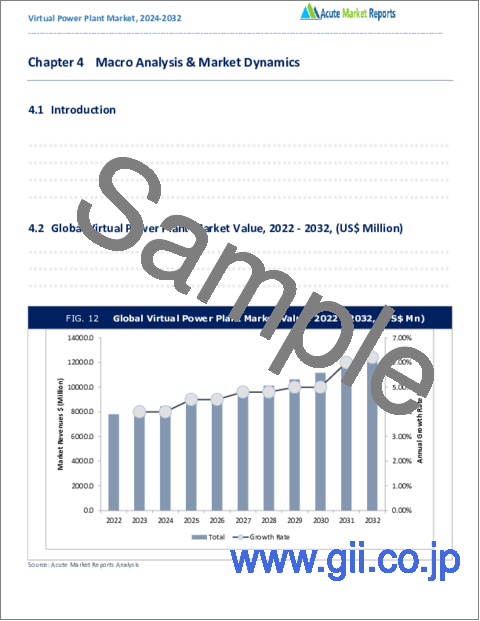
仮想発電所(VPP)市場は、エネルギー産業において急成長している分野であり、グリッド管理とエネルギー生成のための革新的なソリューションを提供しています。VPP市場は、2024年から2032年の予測期間中にCAGR 30%で成長すると予想されています。VPPは、再生可能エネルギーへの移行、送電網の信頼性、コストの最適化に不可欠です。規制や市場の障壁が課題となる一方で、VPPはエネルギー管理のソリューションとして注目を集め続けています。競合動向は、既存プレーヤーがエネルギー市場の進化する需要に対応し、より持続可能で強靭なグリッドへの移行をサポートするのに有利な立場にあることを示唆しています。
再生可能エネルギーの統合
太陽光や風力といった再生可能エネルギーのエネルギーミックスへの統合が進んでいることは、VPP市場の主要な促進要因です。VPPは、分散型エネルギー資源(DER)を集約し、その利用を最適化することで、こうした断続的なエネルギー源の効率的な管理を可能にします。この原動力は、再生可能エネルギーへの世界のシフトと、需要と供給のバランスをとるための効果的なグリッド管理の必要性によって支えられています。この原動力の証拠は、再生可能エネルギーをグリッドに統合するためにVPPの採用が拡大していることに見ることができます。
送電網の回復力と信頼性
送電網の信頼性と回復力は、エネルギー産業において最も重要です。VPPは、DERや分散型エネルギー資産を活用することで、ピーク需要時や不測の混乱時に送電網のバランスを取り、送電網の安定性を高める。この原動力は、特に異常気象に見舞われやすい地域で、送電網の信頼性に対する関心が高まり、送電網の回復力を高めるためにVPPが採用されていることからも明らかです。
エネルギーコストの最適化
エネルギーコストの最適化は、VPP導入の重要な原動力です。VPPは、ピーク時の電力コストを相殺するためにDERや蓄電システムを活用することで、エネルギーコストの削減に貢献します。この原動力は、電気料金の高騰と、企業や消費者がエネルギー支出を管理し削減する必要性によって支えられています。この原動力の証拠は、様々な分野でのVPP展開によって達成されたコスト削減に見ることができます。
規制と市場の障壁
VPP市場は、規制の枠組みや市場の障壁に関する課題に直面しています。VPPの導入には、複雑な規制や市場構造を理解する必要があり、それが迅速な導入の妨げになることが多いです。この抑制要因は、VPPプロジェクトが規制上の障害や市場参入障壁に直面し、導入が遅れたケースに見られます。
技術別(デマンドレスポンス、分散型発電、混合資産):予測期間中、デマンドレスポンスが大きなビジネスチャンスをもたらす
2024年のVPP市場では、デマンドレスポンスと分散型発電を組み合わせたミックスド・アセットVPPが大きな収益を上げました。しかし、2024年から2032年までの予測期間では、デマンドレスポンスVPPが最も高い年間平均成長率(CAGR)を示すと予想されます。これは、グリッドの最適化のために需要側の柔軟性を活用することに重点が置かれていることを示しています。
エンドユーザー用途別(産業・商業、住宅):産業・商業分野が市場を独占
2024年には、さまざまなエンドユーザーアプリケーションが市場の収益に貢献しました。特筆すべきは、産業・商業分野が2024年に最も高い収益を上げたことです。2024年から2032年までの期間を展望すると、住宅セクターのCAGRが最も高くなると予測されます。この変化は、住宅用VPPへの関心の高まりと、住宅所有者にエネルギー管理の権限を与える可能性を反映しています。
北米が世界のリーダーであり続ける
VPP市場は、明確な地理的動向を示しています。2024年には、北米が収益面でリードし、市場に大きく貢献します。2024年の売上高比率が最も高い地域は北米でした。しかし、2024年から2032年までを展望すると、アジア太平洋地域のCAGRが最も高くなると予想されます。これは、持続可能なエネルギー・ソリューションに対するニーズの高まりを背景に、アジア太平洋地域でVPPの採用が拡大していることを反映しています。
予測期間中に激化する市場競争
VPP市場の競合情勢では、Siemens AG、Schneider Electric、ABB、Toshiba Energy Systems &Solutions、Next Kraftwerke、日立製作所、Tesla、AutoGrid Systems, Inc、Limejump Limited、Sunverge Energy, Inc.、Centricaといった主要企業が一貫してリーダーシップを発揮しています。これらの業界大手は、2024年に多額の収益を報告しており、2024年から2032年までの予測期間における戦略は、技術革新、市場でのプレゼンス拡大、VPP提供強化のためのパートナーシップ構築に重点を置くと予想されます。これらの主要プレーヤー間の競合は激化しており、VPP市場の革新と成長を促進しています。
本レポートが回答する主な質問
仮想発電所市場の成長に影響を与える主なミクロおよびマクロ環境要因は何か?
現在および予測期間中の製品セグメントと地域に関する主な投資ポケットは?
2032年までの推定推計・市場予測
予測期間中に最も速いCAGRを占めるセグメントは?
市場シェアの大きいセグメントとその理由は?
中低所得国は仮想発電所市場に投資しているか?
仮想発電所市場で最大の地域市場はどこか?
アジア太平洋、ラテンアメリカ、中東・アフリカなどの新興市場における市場動向と力学は?
仮想発電所市場の成長を促進する主要動向は?
世界の仮想発電所市場で存在感を高めるための主要な競合企業とその主要戦略とは?
目次
第1章 序文
- レポート内容
- 報告書の目的
- 対象者
- 主な提供商品
- 市場セグメンテーション
- 調査手法
- フェーズⅠ-二次調査
- フェーズⅡ-一次調査
- フェーズⅢ-有識者レビュー
- 前提条件
- 採用したアプローチ
第2章 エグゼクティブサマリー
第3章 仮想発電所市場:競合分析
- 主要ベンダーの市場での位置付け
- ベンダーが採用する戦略
- 主要な産業戦略
- ティア分析:2023 vs 2031年
第4章 仮想発電所市場:マクロ分析と市場力学
- イントロダクション
- 世界の仮想発電所市場金額 2021-2031年
- 市場力学
- 市場促進要因
- 市場抑制要因
- 主な課題
- 主な機会
- 促進要因と抑制要因の影響分析
- シーソー分析
- ポーターのファイブフォースモデル
- サプライヤーパワー
- バイヤーパワー
- 代替品の脅威
- 新規参入業者の脅威
- 競争企業間の敵対関係
- PESTEL分析
- 政治的情勢
- 経済情勢
- テクノロジーの情勢
- 法的情勢
- 社会的情勢
第5章 仮想発電所市場:技術別 2022-2032年
- 市場概要
- 成長・収益分析:2023 vs 2031年
- 市場セグメンテーション
- デマンドレスポンス
- 分散型生成
- 混合資産
第6章 仮想発電所市場:エンドユーザー別 2022-2032年
- 市場概要
- 成長・収益分析:2023 vs 2031年
- 市場セグメンテーション
- 産業用および商業用
- 住宅用
第7章 北米の仮想発電所市場 2022-2032年
- 市場概要
- 仮想発電所市場:技術別 2022-2032年
- 仮想発電所市場:エンドユーザー別 2022-2032年
- 仮想発電所市場:地域別 2022-2032年
- 北米
- 米国
- カナダ
- その他北米地域
- 北米
第8章 英国と欧州連合の仮想発電所市場 2022-2032年
- 市場概要
- 仮想発電所市場:技術別 2022-2032年
- 仮想発電所市場:エンドユーザー別 2022-2032年
- 仮想発電所市場:地域別 2022-2032年
- 英国と欧州連合
- 英国
- ドイツ
- スペイン
- イタリア
- フランス
- その他欧州地域
- 英国と欧州連合
第9章 アジア太平洋の仮想発電所市場 2022-2032年
- 市場概要
- 仮想発電所市場:技術別 2022-2032年
- 仮想発電所市場:エンドユーザー別 2022-2032年
- 仮想発電所市場:地域別 2022-2032年
- アジア太平洋
- 中国
- 日本
- インド
- オーストラリア
- 韓国
- その他アジア太平洋地域
- アジア太平洋
第10章 ラテンアメリカの仮想発電所市場 2022-2032年
- 市場概要
- 仮想発電所市場:技術別 2022-2032年
- 仮想発電所市場:エンドユーザー別 2022-2032年
- 仮想発電所市場:地域別 2022-2032年
- ラテンアメリカ
- ブラジル
- メキシコ
- その他ラテンアメリカ地域
- ラテンアメリカ
第11章 中東・アフリカの仮想発電所市場 2022-2032年
- 市場概要
- 仮想発電所市場:技術別 2022-2032年
- 仮想発電所市場:エンドユーザー別 2022-2032年
- 仮想発電所市場:地域別 2022-2032年
- 中東・アフリカ
- GCC
- アフリカ
- その他中東・アフリカ地域
- 中東・アフリカ
第12章 企業プロファイル
- Siemens AG
- Schneider Electric
- ABB
- Toshiba Energy Systems & Solutions
- Next Kraftwerke
- Hitachi Ltd.
- Tesla
- AutoGrid Systems Inc
- Limejump Limited
- Sunverge Energy Inc.
- Centrica
- その他の主要企業
List of Tables
- TABLE 1 Global Virtual Power Plant Market By Technology, 2022-2032, USD (Million)
- TABLE 2 Global Virtual Power Plant Market By End-User, 2022-2032, USD (Million)
- TABLE 3 North America Virtual Power Plant Market By Technology, 2022-2032, USD (Million)
- TABLE 4 North America Virtual Power Plant Market By End-User, 2022-2032, USD (Million)
- TABLE 5 U.S. Virtual Power Plant Market By Technology, 2022-2032, USD (Million)
- TABLE 6 U.S. Virtual Power Plant Market By End-User, 2022-2032, USD (Million)
- TABLE 7 Canada Virtual Power Plant Market By Technology, 2022-2032, USD (Million)
- TABLE 8 Canada Virtual Power Plant Market By End-User, 2022-2032, USD (Million)
- TABLE 9 Rest of North America Virtual Power Plant Market By Technology, 2022-2032, USD (Million)
- TABLE 10 Rest of North America Virtual Power Plant Market By End-User, 2022-2032, USD (Million)
- TABLE 11 UK and European Union Virtual Power Plant Market By Technology, 2022-2032, USD (Million)
- TABLE 12 UK and European Union Virtual Power Plant Market By End-User, 2022-2032, USD (Million)
- TABLE 13 UK Virtual Power Plant Market By Technology, 2022-2032, USD (Million)
- TABLE 14 UK Virtual Power Plant Market By End-User, 2022-2032, USD (Million)
- TABLE 15 Germany Virtual Power Plant Market By Technology, 2022-2032, USD (Million)
- TABLE 16 Germany Virtual Power Plant Market By End-User, 2022-2032, USD (Million)
- TABLE 17 Spain Virtual Power Plant Market By Technology, 2022-2032, USD (Million)
- TABLE 18 Spain Virtual Power Plant Market By End-User, 2022-2032, USD (Million)
- TABLE 19 Italy Virtual Power Plant Market By Technology, 2022-2032, USD (Million)
- TABLE 20 Italy Virtual Power Plant Market By End-User, 2022-2032, USD (Million)
- TABLE 21 France Virtual Power Plant Market By Technology, 2022-2032, USD (Million)
- TABLE 22 France Virtual Power Plant Market By End-User, 2022-2032, USD (Million)
- TABLE 23 Rest of Europe Virtual Power Plant Market By Technology, 2022-2032, USD (Million)
- TABLE 24 Rest of Europe Virtual Power Plant Market By End-User, 2022-2032, USD (Million)
- TABLE 25 Asia Virtual Power Plant Market By Technology, 2022-2032, USD (Million)
- TABLE 26 Asia Virtual Power Plant Market By End-User, 2022-2032, USD (Million)
- TABLE 27 China Virtual Power Plant Market By Technology, 2022-2032, USD (Million)
- TABLE 28 China Virtual Power Plant Market By End-User, 2022-2032, USD (Million)
- TABLE 29 Japan Virtual Power Plant Market By Technology, 2022-2032, USD (Million)
- TABLE 30 Japan Virtual Power Plant Market By End-User, 2022-2032, USD (Million)
- TABLE 31 India Virtual Power Plant Market By Technology, 2022-2032, USD (Million)
- TABLE 32 India Virtual Power Plant Market By End-User, 2022-2032, USD (Million)
- TABLE 33 Australia Virtual Power Plant Market By Technology, 2022-2032, USD (Million)
- TABLE 34 Australia Virtual Power Plant Market By End-User, 2022-2032, USD (Million)
- TABLE 35 South Korea Virtual Power Plant Market By Technology, 2022-2032, USD (Million)
- TABLE 36 South Korea Virtual Power Plant Market By End-User, 2022-2032, USD (Million)
- TABLE 37 Latin America Virtual Power Plant Market By Technology, 2022-2032, USD (Million)
- TABLE 38 Latin America Virtual Power Plant Market By End-User, 2022-2032, USD (Million)
- TABLE 39 Brazil Virtual Power Plant Market By Technology, 2022-2032, USD (Million)
- TABLE 40 Brazil Virtual Power Plant Market By End-User, 2022-2032, USD (Million)
- TABLE 41 Mexico Virtual Power Plant Market By Technology, 2022-2032, USD (Million)
- TABLE 42 Mexico Virtual Power Plant Market By End-User, 2022-2032, USD (Million)
- TABLE 43 Rest of Latin America Virtual Power Plant Market By Technology, 2022-2032, USD (Million)
- TABLE 44 Rest of Latin America Virtual Power Plant Market By End-User, 2022-2032, USD (Million)
- TABLE 45 Middle East and Africa Virtual Power Plant Market By Technology, 2022-2032, USD (Million)
- TABLE 46 Middle East and Africa Virtual Power Plant Market By End-User, 2022-2032, USD (Million)
- TABLE 47 GCC Virtual Power Plant Market By Technology, 2022-2032, USD (Million)
- TABLE 48 GCC Virtual Power Plant Market By End-User, 2022-2032, USD (Million)
- TABLE 49 Africa Virtual Power Plant Market By Technology, 2022-2032, USD (Million)
- TABLE 50 Africa Virtual Power Plant Market By End-User, 2022-2032, USD (Million)
- TABLE 51 Rest of Middle East and Africa Virtual Power Plant Market By Technology, 2022-2032, USD (Million)
- TABLE 52 Rest of Middle East and Africa Virtual Power Plant Market By End-User, 2022-2032, USD (Million)
List of Figures
- FIG. 1 Global Virtual Power Plant Market: Market Coverage
- FIG. 2 Research Methodology and Data Sources
- FIG. 3 Market Size Estimation - Top Down & Bottom-Up Approach
- FIG. 4 Global Virtual Power Plant Market: Quality Assurance
- FIG. 5 Global Virtual Power Plant Market, By Technology, 2023
- FIG. 6 Global Virtual Power Plant Market, By End-User, 2023
- FIG. 7 Global Virtual Power Plant Market, By Geography, 2023
- FIG. 8 Market Geographical Opportunity Matrix - Global Virtual Power Plant Market, 2023
FIG. 9Market Positioning of Key Virtual Power Plant Market Players, 2023
FIG. 10Global Virtual Power Plant Market - Tier Analysis - Percentage of Revenues by Tier Level, 2023 Versus 2031
- FIG. 11 Global Virtual Power Plant Market, By Technology, 2023 Vs 2032, %
- FIG. 12 Global Virtual Power Plant Market, By End-User, 2023 Vs 2032, %
- FIG. 13 U.S. Virtual Power Plant Market (US$ Million), 2022 - 2032
- FIG. 14 Canada Virtual Power Plant Market (US$ Million), 2022 - 2032
- FIG. 15 Rest of North America Virtual Power Plant Market (US$ Million), 2022 - 2032
- FIG. 16 UK Virtual Power Plant Market (US$ Million), 2022 - 2032
- FIG. 17 Germany Virtual Power Plant Market (US$ Million), 2022 - 2032
- FIG. 18 Spain Virtual Power Plant Market (US$ Million), 2022 - 2032
- FIG. 19 Italy Virtual Power Plant Market (US$ Million), 2022 - 2032
- FIG. 20 France Virtual Power Plant Market (US$ Million), 2022 - 2032
- FIG. 21 Rest of Europe Virtual Power Plant Market (US$ Million), 2022 - 2032
- FIG. 22 China Virtual Power Plant Market (US$ Million), 2022 - 2032
- FIG. 23 Japan Virtual Power Plant Market (US$ Million), 2022 - 2032
- FIG. 24 India Virtual Power Plant Market (US$ Million), 2022 - 2032
- FIG. 25 Australia Virtual Power Plant Market (US$ Million), 2022 - 2032
- FIG. 26 South Korea Virtual Power Plant Market (US$ Million), 2022 - 2032
- FIG. 27 Rest of Asia Virtual Power Plant Market (US$ Million), 2022 - 2032
- FIG. 28 Brazil Virtual Power Plant Market (US$ Million), 2022 - 2032
- FIG. 29 Mexico Virtual Power Plant Market (US$ Million), 2022 - 2032
- FIG. 30 Rest of Latin America Virtual Power Plant Market (US$ Million), 2022 - 2032
- FIG. 31 GCC Virtual Power Plant Market (US$ Million), 2022 - 2032
- FIG. 32 Africa Virtual Power Plant Market (US$ Million), 2022 - 2032
- FIG. 33 Rest of Middle East and Africa Virtual Power Plant Market (US$ Million), 2022 - 2032
The virtual power plant (VPP) market is a burgeoning sector in the energy industry, offering innovative solutions for grid management and energy generation. The VPP market is expected to grow at a CAGR of 30% during the forecast period of 2024 to 2032. It is integral to the transition toward renewable energy, grid reliability, and cost optimization. While regulatory and market barriers pose challenges, VPPs continue to gain prominence as a solution for energy management. Competitive trends suggest that established players are well-positioned to meet the evolving demands of the energy market and support the transition to a more sustainable and resilient grid.
Renewable Energy Integration
The increasing integration of renewable energy sources, such as solar and wind, into the energy mix is a key driver of the VPP market. VPPs enable the efficient management of these intermittent energy sources by aggregating distributed energy resources (DERs) and optimizing their use. This driver is supported by the global shift toward renewable energy and the need for effective grid management to balance supply and demand. Evidence for this driver can be seen in the growing adoption of VPPs to integrate renewable energy into the grid.
Grid Resilience and Reliability
Grid reliability and resilience are paramount in the energy industry. VPPs offer enhanced grid stability by leveraging DERs and distributed energy assets to balance the grid during peak demand and unforeseen disruptions. This driver is evident in the growing concern for grid reliability, especially in regions prone to extreme weather events, and the adoption of VPPs to enhance the resilience of the grid.
Energy Cost Optimization
The optimization of energy costs is a significant driver for VPP adoption. VPPs help reduce energy expenses by utilizing DERs and energy storage systems to offset peak electricity costs. This driver is supported by the rising electricity prices and the need for businesses and consumers to manage and lower their energy expenditures. Evidence for this driver can be observed in the cost savings achieved through VPP deployment in various sectors.
Regulatory and Market Barriers
The VPP market faces challenges related to regulatory frameworks and market barriers. VPP implementation often requires navigating complex regulations and market structures that may hinder rapid adoption. Evidence for this restraint can be found in cases where VPP projects have faced regulatory obstacles or market entry barriers that slowed down their deployment.
By Technology (Demand Response, Distributed Generation, Mixed Asset): Demand Response to Promise Significant Opportunities during the Forecast Period
In 2024, the VPP market witnessed substantial revenue from Mixed Asset VPPs, which leverage a combination of demand response and distributed generation. However, during the forecast period from 2024 to 2032, Demand Response VPPs are expected to exhibit the highest Compound Annual Growth Rate (CAGR). This indicates the focus on leveraging demand-side flexibility for grid optimization.
By End-User Application (Industrial and Commercial, Residential): The Industrial and Commercial sector Dominates the Market
In 2024, various end-user applications contributed to the market's revenue. Notably, the Industrial and Commercial sectors generated the highest revenue in 2024. Looking ahead to the period from 2024 to 2032, the Residential sector is projected to have the highest CAGR. This shift reflects the growing interest in residential VPPs and their potential to empower homeowners with energy management.
North America Remains the Global Leader
The VPP market exhibits distinct geographic trends. In 2024, North America led in terms of revenue, contributing significantly to the market. The region with the highest revenue percentage in 2024 was North America. However, looking ahead to the period from 2024 to 2032, the Asia-Pacific region is expected to have the highest CAGR. This reflects the growing adoption of VPPs in the Asia-Pacific region, driven by a rising need for sustainable energy solutions.
Market Competition to Intensify during the Forecast Period
In the competitive landscape of the VPP market, top players such as Siemens AG, Schneider Electric, ABB, Toshiba Energy Systems & Solutions, Next Kraftwerke, Hitachi, Ltd., Tesla, AutoGrid Systems, Inc, Limejump Limited, Sunverge Energy, Inc. and Centrica have consistently demonstrated their leadership. These industry leaders reported substantial revenues in 2024, and their strategies for the forecast period from 2024 to 2032 are expected to focus on technology innovation, expanding market presence, and building partnerships to strengthen VPP offerings. Competition among these key players intensifies, driving innovation and growth in the VPP market.
Historical & Forecast Period
This study report represents analysis of each segment from 2022 to 2032 considering 2023 as the base year. Compounded Annual Growth Rate (CAGR) for each of the respective segments estimated for the forecast period of 2024 to 2032.
The current report comprises of quantitative market estimations for each micro market for every geographical region and qualitative market analysis such as micro and macro environment analysis, market trends, competitive intelligence, segment analysis, porters five force model, top winning strategies, top investment markets, emerging trends and technological analysis, case studies, strategic conclusions and recommendations and other key market insights.
Research Methodology
The complete research study was conducted in three phases, namely: secondary research, primary research, and expert panel review. key data point that enables the estimation ofVirtual Power Plant market are as follows:
Research and development budgets of manufacturers and government spending
Revenues of key companies in the market segment
Number of end users and consumption volume, price and value.
Geographical revenues generate by countries considered in the report:
Micro and macro environment factors that are currently influencing the Virtual Power Plant market and their expected impact during the forecast period.
Market forecast was performed through proprietary software that analyzes various qualitative and quantitative factors. Growth rate and CAGR were estimated through intensive secondary and primary research. Data triangulation across various data points provides accuracy across various analyzed market segments in the report. Application of both top down and bottom-up approach for validation of market estimation assures logical, methodical and mathematical consistency of the quantitative data.
Market Segmentation
Technology
- Demand Response
- Distributed Generation
- Mixed Asset
End-User
- Industrial and Commercial
- Residential
Region Segment (2022-2032; US$ Million)
North America
U.S.
Canada
Rest of North America
UK and European Union
UK
Germany
Spain
Italy
France
Rest of Europe
Asia Pacific
China
Japan
India
Australia
South Korea
Rest of Asia Pacific
Latin America
Brazil
Mexico
Rest of Latin America
Middle East and Africa
GCC
Africa
Rest of Middle East and Africa
Key questions answered in this report:
What are the key micro and macro environmental factors that are impacting the growth of Virtual Power Plant market?
What are the key investment pockets with respect to product segments and geographies currently and during the forecast period?
Estimated forecast and market projections up to 2032.
Which segment accounts for the fastest CAGR during the forecast period?
Which market segment holds a larger market share and why?
Are low and middle-income economies investing in the Virtual Power Plant market?
Which is the largest regional market for Virtual Power Plant market?
What are the market trends and dynamics in emerging markets such as Asia Pacific, Latin America, and Middle East & Africa?
Which are the key trends driving Virtual Power Plant market growth?
Who are the key competitors and what are their key strategies to enhance their market presence in the Virtual Power Plant market worldwide?
Table of Contents
1. Preface
- 1.1. Report Description
- 1.1.1. Purpose of the Report
- 1.1.2. Target Audience
- 1.1.3. Key Offerings
- 1.2. Market Segmentation
- 1.3. Research Methodology
- 1.3.1. Phase I - Secondary Research
- 1.3.2. Phase II - Primary Research
- 1.3.3. Phase III - Expert Panel Review
- 1.3.4. Assumptions
- 1.3.5. Approach Adopted
2. Executive Summary
- 2.1. Market Snapshot: Global Virtual Power Plant Market
- 2.2. Global Virtual Power Plant Market, By Technology, 2023 (US$ Million)
- 2.3. Global Virtual Power Plant Market, By End-User, 2023 (US$ Million)
- 2.4. Global Virtual Power Plant Market, By Geography, 2023 (US$ Million)
- 2.5. Attractive Investment Proposition by Geography, 2023
3. Virtual Power Plant Market: Competitive Analysis
- 3.1. Market Positioning of Key Virtual Power Plant Market Vendors
- 3.2. Strategies Adopted by Virtual Power Plant Market Vendors
- 3.3. Key Industry Strategies
- 3.4. Tier Analysis 2023 Versus 2031
4. Virtual Power Plant Market: Macro Analysis & Market Dynamics
- 4.1. Introduction
- 4.2. Global Virtual Power Plant Market Value, 2021 - 2031, (US$ Million)
- 4.3. Market Dynamics
- 4.3.1. Market Drivers
- 4.3.2. Market Restraints
- 4.3.3. Key Challenges
- 4.3.4. Key Opportunities
- 4.4. Impact Analysis of Drivers and Restraints
- 4.5. See-Saw Analysis
- 4.6. Porter's Five Force Model
- 4.6.1. Supplier Power
- 4.6.2. Buyer Power
- 4.6.3. Threat Of Substitutes
- 4.6.4. Threat Of New Entrants
- 4.6.5. Competitive Rivalry
- 4.7. PESTEL Analysis
- 4.7.1. Political Landscape
- 4.7.2. Economic Landscape
- 4.7.3. Technology Landscape
- 4.7.4. Legal Landscape
- 4.7.5. Social Landscape
5. Virtual Power Plant Market: By Technology, 2022-2032, USD (Million)
- 5.1. Market Overview
- 5.2. Growth & Revenue Analysis: 2023 Versus 2031
- 5.3. Market Segmentation
- 5.3.1. Demand Response
- 5.3.2. Distributed Generation
- 5.3.3. Mixed Asset
6. Virtual Power Plant Market: By End-User, 2022-2032, USD (Million)
- 6.1. Market Overview
- 6.2. Growth & Revenue Analysis: 2023 Versus 2031
- 6.3. Market Segmentation
- 6.3.1. Industrial and Commercial
- 6.3.2. Residential
7. North America Virtual Power Plant Market, 2022-2032, USD (Million)
- 7.1. Market Overview
- 7.2. Virtual Power Plant Market: By Technology, 2022-2032, USD (Million)
- 7.3. Virtual Power Plant Market: By End-User, 2022-2032, USD (Million)
- 7.4.Virtual Power Plant Market: By Region, 2022-2032, USD (Million)
- 7.4.1.North America
- 7.4.1.1. U.S.
- 7.4.1.1.1. Virtual Power Plant Market: By Technology, 2022-2032, USD (Million)
- 7.4.1.1.2. Virtual Power Plant Market: By End-User, 2022-2032, USD (Million)
- 7.4.1.2. Canada
- 7.4.1.2.1. Virtual Power Plant Market: By Technology, 2022-2032, USD (Million)
- 7.4.1.2.2. Virtual Power Plant Market: By End-User, 2022-2032, USD (Million)
- 7.4.1.3. Rest of North America
- 7.4.1.3.1. Virtual Power Plant Market: By Technology, 2022-2032, USD (Million)
- 7.4.1.3.2. Virtual Power Plant Market: By End-User, 2022-2032, USD (Million)
- 7.4.1.1. U.S.
- 7.4.1.North America
8. UK and European Union Virtual Power Plant Market, 2022-2032, USD (Million)
- 8.1. Market Overview
- 8.2. Virtual Power Plant Market: By Technology, 2022-2032, USD (Million)
- 8.3. Virtual Power Plant Market: By End-User, 2022-2032, USD (Million)
- 8.4.Virtual Power Plant Market: By Region, 2022-2032, USD (Million)
- 8.4.1.UK and European Union
- 8.4.1.1. UK
- 8.4.1.1.1. Virtual Power Plant Market: By Technology, 2022-2032, USD (Million)
- 8.4.1.1.2. Virtual Power Plant Market: By End-User, 2022-2032, USD (Million)
- 8.4.1.2. Germany
- 8.4.1.2.1. Virtual Power Plant Market: By Technology, 2022-2032, USD (Million)
- 8.4.1.2.2. Virtual Power Plant Market: By End-User, 2022-2032, USD (Million)
- 8.4.1.3. Spain
- 8.4.1.3.1. Virtual Power Plant Market: By Technology, 2022-2032, USD (Million)
- 8.4.1.3.2. Virtual Power Plant Market: By End-User, 2022-2032, USD (Million)
- 8.4.1.4. Italy
- 8.4.1.4.1. Virtual Power Plant Market: By Technology, 2022-2032, USD (Million)
- 8.4.1.4.2. Virtual Power Plant Market: By End-User, 2022-2032, USD (Million)
- 8.4.1.5. France
- 8.4.1.5.1. Virtual Power Plant Market: By Technology, 2022-2032, USD (Million)
- 8.4.1.5.2. Virtual Power Plant Market: By End-User, 2022-2032, USD (Million)
- 8.4.1.6. Rest of Europe
- 8.4.1.6.1. Virtual Power Plant Market: By Technology, 2022-2032, USD (Million)
- 8.4.1.6.2. Virtual Power Plant Market: By End-User, 2022-2032, USD (Million)
- 8.4.1.1. UK
- 8.4.1.UK and European Union
9. Asia Pacific Virtual Power Plant Market, 2022-2032, USD (Million)
- 9.1. Market Overview
- 9.2. Virtual Power Plant Market: By Technology, 2022-2032, USD (Million)
- 9.3. Virtual Power Plant Market: By End-User, 2022-2032, USD (Million)
- 9.4.Virtual Power Plant Market: By Region, 2022-2032, USD (Million)
- 9.4.1.Asia Pacific
- 9.4.1.1. China
- 9.4.1.1.1. Virtual Power Plant Market: By Technology, 2022-2032, USD (Million)
- 9.4.1.1.2. Virtual Power Plant Market: By End-User, 2022-2032, USD (Million)
- 9.4.1.2. Japan
- 9.4.1.2.1. Virtual Power Plant Market: By Technology, 2022-2032, USD (Million)
- 9.4.1.2.2. Virtual Power Plant Market: By End-User, 2022-2032, USD (Million)
- 9.4.1.3. India
- 9.4.1.3.1. Virtual Power Plant Market: By Technology, 2022-2032, USD (Million)
- 9.4.1.3.2. Virtual Power Plant Market: By End-User, 2022-2032, USD (Million)
- 9.4.1.4. Australia
- 9.4.1.4.1. Virtual Power Plant Market: By Technology, 2022-2032, USD (Million)
- 9.4.1.4.2. Virtual Power Plant Market: By End-User, 2022-2032, USD (Million)
- 9.4.1.5. South Korea
- 9.4.1.5.1. Virtual Power Plant Market: By Technology, 2022-2032, USD (Million)
- 9.4.1.5.2. Virtual Power Plant Market: By End-User, 2022-2032, USD (Million)
- 9.4.1.6. Rest of Asia Pacific
- 9.4.1.6.1. Virtual Power Plant Market: By Technology, 2022-2032, USD (Million)
- 9.4.1.6.2. Virtual Power Plant Market: By End-User, 2022-2032, USD (Million)
- 9.4.1.1. China
- 9.4.1.Asia Pacific
10. Latin America Virtual Power Plant Market, 2022-2032, USD (Million)
- 10.1. Market Overview
- 10.2. Virtual Power Plant Market: By Technology, 2022-2032, USD (Million)
- 10.3. Virtual Power Plant Market: By End-User, 2022-2032, USD (Million)
- 10.4.Virtual Power Plant Market: By Region, 2022-2032, USD (Million)
- 10.4.1.Latin America
- 10.4.1.1. Brazil
- 10.4.1.1.1. Virtual Power Plant Market: By Technology, 2022-2032, USD (Million)
- 10.4.1.1.2. Virtual Power Plant Market: By End-User, 2022-2032, USD (Million)
- 10.4.1.2. Mexico
- 10.4.1.2.1. Virtual Power Plant Market: By Technology, 2022-2032, USD (Million)
- 10.4.1.2.2. Virtual Power Plant Market: By End-User, 2022-2032, USD (Million)
- 10.4.1.3. Rest of Latin America
- 10.4.1.3.1. Virtual Power Plant Market: By Technology, 2022-2032, USD (Million)
- 10.4.1.3.2. Virtual Power Plant Market: By End-User, 2022-2032, USD (Million)
- 10.4.1.1. Brazil
- 10.4.1.Latin America
11. Middle East and Africa Virtual Power Plant Market, 2022-2032, USD (Million)
- 11.1. Market Overview
- 11.2. Virtual Power Plant Market: By Technology, 2022-2032, USD (Million)
- 11.3. Virtual Power Plant Market: By End-User, 2022-2032, USD (Million)
- 11.4.Virtual Power Plant Market: By Region, 2022-2032, USD (Million)
- 11.4.1.Middle East and Africa
- 11.4.1.1. GCC
- 11.4.1.1.1. Virtual Power Plant Market: By Technology, 2022-2032, USD (Million)
- 11.4.1.1.2. Virtual Power Plant Market: By End-User, 2022-2032, USD (Million)
- 11.4.1.2. Africa
- 11.4.1.2.1. Virtual Power Plant Market: By Technology, 2022-2032, USD (Million)
- 11.4.1.2.2. Virtual Power Plant Market: By End-User, 2022-2032, USD (Million)
- 11.4.1.3. Rest of Middle East and Africa
- 11.4.1.3.1. Virtual Power Plant Market: By Technology, 2022-2032, USD (Million)
- 11.4.1.3.2. Virtual Power Plant Market: By End-User, 2022-2032, USD (Million)
- 11.4.1.1. GCC
- 11.4.1.Middle East and Africa
12. Company Profile
- 12.1. Siemens AG
- 12.1.1. Company Overview
- 12.1.2. Financial Performance
- 12.1.3. Product Portfolio
- 12.1.4. Strategic Initiatives
- 12.2. Schneider Electric
- 12.2.1. Company Overview
- 12.2.2. Financial Performance
- 12.2.3. Product Portfolio
- 12.2.4. Strategic Initiatives
- 12.3. ABB
- 12.3.1. Company Overview
- 12.3.2. Financial Performance
- 12.3.3. Product Portfolio
- 12.3.4. Strategic Initiatives
- 12.4. Toshiba Energy Systems & Solutions
- 12.4.1. Company Overview
- 12.4.2. Financial Performance
- 12.4.3. Product Portfolio
- 12.4.4. Strategic Initiatives
- 12.5. Next Kraftwerke
- 12.5.1. Company Overview
- 12.5.2. Financial Performance
- 12.5.3. Product Portfolio
- 12.5.4. Strategic Initiatives
- 12.6. Hitachi, Ltd.
- 12.6.1. Company Overview
- 12.6.2. Financial Performance
- 12.6.3. Product Portfolio
- 12.6.4. Strategic Initiatives
- 12.7. Tesla
- 12.7.1. Company Overview
- 12.7.2. Financial Performance
- 12.7.3. Product Portfolio
- 12.7.4. Strategic Initiatives
- 12.8. AutoGrid Systems, Inc
- 12.8.1. Company Overview
- 12.8.2. Financial Performance
- 12.8.3. Product Portfolio
- 12.8.4. Strategic Initiatives
- 12.9. Limejump Limited
- 12.9.1. Company Overview
- 12.9.2. Financial Performance
- 12.9.3. Product Portfolio
- 12.9.4. Strategic Initiatives
- 12.10. Sunverge Energy, Inc.
- 12.10.1. Company Overview
- 12.10.2. Financial Performance
- 12.10.3. Product Portfolio
- 12.10.4. Strategic Initiatives
- 12.11. Centrica
- 12.11.1. Company Overview
- 12.11.2. Financial Performance
- 12.11.3. Product Portfolio
- 12.11.4. Strategic Initiatives
- 12.12. Other Notable Players
- 12.12.1. Company Overview
- 12.12.2. Financial Performance
- 12.12.3. Product Portfolio
- 12.12.4. Strategic Initiatives