|
|
市場調査レポート
商品コード
1471871
仮想発電所 (VPP) の世界市場Global Virtual Power Plant Market |
||||||

|
|||||||
|
|||||||

| 仮想発電所 (VPP) の世界市場 |
|
出版日: 2024年04月26日
発行: BCC Research
ページ情報: 英文 78 Pages
納期: 即納可能
|

全表示
- 概要
- 図表
- 目次
当レポートでは、世界の仮想発電所 (VPP) の市場を調査し、市場概要、市場影響因子および市場機会の分析、市場規模の推移・予測、各種区分・地域別の詳細分析、競合情勢、主要企業のプロファイルなどをまとめています。
目次
第1章 エグゼクティブサマリー
- 市場の展望
- 調査範囲
- 市場サマリー
第2章 市場概要
- 仮想発電所 (VPP) の概要
- テクニカルVPP
- 商用VPP
- COVID-19の影響
- ロシア・ウクライナ戦争の影響
第3章 市場力学
- 市場力学:スナップショット
- 市場促進要因
- 発電における再生可能エネルギー利用の拡大
- スマートグリッド導入への投資増加
- 電力需要の世界的増加
- 市場抑制要因
- 既存の電力インフラを変革するための初期コストの高さ
- 市場機会
- 分散型エネルギー資源のグリッドへの統合
- スマートシティの拡大
- 市場の課題
- ユーティリティのデジタル化によるサイバーセキュリティリスク
第4章 市場分析:各種区分別
- 分類の内訳
- 市場内訳:技術別
- 分散型エネルギー資源
- 需要応答
- 混合資産
- 市場内訳:エンドユーザー別
- 商用ユーザー
- 産業ユーザー
- 住宅ユーザー
- 地理的内訳
- 市場内訳:地域別
- 北米
- 欧州
- アジア太平洋
- その他の地域
第5章 競合情報
- 概要
- 市場ランキング
- 主な展開
第6章 VPP業界の持続可能性:ESGの観点
- 概要
- 環境への影響
- 社会的影響
- ガバナンスの影響
- 経済的および環境的利益
- VPP市場におけるESGの現状
- BCCによる見解
第7章 付録
- 調査手法
- 参考文献
- 略語
- 企業プロファイル
- 1KOMMA5
- ABB
- AGL ENERGY LTD.
- AUTOGRID SYSTEMS INC.
- CPOWER
- ENEL X NORTH AMERICA INC.
- FLEXITRICITY
- GENERAL ELECTRIC
- LIMEJUMP
- NEXT KRAFTWERKE
- SIEMENS
- STATKRAFT AS
- 小規模企業
- 業界団体
List of Tables
- Summary Table : Global Market for Virtual Power Plant, by Region, Through 2028
- Table 1 : Global Market for VPPs, by Technology, Through 2028
- Table 2 : Global Market for VPP Distributed Energy Resources, by Region, Through 2028
- Table 3 : Global Market for VPP Demand Response, by Region, Through 2028
- Table 4 : Global Market for VPP Mixed Assets, by Region, Through 2028
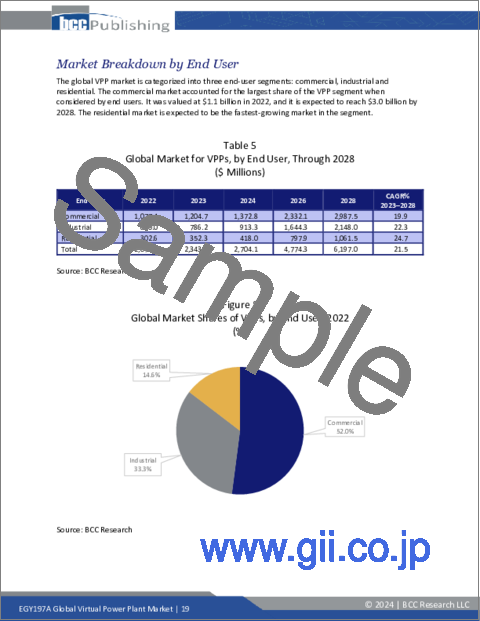
- Table 5 : Global Market for VPPs, by End User, Through 2028
- Table 6 : Global Market for VPP Commercial Users, by Region, Through 2028
- Table 7 : Global Market for VPP Industrial Users, by Region, Through 2028
- Table 8 : Global Market for VPP Residential Users, by Region, Through 2028
- Table 9 : Global Market for VPPs, by Region, Through 2028
- Table 10 : North American Market for VPPs, by Country, Through 2028
- Table 11 : North American Market for VPPs, by Technology, Through 2028
- Table 12 : North American Market for VPPs, by End User, Through 2028
- Table 13 : European Market for VPPs, by Country, Through 2028
- Table 14 : European Market for VPPs, by Technology, Through 2028
- Table 15 : European Market for VPPs, by End User, Through 2028
- Table 16 : Asia-Pacific Market for VPPs, by Country, Through 2028
- Table 17 : Asia-Pacific Market for VPPs, by Technology, Through 2028
- Table 18 : Asia-Pacific Market for VPPs, by End User, Through 2028
- Table 19 : RoW Market for VPPs, by Sub-region, Through 2028
- Table 20 : RoW Market for VPPs, by Technology, Through 2028
- Table 21 : RoW Market for VPPs, by End User, Through 2028
- Table 22 : Top Five Companies in the Global VPP Market
- Table 23 : Partnership in the Global VPP Market, 2022 and 2023
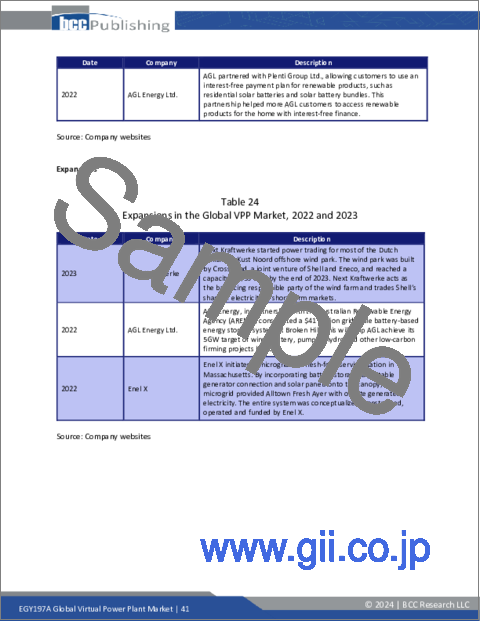
- Table 24 : Expansions in the Global VPP Market, 2022 and 2023
- Table 25 : Collaborations in the Global VPP Market, 2022 and 2023
- Table 26 : ESG Ratings of VPP Panel Providers
- Table 27 : Abbreviations Used in the Report
- Table 28 : 1Komma5: Company Snapshot
- Table 29 : 1Komma5: Product Portfolio
- Table 30 : ABB: Company Snapshot
- Table 31 : ABB: Financial Performance, FY 2022 and 2023
- Table 32 : ABB: Product Portfolio
- Table 33 : ABB: News/Key Developments, 2023
- Table 34 : AGL Energy Ltd.: Company Snapshot
- Table 35 : AGL Energy Ltd.: Financial Performance, FY 2021 and 2022
- Table 36 : AGL Energy Ltd.: Product Portfolio
- Table 37 : AGL Energy Ltd.: News/Key Developments, 2022 and 2023
- Table 38 : AutoGrid Systems Inc.: Company Snapshot
- Table 39 : AutoGrid Systems Inc.: Product Portfolio
- Table 40 : AutoGrid Systems Inc.: News/Key Developments, 2022 and 2023
- Table 41 : CPower: Company Snapshot
- Table 42 : CPower: Product Portfolio
- Table 43 : CPower: News/Key Developments, 2023
- Table 44 : Enel X North America Inc.: Company Snapshot
- Table 45 : Enel X North America Inc.: Product Portfolio
- Table 46 : Enel X North America Inc.: News/Key Developments, 2022
- Table 47 : Flexitricity: Company Snapshot
- Table 48 : Flexitricity: Product Portfolio
- Table 49 : General Electric: Company Snapshot
- Table 50 : General Electric: Financial Performance, FY 2022 and 2023
- Table 51 : General Electric: Product Portfolio
- Table 52 : General Electric: News/Key Developments, 2023
- Table 53 : Limejump: Company Snapshot
- Table 54 : Limejump: Product Portfolio
- Table 55 : Next Kraftwerke: Company Snapshot
- Table 56 : Next Kraftwerke: Product Portfolio
- Table 57 : Next Kraftwerke: News/Key Developments, 2023
- Table 58 : Siemens: Company Snapshot
- Table 59 : Siemens: Financial Performance, FY 2022 and 2023
- Table 60 : Siemens: Product Portfolio
- Table 61 : Siemens: News/Key Developments, 2023
- Table 62 : Statkraft AS: Company Snapshot
- Table 63 : Statkraft AS: Financial Performance, FY 2022 and 2023
- Table 64 : Statkraft AS: Product Portfolio
- Table 65 : Statkraft AS: News/Key Developments, 2024
- Table 66 : Small-Scale Players in the VPP Market
- Table 67 : Industry Organizations in the VPP Market
List of Figures
- Summary Figure : Global Market Shares of Virtual Power Plant, by Region, 2022
- Figure 1 : Dynamics of the VPP Market
- Figure 2 : Capacity Addition of Renewable Energy, 2019-2027
- Figure 3 : Globally Electricity Consumption, 2020-2022
- Figure 4 : Global Market Shares of VPPs, by Technology, 2022
- Figure 5 : Global Market Shares of VPP Distributed Energy Resources, by Region, 2022
- Figure 6 : Global Market Shares of VPP Demand Response, by Region, 2022
- Figure 7 : Global Market Shares of VPP Mixed Assets, by Region, 2022
- Figure 8 : Global Market Shares of VPPs, by End User, 2022
- Figure 9 : Global Market Shares of VPP Commercial Users, by Region, 2022
- Figure 10 : Global Market Shares of VPP Industrial Users, by Region, 2022
- Figure 11 : Global Market Shares of VPP Residential Users, by Region, 2022
- Figure 12 : Global Market Shares of VPPs, by Region, 2022
- Figure 13 : North American Market Shares of VPPs, by Country, 2022
- Figure 14 : North American Market Shares of VPPs, by Technology, 2022
- Figure 15 : North American Market Shares of VPPs, by End User, 2022
- Figure 16 : European Market Shares of VPPs, by Country, 2022
- Figure 17 : European Market Shares of VPPs, by Technology, 2022
- Figure 18 : European Market Shares of VPPs, by End User, 2022
- Figure 19 : Asia-Pacific Market Shares of VPPs, by Country, 2022
- Figure 20 : Asia-Pacific Market Shares of VPPs, by Technology, 2022
- Figure 21 : Asia-Pacific Market Shares of VPPs, by End User, 2022
- Figure 22 : RoW Market Shares of VPPs, by Sub-region, 2022
- Figure 23 : RoW Market Shares of VPPs, by Technology, 2022
- Figure 24 : RoW Market Shares of VPPs, by End User, 2022
- Figure 25 : Research Methodology for the Global VPP Market
- Figure 26 : ABB: Revenue Share, by Business Unit, FY 2023
- Figure 27 : ABB: Revenue Share, by Country/Region, FY 2023
- Figure 28 : AGL Energy Ltd.: Revenue Share, by Business Unit, FY 2022
- Figure 29 : General Electric: Revenue Share, by Business Unit, FY 2023
- Figure 30 : General Electric: Revenue Share, by Country/Region, FY 2023
- Figure 31 : Siemens: Revenue Share, by Business Unit, FY 2023
- Figure 32 : Siemens: Revenue Share, by Country/Region, FY 2023
- Figure 33 : Statkraft AS: Revenue Share, by Business Unit, FY 2023
- Figure 34 : Statkraft AS: Revenue Share, by Country/Region, FY 2023
This report provides an overview of the global virtual power plant (VPP) market. The report segments global VPP market based on technology, end-user and region. It presents an analysis of the ESG sustainability developments in the VPP industry.
Report Scope
This report identifies the segments by technology, source end use and regional market development for the virtual power plant (VPP) market. It provides analysis of major countries' markets, including the U.S., Canada, China, India and Germany, where the opportunities for increasing renewable power generation are most profitable.
This report also provides information on the leading companies' product types, business footprints and revenues. It includes a list of other companies in the global and regional markets, along with their product-related information. Patent analysis for the VPP market, which represents a significant investment area for investors, is also included. The report includes a chapter on environmental, social and governance (ESG) developments and explores the competitive landscape. Market numbers have been derived for the newly added annual capacity of VPP, not the total installed capacity.
In this report, 2022 is considered the base year. Estimates are provided for 2023 and the market values are forecast through 2028. All market values are in the U.S. dollars.
Report Includes
- An overview of the global markets for virtual power plants (VPPs)
- Analyses of the global market trends, with historical market revenue data (sales figures) for 2022, estimates for 2023, forecasts for 2024 and 2027, and projections of compound annual growth rates (CAGRs) through 2028
- Discussions of the market potential for VPPs in the power generation industry, future trends and innovations, and forecasts for this market's segments and sub-segments
- An estimate of the market size and revenue forecast, and a corresponding market share analysis by technology, end user and region
- A look at the sustainability trends and ESG developments in VPPs, with an emphasis on consumer attitudes, analysis of companies' ESG scores and the ESG practices of leading companies
- An analysis of patents related to VPPs
- Insight into the industry structure, current competitive landscape, R&D activity, companies' growth strategies, and company value share analysis
- A look at recent M&A activity and the outlook for venture funding
- Profiles of the leading global players
Table of Contents
Chapter 1 Executive Summary
- Market Outlook
- Scope of Report
- Market Summary
Chapter 2 Market Overview
- Virtual Power Plant Overview
- Technical VPPs
- Commercial VPPs
- Impact of COVID-19
- Impact of the Russia-Ukraine War
Chapter 3 Market Dynamics
- Market Dynamics Snapshot
- Market Drivers
- Increasing Use of Renewable Energy in Power Generation
- Rising Investments in Adopting Smart Grids
- Growing Global Demand for Electricity
- Market Restraints
- High Initial Cost to Transform Existing Power Infrastructure
- Market Opportunities
- Integration of Distributed Energy Resources into the Grid
- Growing Expansion of Smart Cities
- Market Challenges
- Cybersecurity Risks Due to Digitalization of Utilities
Chapter 4 Market Segmentation Analysis
- Segmentation Breakdown
- Market Breakdown by Technology
- Distributed Energy Resource
- Demand Response
- Mixed Asset
- Market Breakdown by End User
- Commercial Users
- Industrial Users
- Residential Users
- Geographic Breakdown
- Market Breakdown by Region
- North America
- Europe
- Asia-Pacific
- Rest of World
Chapter 5 Competitive Intelligence
- Overview
- Market Ranking
- Key Developments
Chapter 6 Sustainability in VPP Industry: An ESG Perspective
- Overview
- Environment Impact
- Social Impact
- Governance Impact
- Economic and Environmental Benefits
- Status of ESG in the VPP Market
- Concluding Remarks from BCC Research
Chapter 7 Appendix
- Methodology
- References
- Abbreviations
- Company Profiles
- 1KOMMA5
- ABB
- AGL ENERGY LTD.
- AUTOGRID SYSTEMS INC.
- CPOWER
- ENEL X NORTH AMERICA INC.
- FLEXITRICITY
- GENERAL ELECTRIC
- LIMEJUMP
- NEXT KRAFTWERKE
- SIEMENS
- STATKRAFT AS
- Small-Scale Players
- Industry Organizations
