|
|
年間契約型情報サービス
商品コード
1555076
製造業生産高トラッカー (MIO):世界の工業・機械生産データとその予測、およびCOVID-19の重大な影響Manufacturing Industry Output Tracker (MIO) - Global Industry and Machinery Production Data and Forecasts + Critical Impacts of COVID-19 |
||||||
|
|||||||
| 製造業生産高トラッカー (MIO):世界の工業・機械生産データとその予測、およびCOVID-19の重大な影響 |
|
出版日: 年間契約型情報サービス
発行: Interact Analysis
ページ情報: 英文
|

全表示
- 概要
- 目次
MIOについて - 市場における世界の製造業の最も完全かつ統一された分析
製造業生産高 (MIO) トラッカーは、世界の製造業に関する比類なき詳細と洞察を提供します。
サンプルビュー
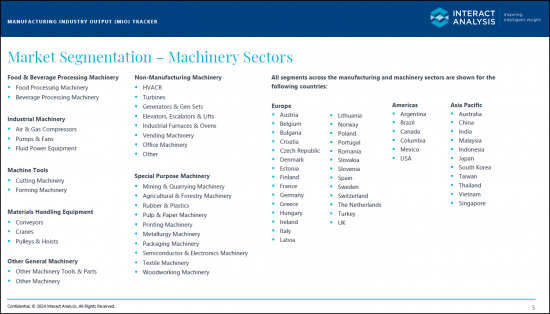
急速に変化し、また複雑な相関関係のある業界では、市場の現状や過去・未来を理解することが重要となります。この独特なトラッカーは、世界の製造業について最も完全で統一された分析を提供しています。世界45ヶ国、102業種を対象に、製造業の総生産額をきめ細かく定量化し、過去15年間の履歴データ - 不況前から現在までの景気循環全て - を提示しています。さらに、今後5年間分の信頼性の高い予測も掲載しています。
このような複雑な相関関係を、現在の国別・産業別予測と合わせて理解することで、国別・産業別・機械セクター別のより正確な予測が可能になります。
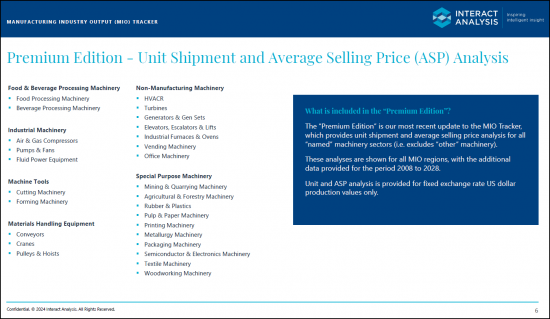
プレミアムエディション
プレミアムエディションは、MIOトラッカーの最新版で、すべての「指定」機械セクター (i.e.「その他」の機械セクターを除く) の出荷台数と平均販売価格を分析します。
これらの分析はMIOの全地域を対象としており、2007年から2023年までのデータが追加されています。5年間の予測も含まれています。
「Interact Analysisの仕事は、私たちの期待以上のものでした。信頼性に欠けるデータソースが多い中、調査手法とデータソースが明確で透明性が高く、調査結果を時間をかけて丁寧に説明してくれる調査会社と仕事ができたことは新鮮でした。Interact Analysisと仕事をした結果、戦略的な意思決定に自信を持つことができました。 - Cleaver Brooks
主な調査結果
- 2021年の製造業総額は42兆5,000億米ドルでした。これは、2020年の生産額39兆2,000億米ドルから8.3%の増加です。
- 現在の予測成長率を前提とすれば、世界のMIO生産額は、今後5~10年以内に50兆米ドルに達する可能性が高いです。
- 中国は、パンデミックを通じてプラス成長を維持した数少ない地域のひとつであり、そのため、その他の地域では大きな問題が起きているにもかかわらず、製造業の総生産額は比較的安定しています。
- 製造業の生産額のほぼ半分が中国からもたらされていることから、2007年以降、アジアは欧州・南北アメリカの両者よりも大きなシェアを獲得しています。この動向は今後も続くと予測されます。
- 製造額では、金属、食品・飲料、化学品・医薬品、自動車、電気・電子機器の5産業が他を圧倒しています。
- 機械部門は最大の規模を有し、複数の産業や社会分野にまたがる使用事例を持つものです。特に、マテリアルハンドリング・HVAC (暖房・換気・空調)・工作機械などが挙げられます。
MIOの強み
- COVID-19による世界健康危機に対する製造業の対応に関する、専門家による独自の予測を提供します。
- 各国レベルのモデルから構築された、詳細な市場規模と予測データ (現地通貨と未調整の成長シリーズを活用)。データは米ドル・ユーロ・英ポンド・日本円・人民元・韓国ウォンで表示され、固定通貨レート (2007~2022年の15年間平均) と変動通貨レートの両方を使用しています。
- 過去数年間の年間生産額と、今年を含む5年間の予測値を掲載。
- 地域別の成長率を、為替レートの影響 - 成長率を大きく変える要因 - を除去/加味した状態で観察することができます。
- 90,000行を超えるソースが、合計150万データポイント以上のインプットから導き出されています。
- インタラクティブなデータセットに加え、国別・業種別のダッシュボードにより、お客様のニーズに合わせて出力をカスタマイズできるため、柔軟性が最大限に高まります。
- 追加費用なしで、データの分析と解釈を個別にサポートします。
About the MIO - The most complete and unified analysis of the global manufacturing industry on the market
The Manufacturing Industry Output (MIO) Trackerprovides an unparalleled level of detail and insight into global manufacturing.
SAMPLE VIEW
In a fast-moving sector with complex correlations,it iscritical to understand the state of the marketnow, where it was, and whereit willbe.This unique tracker offers the most complete and unifiedanalysis of the manufacturing industry globally. It quantifies the total value of manufacturingproduction with deep granularity -for 102 industries,across 45 countries, andpresenting 15 years of historical data-for a complete business cycle, pre-recession to the present day. A credible 5-year forecast rounds out the view.
We'vecarefully organized the country data around a common Manufacturing Industry Outlook (MIO)Taxonomy to provide easy-to-interrogate, like-for-like comparisons.Understanding these complexcorrelations alongside current country and industry projections provides a more accurate forecast bycountry, industry and machinery sector.
The "Premium Edition"
The 'Premium Edition's the latest big update to the MIO Tracker, which provides unit shipment and average selling price analysis for all "named" machinery sectors (i.e. excludes "other" machinery).
These analyses are shown for all MIO regions, with the additional data provided for the period 2007to 2023. A 5-year forecast is also included.
"Interact Analysis' work extended above and beyond our expectations. In an environment full of less-than credible data sources, it was refreshing to work with a research provider who was clear and transparent about its methodology while also taking the time to thoroughly explain its findings. We feel more confident in our strategic decision making as a result ofworking with Interact Analysis and would highly recommend utilizing their services." -Cleaver Brooks.
Key Findings
- The total manufacturing value in 2021 was $42.5T. This was an increase of 8.3% from the 2020 production value posted of $39.2T.
- At its current predicted rate of growth, it is likely that global MIO value will reach $50T within the next 5-10 years.
- China was one of the few regions to maintain positive growth throughout the pandemic, this has allowed the total value of manufacturing to remain relatively stable despite major issues in other regions.
- With nearly half the value of manufacturing output coming from China, Asia has gained significant share over both Europe and Americas since 2007. This trend is projected to continue.
- Five industries dwarfed the others in terms of their manufacturing value: metals, food and beverage, chemicals and pharmaceuticals, automotive, and electrical andelectronic equipment.
- The largest machinery sectors are those which have a use case across multiple industries and areas of society. Namely materials handling, HVAC and machine tools.
The MIO Advantage
- Unique expertforecast of manufacturing's response following the COVID-19 global health crisis.
- Granular market size and forecast data,built-up from individual country-level models using local currencies and unadjusted growth series. See data presented in USD, EUR, GBP, YEN, YUAN or Korean WON with more available on request, using both fixed (15-year average '07-'22) and floating currency rates.
- Easy-to-read datapresented in terms of the annual value of production for the past years, with credible five-year forecasts including the current year.
- Observe like-for-like regional growth rates with the effects of currency exchange removed or included -a factor that profoundly changes the growth values presented.
- Over 90,000 rows of source,derived from inputs totaling over 1.5 million data points.The sheer size of the data ensures consistency and reliability when interpreting forecasts
- Interactive datasets, plus country and industry dashboards,so you can customize outputs to your precise needs for maximum flexibility
- Individualized support in analyzing and interpreting data at no extra cost.