|
|
市場調査レポート
商品コード
1367207
アジア太平洋地域のオンライン決済手段:2023年Asia-Pacific Online Payment Methods 2023 |
||||||
| アジア太平洋地域のオンライン決済手段:2023年 |
|
出版日: 2023年10月18日
発行: yStats.com
ページ情報: 英文 116 Pages
納期: 即日から翌営業日
|
- 全表示
- 概要
- 目次
アジア太平洋地域のB2C eコマース決済額は、2023年から6%超のCAGRで推移し、2027年には4兆ユーロを超えると予測されています。
中国:デジタル決済導入の主要国
アジア太平洋地域ではデジタル決済の導入が増加し続けており、中国は同地域におけるキャッシュレス社会への動きの最前線にいます。中国におけるオンライン決済利用者の普及率は、インターネット利用者に占める割合が2桁台の高水準に達していますが、利用者の伸びは近年大幅に鈍化しています。また中国は、2023年から2027年にかけてのB2C eコマース決済額のCAGRが2桁になると予測されている国のひとつです。
ほとんどのアジア太平洋諸国ではカードとデジタルウォレットが決済手段を独占
同地域では代替決済手段の利用が増加し続けていますが、その成長率は今後数年で低下すると予測されています。もっとも広く利用されているオンライン決済方法に関しては、カード決済とデジタルウォレットが、同地域の多くの国で常に上位2位の選択肢にランクインしています。中国とインドでは、それぞれ10人中8人以上、10人中9人の成人が過去1年間にモバイルウォレットを所有・利用した経験があり、インドにおけるモバイルウォレット決済額は2023年から2027年にかけて2桁のCAGRで成長すると予想されています。デジタル決済が急速に普及している国がある一方で、日本やベトナムのような国はキャッシュレス経済への移行がまだ初期段階にあります。
当レポートでは、アジア太平洋地域のオンライン決済手段を調査し、世界、アジア太平洋地域全体、主要国別のオンラインおよびモバイル決済の利用動向、決済件数・決済額、決済手段、ユーザー数、利用者の好みなどをまとめています。
目次
第1章 重要ポイント
第2章 マネジメントサマリー
第3章 世界の展開
- オンラインおよびモバイル決済の動向の概要
- B2Ceコマース支払額の実績・予測
- B2Ceコマースでの購入に優先されるオンライン支払い方法
- 非接触カード取引額の実績・予測
- デジタルウォレット取引額の実績・予測
- BNPL B2Ceコマースの売上実績・予測
- BNPLユーザー数の実績・予測
- 暗号通貨の支払い額の推移・予測
- OEM有料eコマーストランザクションの合計数・トランザクションの増加率など
- デジタル商品の購入から生じるOEMの有料eコマース取引の割合
- 回答者がチェックアウトを放棄する可能性が高い主な理由
- 最もアクセスしやすいオンライン支払い方法と最も好まれるオンライン支払い方法
- オンライン決済のセキュリティに関する消費者の意見
- デジタルウォレットおよびモバイルウォレットに関する消費者の意見
- オンラインで購入する際、消費者がチェックアウト時に最も期待すること
- オンラインショッピング時に優先される支払い方法
第4章 アジア太平洋
- 地域
- オンラインおよびモバイル決済の動向の概要
- B2Ceコマース支払額
- BNPL支払額
- 先進市場
- 日本
- デジタル決済の利用率
- 最も使用されている支払い方法
- インターネットユーザーに占めるスマートフォン決済ユーザーの割合
- 将来のモバイル決済の使用に対する態度の内訳
- スマートフォン決済サービス利用の内訳
- スマートフォン決済利用の内訳・QRコード決済および非接触型決済サービスの利用額
- 上位5つのQRコードモバイル決済サービス
- 非接触型モバイル決済サービスのトップ5
- 直近の物理的な購入にモバイルウォレットを使用した買い物客の割合
- 成人におけるデジタルウォレットの使用頻度の内訳
- 韓国
- B2Ceコマース支払額
- B2Ceコマースの支払い方法
- デジタル決済を行った人口の割合
- リアルタイム決済トランザクション数
- オーストラリア
- カード支払額
- BNPL売上高
- モバイルウォレットを所有し、過去1年間に使用した成人の割合
- 最後の物理的な購入にモバイルウォレットを使用した買い物客の割合
- ニュージーランド
- シンガポール
- 日本
- 新興市場
- 中国
- B2Ceコマース決済額
- オンライン決済ユーザー数・普及率
- オンライン決済ユーザーの普及率
- リアルタイム決済トランザクション数
- モバイルウォレットを所有し、過去1年間に使用した成人の割合
- 成人におけるデジタルウォレットの使用頻度の内訳
- モバイルウォレットの所有と使用率
- 台湾
- B2Ceコマース決済額
- オンライン決済に支払いカードを好むオンライン買い物客の割合
- オンライン支払いに現金の使用を好むオンライン買い物客の割合
- モバイルウォレットを所有し、過去1年間に使用した成人の割合
- 最も好まれるオンライン支払い方法の内訳
- 香港
- リアルタイム決済トランザクション数
- モバイルウォレットを所有し、過去1年間に使用した成人の割合
- E-ウォレットプロバイダー別の電子ウォレットユーザー数
- インド
- B2Ceコマース支払額
- カード支払額
- リアルタイム決済トランザクション数
- デジタル決済取引数
- デジタル決済取引額
- BNPLユーザー数
- モバイルウォレット決済額
- モバイルウォレットを所有し、過去1年間に使用した成人の割合
- 成人におけるデジタルウォレットの使用頻度の内訳
- インドネシア
- タイ
- ベトナム
- マレーシア
- フィリピン
- 中国
"Asia-Pacific B2C E-Commerce payment value is projected to grow at over +6% CAGR from 2023, surpassing EUR 4 trillion by 2027": new yStats.com report.
China is among the leading countries in digital payment adoption
Digital payment adoption continues to rise in the Asia-Pacific region, as outlined in the new yStats.com report, with China at the forefront of the move toward a cashless society in the APAC region. Online payment user penetration in China has exceeded a high double-digit percentage of the country's Internet users, although user growth has significantly slowed in recent years. Furthermore, China is among the countries projected to experience a double-digit CAGR in B2C E-Commerce payment value from 2023 to 2027.
Cards and digital wallets dominate payment methods in most Asia-Pacific countries
According to the yStats.com report, the use of alternative payment methods has continued to increase in the APAC region, although the growth rate is forecasted to decline in the coming years. When it comes to the most widely used online payment methods, card payments and digital wallets consistently rank as the top two choices in many countries in the region. In China and India, over 8 out of 10 and 9 out of 10 adults have owned and used a mobile wallet, respectively, in the past year, with the mobile wallet payments value in India expected to grow at a double-digit CAGR between 2023 and 2027. While some countries are experiencing rapid digital payment adoption, countries like Japan and Vietnam are still in the early stages of transitioning to cashless economies.
Table of Contents
1. Key Takeaways
- Key Takeaways of Asia-Pacific Online Payment Methods, September 2023
2. Management Summary
3. Global Developments
- Overview of the Online and Mobile Payment Trends, September 2023
- B2C E-Commerce Payment Value, in USD trillion, 2023e & 2027f
- Preferred Online Payment Methods For B2C E-Commerce Purchases, in % of Adults, June 2022
- Value of Contactless Card Transactions, in USD trillion, 2022e & 2027f
- Value of Digital Wallet Transactions, in USD trillion, 2023e & 2028f
- BNPL B2C E-Commerce Sales, in USD billion, 2022e & 2027f
- Number of BNPL Users, in millions, 2022e & 2027f
- Cryptocurrency Payment Value, in USD billion, 2020-2025f
- Total Number of OEM Pay E-Commerce Transactions, in USD billion, Growth in Transactions, in %, & Average Transaction Volume Per OEM Pay User, in USD, 2026f
- Share of OEM Pay E-Commerce Transactions Stemming From Purchases of Digital Goods, in %, 2026f
- Top Reasons Why Respondents Are Likely to Abandon Checkout, in % of Adults, June 2022
- Most Accessible vs Most Preferred Online Payment Method, in % of Adults, June 2022
- Share of Consumers Agreeing With the Following Statements Related to Security of Online Payments, in %, April 2023
- Share of Consumers Agreeing With the Following Statements Related to Digital and Mobile Wallets, in %, April 2023
- Top Consumer Expectations at Checkout When Making Online Purchases, incl. "Payment Methods", in % of Respondents, October 2022
- Preferred Payment Method When Shopping Online, in % of Respondents, October 2022
4. Asia-Pacific
- 4.1. Regional
- Overview of the Online and Mobile Payment Trends, September 2023
- B2C E-Commerce Payment Value, in USD trillion, 2023e & 2027f
- BNPL Payment Value, in USD billion, 2023e & 2028f
- 4.2. Advanced Markets
- 4.2.1. Japan
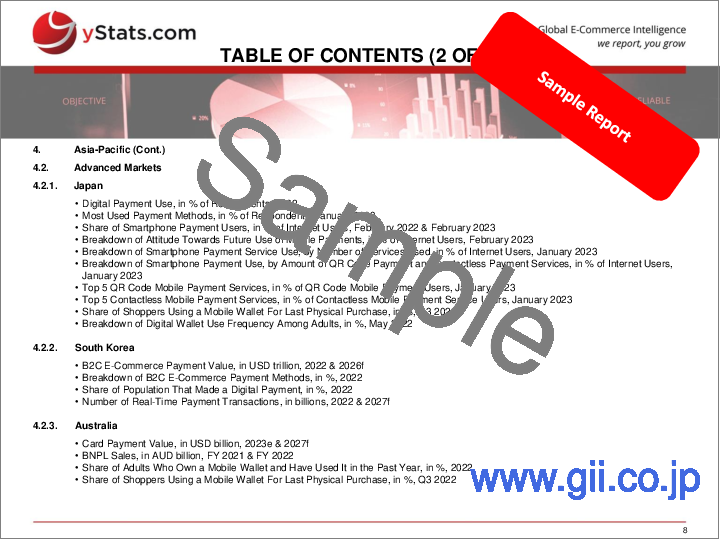
- Digital Payment Use, in % of Respondents, 2022
- Most Used Payment Methods, in % of Respondents, January 2023
- Share of Smartphone Payment Users, in % of Internet Users, February 2022 & February 2023
- Breakdown of Attitude Towards Future Use of Mobile Payments, in % of Internet Users, February 2023
- Breakdown of Smartphone Payment Service Use, by Number of Services Used, in % of Internet Users, January 2023
- Breakdown of Smartphone Payment Use, by Amount of QR Code Payment and Contactless Payment Services, in % of Internet Users, January 2023
- Top 5 QR Code Mobile Payment Services, in % of QR Code Mobile Payment Users, January 2023
- Top 5 Contactless Mobile Payment Services, in % of Contactless Mobile Payment Service Users, January 2023
- Share of Shoppers Using a Mobile Wallet For Last Physical Purchase, in %, Q3 2022
- Breakdown of Digital Wallet Use Frequency Among Adults, in %, May 2022
- 4.2.2. South Korea
- B2C E-Commerce Payment Value, in USD trillion, 2022 & 2026f
- Breakdown of B2C E-Commerce Payment Methods, in %, 2022
- Share of Population That Made a Digital Payment, in %, 2022
- Number of Real-Time Payment Transactions, in billions, 2022 & 2027f
- 4.2.3. Australia
- Card Payment Value, in USD billion, 2023e & 2027f
- BNPL Sales, in AUD billion, FY 2021 & FY 2022
- Share of Adults Who Own a Mobile Wallet and Have Used It in the Past Year, in %, 2022
- Share of Shoppers Using a Mobile Wallet For Last Physical Purchase, in %, Q3 2022
- 4.2.4. New Zealand
- BNPL Transaction Value, in USD billion, 2023e & 2026f
- Share of Adults Who Own a Mobile Wallet and Have Used It in the Past Year, in %, 2022
- 4.2.5. Singapore
- Card Payments Value, in USD billion, 2023e & 2027f
- Share of Adults That Made a Digital Payment, in %, 2022
- Share of Adults That Used a BNPL Service, in %, Q3 2022
- Share of Shoppers Using a Mobile Wallet For Latest Physical Purchase, in %, Q3 2022
- Share of Adults Who Own a Mobile Wallet and Have Used It in the Past Year, in %, 2022
- Number of Proximity Mobile Payment Users, in millions, 2022e-2026
- Proximity Mobile Payment User Growth, in % of Y-o-Y Change, 2022e-2026f
- 4.2.1. Japan
- 4.3. Emerging Markets
- 4.3.1. China
- B2C E-Commerce Payments Value, in USD trillion, 2023e & 2027f
- Number of Online Payment Users, in millions, and Penetration, in % of Internet Users, June 2021 & June 2022
- Online Payment User Penetration, in % of Internet Users, June 2022
- Number of Real-Time Payment Transactions, in billions, 2022 & 2027f
- Share of Adults Who Own a Mobile Wallet and Have Used It in the Past Year, in %, 2022
- Breakdown of Digital Wallet Use Frequency Among Adults, in %, May 2022
- Mobile Wallet Ownership and Usage, in % of Adults, Q2 2022
- 4.3.2. Taiwan
- B2C E-Commerce Payments Value, in USD billion, 2022 & 2026f
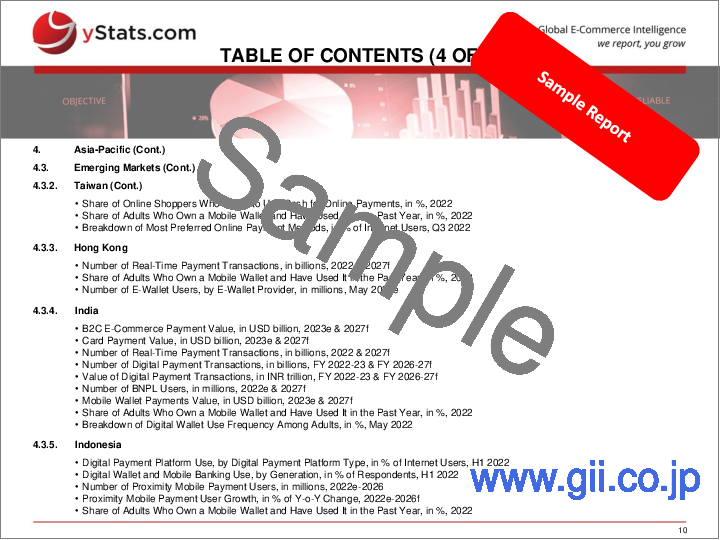
- Share of Online Shoppers Who Prefer Payment Cards for Online Payments, in %, 2022
- Share of Online Shoppers Who Prefer to Use Cash for Online Payments, in %, 2022
- Share of Adults Who Own a Mobile Wallet and Have Used It in the Past Year, in %, 2022
- Breakdown of Most Preferred Online Payment Methods, in % of Internet Users, Q3 2022
- 4.3.3. Hong Kong
- Number of Real-Time Payment Transactions, in billions, 2022 & 2027f
- Share of Adults Who Own a Mobile Wallet and Have Used It in the Past Year, in %, 2022
- Number of E-Wallet Users, by E-Wallet Provider, in millions, May 2023e
- 4.3.4. India
- B2C E-Commerce Payment Value, in USD billion, 2023e & 2027f
- Card Payment Value, in USD billion, 2023e & 2027f
- Number of Real-Time Payment Transactions, in billions, 2022 & 2027f
- Number of Digital Payment Transactions, in billions, FY 2022-23 & FY 2026-27f
- Value of Digital Payment Transactions, in INR trillion, FY 2022-23 & FY 2026-27f
- Number of BNPL Users, in millions, 2022e & 2027f
- Mobile Wallet Payments Value, in USD billion, 2023e & 2027f
- Share of Adults Who Own a Mobile Wallet and Have Used It in the Past Year, in %, 2022
- Breakdown of Digital Wallet Use Frequency Among Adults, in %, May 2022
- 4.3.5. Indonesia
- Digital Payment Platform Use, by Digital Payment Platform Type, in % of Internet Users, H1 2022
- Digital Wallet and Mobile Banking Use, by Generation, in % of Respondents, H1 2022
- Number of Proximity Mobile Payment Users, in millions, 2022e-2026
- Proximity Mobile Payment User Growth, in % of Y-o-Y Change, 2022e-2026f
- Share of Adults Who Own a Mobile Wallet and Have Used It in the Past Year, in %, 2022
- 4.3.6. Thailand
- Share of Online Payments Making Up Total Payment Transactions, in %, 2023e
- Share of Adults Who Own a Mobile Wallet and Have Used It in the Past Year, in %, 2022
- Number of Proximity Mobile Payment Users, in millions, 2022e-2026
- Proximity Mobile Payment User Growth, in % of Y-o-Y Change, 2022e-2026f
- 4.3.7. Vietnam
- Share of Adults That Made a Digital Payment, in %, 2022
- Share of Adults Who Own a Mobile Wallet and Have Used It in the Past Year, in %, 2022
- Share of Adults That Used a BNPL Service, in %, Q3 2022
- Number of Proximity Mobile Payment Users, in millions, 2022e-2026
- Proximity Mobile Payment User Growth, in % of Y-o-Y Change, 2022e-2026f
- 4.3.8. Malaysia
- Card Payment Value, in USD billion, 2023e & 2027f
- Share of Adults Who Own a Mobile Wallet and Have Used It in the Past Year, in %, 2022
- Number of Proximity Mobile Payment Users, in millions, 2022e-2026
- Proximity Mobile Payment User Growth, in % of Y-o-Y Change, 2022e-2026f
- 4.3.9. Philippines
- Card Payment Value, in USD billion, 2023e & 2027f
- Breakdown of Online Payment Methods, in %, 2022e
- Number of Proximity Mobile Payment Users, in millions, 2022e-2026
- Proximity Mobile Payment User Growth, in % of Y-o-Y Change, 2022e-2026f
- 4.3.1. China


