|
|
市場調査レポート
商品コード
1314734
ターコイズ水素の世界市場調査レポート:産業分析、規模、シェア、成長、動向、2023年から2030年予測Global Turquoise Hydrogen Market Research Report - Industry Analysis, Size, Share, Growth, Trends and Forecast 2023 to 2030 |
||||||
|
|
|||||||
カスタマイズ可能
|
|||||||


| ターコイズ水素の世界市場調査レポート:産業分析、規模、シェア、成長、動向、2023年から2030年予測 |
|
出版日: 2023年07月01日
発行: Value Market Research
ページ情報: 英文 232 Pages
納期: 即日から翌営業日
|

- 全表示
- 概要
- 図表
- 目次
ターコイズ水素市場の世界需要は、2023-2030年の調査期間においてCAGR 215.2%で、2022年の1,670万米ドルから2030年にはほぼ1,627億696万米ドルの市場規模に達すると推定されます。
ターコイズ水素とは、電気を用いて水を水素と酸素に分解する電気分解のプロセスを通じて製造される水素のことです。ターコイズ水素の「ターコイズ」とは、電気分解プロセスで使用される電気の供給源を表し、風力発電や太陽光発電などの再生可能エネルギー発電から生成されます。
市場力学:
風力発電や太陽光発電などの再生可能エネルギーへの世界的移行は、この市場の重要な促進要因です。脱炭素化への取り組みへの注目の高まりが、ターコイズ水素の需要を促進しています。政府、産業界、組織は二酸化炭素排出量の削減に取り組んでおり、これは従来の水素製造方法に代わるクリーンで低炭素な代替手段を提供します。支援政策とインセンティブは、市場を牽引する重要な役割を担っています。各国政府は、クリーンエネルギーと水素技術の採用を促進するため、再生可能エネルギー目標、炭素価格メカニズム、インセンティブを実施し、有利な市場環境を作り出しています。クリーンな輸送手段に対する需要の高まりも、ターコイズ水素市場を牽引しています。排出ガスを出さない輸送手段へのニーズが高まる中、ターコイズ水素は燃料電池車のクリーンな燃料源として役立っています。ターコイズ水素は、クリーンな原料として、あるいはプロセス加熱用として、化学製造や精製などの様々な産業分野で用途が見出されています。また、余剰の再生可能エネルギーを貯蔵し、必要なときに電力を供給するエネルギー貯蔵システムにも利用できます。電解技術の技術的進歩とコスト削減が市場成長に寄与し、競合水素を経済的に実行可能なものとし、従来の水素製造方法との競争力を高めています。
本レポートでは、ポーターのファイブフォースモデル、市場魅力度分析、バリューチェーン分析を取り上げています。これらのツールは、業界の構造を明確に把握し、世界レベルでの競合の魅力を評価するのに役立ちます。さらに、これらのツールは、ターコイズ水素の世界市場における各セグメントを包括的に評価することもできます。ターコイズ水素産業の成長と動向は、この調査に全体的なアプローチを提供します。
地域分析:
本セクションでは、北米、欧州、アジア太平洋、ラテンアメリカ、中東・アフリカにおけるターコイズ水素市場の現在と将来の需要を強調する地域展望をカバーします。さらに、著名な全地域における各用途セグメントの需要・推定・予測にも焦点を当てています。
カスタム要件がある場合は、お問い合わせください。当社の調査チームは、お客様のニーズに応じてカスタマイズしたレポートを提供することができます。
目次
第1章 序文
第2章 エグゼクティブサマリー
- 市場のハイライト
- 世界市場スナップショット
第3章 ターコイズ水素-産業分析
- イントロダクション:市場力学
- 市場促進要因
- 市場抑制要因
- 市場機会
- 業界動向
- ポーターのファイブフォース分析
- 市場魅力度分析
第4章 バリューチェーン分析
- バリューチェーン分析
- 原材料分析
- 原材料リスト
- 原材料メーカーリスト
- 主要原材料の価格動向
- 潜在的バイヤーのリスト
- マーケティングチャネル
- ダイレクトマーケティング
- インダイレクトマーケティング
- マーケティングチャネル発展動向
第5章 ターコイズ水素の世界市場分析:原料別
- 原料別概要
- 実績データと予測データ
- 原料別分析
- 再生可能エネルギー
- 天然ガス
第6章 ターコイズ水素の世界市場分析:プロセス別
- プロセス別概要
- 実績データと予測データ
- プロセス別分析
- メタン熱分解
- 溶融塩熱分解
第7章 ターコイズ水素の世界市場分析:用途別
- 概要:用途別
- 実績データと予測データ
- 分析:用途別
- 石油化学
- アンモニア
- 化学
- 鉄鋼
- 輸送
- 電力
第8章 ターコイズ水素の世界市場分析:地域別
- 地域別展望
- イントロダクション
- 北米の売上分析
- 概要、実績および予測
- 北米:セグメント別
- 北米:国別
- 米国
- カナダ
- メキシコ
- 欧州の売上分析
- 概要、実績および予測
- 欧州:セグメント別
- 欧州:国別
- 英国
- フランス
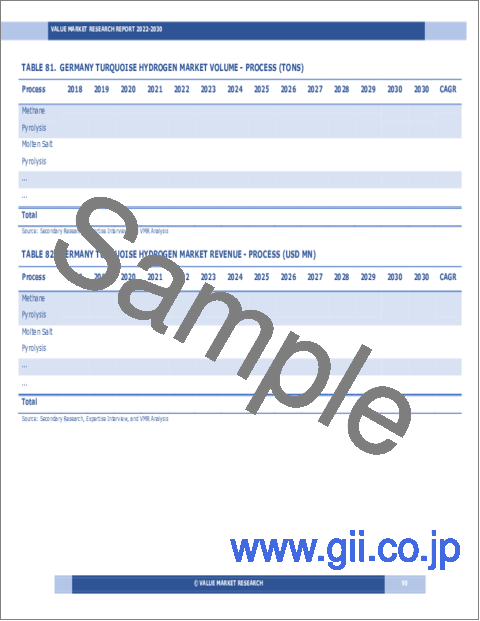
- ドイツ
- イタリア
- ロシア
- その他欧州
- アジア太平洋地域売上分析
- 概要、実績および予測
- アジア太平洋地域:セグメント別
- アジア太平洋地域:国別
- 中国
- インド
- 日本
- 韓国
- オーストラリア
- その他アジア太平洋地域
- ラテンアメリカ売上分析
- 概要、実績および予測
- ラテンアメリカ:セグメント別
- ラテンアメリカ:国別
- ブラジル
- アルゼンチン
- ペルー
- チリ
- その他ラテンアメリカ
- 中東・アフリカ売上分析
- 概要、実績および予測
- 中東・アフリカ:セグメント別
- 中東・アフリカ:国別
- サウジアラビア
- アラブ首長国連邦
- イスラエル
- 南アフリカ
- その他中東・アフリカ
第9章 ターコイズ水素企業の競合情勢
- ターコイズ水素市場の競合
- 提携・協力・合意
- 合併・買収
- 新製品の発売
- その他の開発
第10章 企業プロファイル
- 企業シェア分析
- 市場集中度
- C-Zero
- Pure Hydrogen Corporation
- Ebara Corporation
- Aurora Hydrogen
- Ekona Power Inc.
- Hazer Group Limited
- Monolith Inc.
- Mitsubishi Power
- HiiROC
注-企業プロファイルにおいて、財務の詳細や最近の動向は、入手可能な情報に基づいているか、非公開会社の場合はカバーしていない可能性があります。
LIST OF TABLES
- Market Snapshot
- Drivers : Impact Analysis
- Restraints : Impact Analysis
- List of Raw Material
- List of Raw Material Manufactures
- List of Potential Buyers
- Analysis by Feedstock (Tons and USD MN)
- Renewable Electricity Market Sales by Geography (Tons and USD MN)
- Natural Gas Market Sales by Geography (Tons and USD MN)
- Analysis Market by Process (Tons and USD MN)
- Methane Pyrolysis Market Sales by Geography (Tons and USD MN)
- Molten Salt Pyrolysis Market Sales by Geography (Tons and USD MN)
- Analysis by Application (Tons and USD MN)
- Petrochemical Market Sales by Geography (Tons and USD MN)
- Ammonia Market Sales by Geography (Tons and USD MN)
- Chemical Market Sales by Geography (Tons and USD MN)
- Steel Market Sales by Geography (Tons and USD MN)
- Transportation Market Sales by Geography (Tons and USD MN)
- Power Market Sales by Geography (Tons and USD MN)
- Global Turquoise Hydrogen Market Sales by Geography (Tons and USD MN)
- North America Market Analysis (Tons and USD MN)
- United State Market Analysis (Tons and USD MN)
- Canada Market Analysis (Tons and USD MN)
- Mexico Market Analysis (Tons and USD MN)
- Europe Market Analysis (Tons and USD MN)
- Europe Market Estimate by Country (Tons and USD MN)
- United Kingdom Market Analysis (Tons and USD MN)
- France Market Analysis (Tons and USD MN)
- Germany Market Analysis (Tons and USD MN)
- Italy Market Analysis (Tons and USD MN)
- Russia Market Analysis (Tons and USD MN)
- Spain Market Analysis (Tons and USD MN)
- Rest of Europe Market Analysis (Tons and USD MN)
- Asia Pacific Market Analysis (Tons and USD MN)
- China Market Analysis (Tons and USD MN)
- Japan Market Analysis (Tons and USD MN)
- India Market Analysis (Tons and USD MN)
- South Korea Market Analysis (Tons and USD MN)
- Australia Market Analysis (Tons and USD MN)
- Rest of Asia Pacific Market Analysis (Tons and USD MN)
- Latin America Market Analysis (Tons and USD MN)
- Brazil Market Analysis (Tons and USD MN)
- Argentina Market Analysis (Tons and USD MN)
- Peru Market Analysis (Tons and USD MN)
- Chile Market Analysis (Tons and USD MN)
- Rest of Latin America Market Analysis (Tons and USD MN)
- Middle East & Africa Market Analysis (Tons and USD MN)
- Saudi Arabia Market Analysis (Tons and USD MN)
- UAE Market Analysis (Tons and USD MN)
- Israel Market Analysis (Tons and USD MN)
- South Africa Market Analysis (Tons and USD MN)
- Rest of Middle East and Africa Market Analysis (Tons and USD MN)
- Partnership/Collaboration/Agreement
- Mergers And Acquisition
LIST OF FIGURES
- Research Scope of Turquoise Hydrogen Report
- Market Research Process
- Market Research Methodology
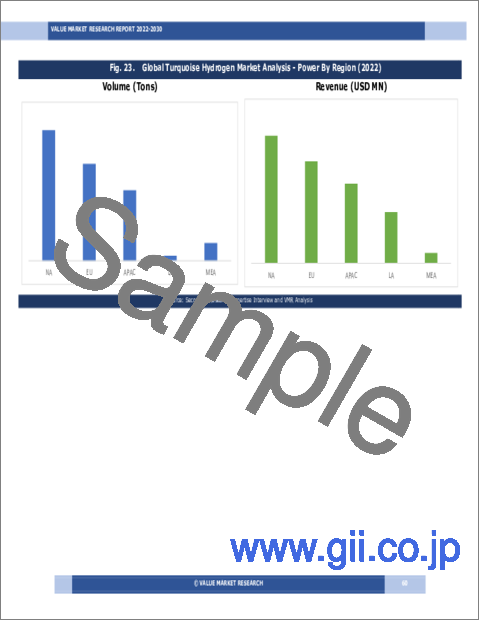
- Global Turquoise Hydrogen Market Size, by Region (Tons and USD MN)
- Porters Five Forces Analysis
- Market Attractiveness Analysis by Feedstock
- Market Attractiveness Analysis by Process
- Market Attractiveness Analysis by Application
- Market Attractiveness Analysis by Region
- Value Chain Analysis
- Global Market Analysis by Feedstock (Tons and USD MN)
- Renewable Electricity Market Sales by Geography (Tons and USD MN)
- Natural Gas Market Sales by Geography (Tons and USD MN)
- Global Market Analysis by Process (Tons and USD MN)
- Methane Pyrolysis Market Sales by Geography (Tons and USD MN)
- Molten Salt Pyrolysis Market Sales by Geography (Tons and USD MN)
- Global Market Analysis by Application (Tons and USD MN)
- Petrochemical Market Sales by Geography (Tons and USD MN)
- Ammonia Market Sales by Geography (Tons and USD MN)
- Chemical Market Sales by Geography (Tons and USD MN)
- Steel Market Sales by Geography (Tons and USD MN)
- Transportation Market Sales by Geography (Tons and USD MN)
- Power Market Sales by Geography (Tons and USD MN)
- Global Market Sales (Tons and USD MN)
- North America Market Sales (Tons and USD MN)
- Europe Market Sales (Tons and USD MN)
- Asia Pacific Market Sales (Tons and USD MN)
- Latin America Market Sales (Tons and USD MN)
- Middle East & Africa Market Sales (Tons and USD MN)
- Recent Development in Industry
- Top Company Market Share Analysis
Kindly note that the above listed are the basic tables and figures of the report and are not limited to the TOC.
The global demand for Turquoise Hydrogen Market is presumed to reach the market size of nearly USD 162706.96 MN by 2030 from USD 16.7 MN in 2022 with a CAGR of 215.2% under the study period of 2023 - 2030. Regarding volume, the market was calculated XX Tons in 2022 and forecast to touch XX Tons by 2030 with a CAGR of XX% during 2023-2030.
Turquoise hydrogen refers to hydrogen produced through the process of electrolysis, where water is split into hydrogen and oxygen using electricity. The term 'turquoise' in turquoise hydrogen represents the source of the electricity used in the electrolysis process, which is generated from renewable energy sources like wind or solar power.
MARKET DYNAMICS:
The global transition to renewable energy sources, such as wind and solar power, is a significant driver for this market. The increasing focus on decarbonization initiatives fuels the demand for Turquoise hydrogen. Governments, industries, and organizations are committed to reducing carbon emissions, and this offers a clean and low-carbon alternative to traditional hydrogen production methods. Supportive policies and incentives play a crucial role in driving the market. Governments implement renewable energy targets, carbon pricing mechanisms, and incentives to promote the adoption of clean energy and hydrogen technologies, creating a favourable market environment. The growing demand for clean transportation also drives the Turquoise hydrogen market. As the need for emissions-free transportation options rises, this serves as a clean fuel source for fuel cell vehicles. Turquoise hydrogen finds applications in various industrial sectors, such as chemical manufacturing and refining, as a clean feedstock or for process heating. It can also be utilized in energy storage systems to store excess renewable energy and provide power when needed. Technological advancements and cost reductions in electrolysis technologies contribute to market growth, making Turquoise hydrogen economically viable and competitive with traditional hydrogen production methods.
The report covers Porter's Five Forces Model, Market Attractiveness Analysis, and Value Chain analysis. These tools help to get a clear picture of the industry's structure and evaluate the competition attractiveness at a global level. Additionally, these tools also give an inclusive assessment of each segment in the global market of turquoise hydrogen. The growth and trends of Turquoise Hydrogen Industry provide a holistic approach to this study.
MARKET SEGMENTATION:
This section of the turquoise hydrogen market report provides detailed data on the segments by analyzing them at country and regional level, thereby assisting the strategist in identifying the target demographics for the respective product or services with the upcoming opportunities.
By Feedstock
- Renewable Electricity
- Natural Gas
By Process
- Methane Pyrolysis
- Molten Salt Pyrolysis
By Application
- Petrochemical
- Ammonia
- Chemical
- Steel
- Transportation
- Power
REGIONAL ANALYSIS:
This section covers the regional outlook, which accentuates current and future demand for the Turquoise Hydrogen market across North America, Europe, Asia-Pacific, Latin America, and Middle East & Africa. Further, the report focuses on demand, estimation, and forecast for individual application segments across all the prominent regions.
The research report also covers the comprehensive profiles of the key players in the market and an in-depth view of the competitive landscape worldwide. The major players in the turquoise hydrogen market include C-Zero, Pure Hydrogen Corporation, Ebara Corporation, Aurora Hydrogen, Ekona Power Inc., Hazer Group Limited, Monolith Inc., Mitsubishi Power, HiiROC. This section consists of a holistic view of the competitive landscape that includes various strategic developments such as key mergers & acquisitions, future capacities, partnerships, financial overviews, collaborations, new product developments, new product launches, and other developments.
In case you have any custom requirements, do write to us. Our research team can offer a customized report as per your need.
TABLE OF CONTENTS
1 . PREFACE
- 1.1. Report Description
- 1.1.1. Objective
- 1.1.2. Target Audience
- 1.1.3. Unique Selling Proposition (USP) & offerings
- 1.2. Research Scope
- 1.3. Research Methodology
- 1.3.1. Market Research Process
- 1.3.2. Market Research Methodology
2 . EXECUTIVE SUMMARY
- 2.1. Highlights of Market
- 2.2. Global Market Snapshot
3 . TURQUOISE HYDROGEN - INDUSTRY ANALYSIS
- 3.1. Introduction - Market Dynamics
- 3.2. Market Drivers
- 3.3. Market Restraints
- 3.4. Opportunities
- 3.5. Industry Trends
- 3.6. Porter's Five Force Analysis
- 3.7. Market Attractiveness Analysis
- 3.7.1 Market Attractiveness Analysis By Feedstock
- 3.7.2 Market Attractiveness Analysis By Process
- 3.7.3 Market Attractiveness Analysis By Application
- 3.7.4 Market Attractiveness Analysis By Region
4 . VALUE CHAIN ANALYSIS
- 4.1. Value Chain Analysis
- 4.2. Raw Material Analysis
- 4.2.1. List of Raw Materials
- 4.2.2. Raw Material Manufactures List
- 4.2.3. Price Trend of Key Raw Materials
- 4.3. List of Potential Buyers
- 4.4. Marketing Channel
- 4.4.1. Direct Marketing
- 4.4.2. Indirect Marketing
- 4.4.3. Marketing Channel Development Trend
5 . GLOBAL TURQUOISE HYDROGEN MARKET ANALYSIS BY FEEDSTOCK
- 5.1 Overview by Feedstock
- 5.2 Historical and Forecast Data
- 5.3 Analysis by Feedstock
- 5.4 Renewable Electricity Historic and Forecast Sales by Regions
- 5.5 Natural Gas Historic and Forecast Sales by Regions
6 . GLOBAL TURQUOISE HYDROGEN MARKET ANALYSIS BY PROCESS
- 6.1 Overview by Process
- 6.2 Historical and Forecast Data
- 6.3 Analysis by Process
- 6.4 Methane Pyrolysis Historic and Forecast Sales by Regions
- 6.5 Molten Salt Pyrolysis Historic and Forecast Sales by Regions
7 . GLOBAL TURQUOISE HYDROGEN MARKET ANALYSIS BY APPLICATION
- 7.1 Overview by Application
- 7.2 Historical and Forecast Data
- 7.3 Analysis by Application
- 7.4 Petrochemical Historic and Forecast Sales by Regions
- 7.5 Ammonia Historic and Forecast Sales by Regions
- 7.6 Chemical Historic and Forecast Sales by Regions
- 7.7 Steel Historic and Forecast Sales by Regions
- 7.8 Transportation Historic and Forecast Sales by Regions
- 7.9 Power Historic and Forecast Sales by Regions
8 . GLOBAL TURQUOISE HYDROGEN MARKET ANALYSIS BY GEOGRAPHY
- 8.1. Regional Outlook
- 8.2. Introduction
- 8.3. North America Sales Analysis
- 8.3.1. Overview, Historic and Forecast Data Sales Analysis
- 8.3.2. North America By Segment Sales Analysis
- 8.3.3. North America By Country Sales Analysis
- 8.3.4. United State Sales Analysis
- 8.3.5. Canada Sales Analysis
- 8.3.6. Mexico Sales Analysis
- 8.4. Europe Sales Analysis
- 8.4.1. Overview, Historic and Forecast Data Sales Analysis
- 8.4.2. Europe by Segment Sales Analysis
- 8.4.3. Europe by Country Sales Analysis
- 8.4.4. United Kingdom Sales Analysis
- 8.4.5. France Sales Analysis
- 8.4.6. Germany Sales Analysis
- 8.4.7. Italy Sales Analysis
- 8.4.8. Russia Sales Analysis
- 8.4.9. Rest Of Europe Sales Analysis
- 8.5. Asia Pacific Sales Analysis
- 8.5.1. Overview, Historic and Forecast Data Sales Analysis
- 8.5.2. Asia Pacific by Segment Sales Analysis
- 8.5.3. Asia Pacific by Country Sales Analysis
- 8.5.4. China Sales Analysis
- 8.5.5. India Sales Analysis
- 8.5.6. Japan Sales Analysis
- 8.5.7. South Korea Sales Analysis
- 8.5.8. Australia Sales Analysis
- 8.5.9. Rest Of Asia Pacific Sales Analysis
- 8.6. Latin America Sales Analysis
- 8.6.1. Overview, Historic and Forecast Data Sales Analysis
- 8.6.2. Latin America by Segment Sales Analysis
- 8.6.3. Latin America by Country Sales Analysis
- 8.6.4. Brazil Sales Analysis
- 8.6.5. Argentina Sales Analysis
- 8.6.6. Peru Sales Analysis
- 8.6.7. Chile Sales Analysis
- 8.6.8. Rest of Latin America Sales Analysis
- 8.7. Middle East & Africa Sales Analysis
- 8.7.1. Overview, Historic and Forecast Data Sales Analysis
- 8.7.2. Middle East & Africa by Segment Sales Analysis
- 8.7.3. Middle East & Africa by Country Sales Analysis
- 8.7.4. Saudi Arabia Sales Analysis
- 8.7.5. UAE Sales Analysis
- 8.7.6. Israel Sales Analysis
- 8.7.7. South Africa Sales Analysis
- 8.7.8. Rest Of Middle East And Africa Sales Analysis
9 . COMPETITIVE LANDSCAPE OF THE TURQUOISE HYDROGEN COMPANIES
- 9.1. Turquoise Hydrogen Market Competition
- 9.2. Partnership/Collaboration/Agreement
- 9.3. Merger And Acquisitions
- 9.4. New Product Launch
- 9.5. Other Developments
10 . COMPANY PROFILES OF TURQUOISE HYDROGEN INDUSTRY
- 10.1. Company Share Analysis
- 10.2. Market Concentration Rate
- 10.3. C-Zero
- 10.3.1. Company Overview
- 10.3.2. Company Revenue
- 10.3.3. Products
- 10.3.4. Recent Developments
- 10.4. Pure Hydrogen Corporation
- 10.4.1. Company Overview
- 10.4.2. Company Revenue
- 10.4.3. Products
- 10.4.4. Recent Developments
- 10.5. Ebara Corporation
- 10.5.1. Company Overview
- 10.5.2. Company Revenue
- 10.5.3. Products
- 10.5.4. Recent Developments
- 10.6. Aurora Hydrogen
- 10.6.1. Company Overview
- 10.6.2. Company Revenue
- 10.6.3. Products
- 10.6.4. Recent Developments
- 10.7. Ekona Power Inc.
- 10.7.1. Company Overview
- 10.7.2. Company Revenue
- 10.7.3. Products
- 10.7.4. Recent Developments
- 10.8. Hazer Group Limited
- 10.8.1. Company Overview
- 10.8.2. Company Revenue
- 10.8.3. Products
- 10.8.4. Recent Developments
- 10.9. Monolith Inc.
- 10.9.1. Company Overview
- 10.9.2. Company Revenue
- 10.9.3. Products
- 10.9.4. Recent Developments
- 10.10. Mitsubishi Power
- 10.10.1. Company Overview
- 10.10.2. Company Revenue
- 10.10.3. Products
- 10.10.4. Recent Developments
- 10.11. HiiROC
- 10.11.1. Company Overview
- 10.11.2. Company Revenue
- 10.11.3. Products
- 10.11.4. Recent Developments
Note - in company profiling, financial details and recent development are subject to availability or might not be covered in case of private companies
