
|
市場調査レポート
商品コード
1927575
自動テスト、ソフトウェア構成分析、SBOMツール:AI強化型分析が定着Automated Testing, Software Composition Analysis & SBOM Tools: AI-Augmented Analysis Takes Hold |
||||||
|
|||||||
| 自動テスト、ソフトウェア構成分析、SBOMツール:AI強化型分析が定着 |
|
出版日: 2025年11月30日
発行: VDC Research Group, Inc.
ページ情報: 英文 46 Pages/459 Exhibits
納期: 即日から翌営業日
|

概要
AIがソフトウェア開発に与える影響は、エンジニアリング組織がコードを設計、構築、保守する方法を再構築しています。生成AIとコパイロットはソフトウェア開発を効果的に加速しますが、同時に新たな脆弱性の源やプロジェクトリスクももたらします。その結果、効果的なセキュリティと品質の確保を実現する自動テストおよび分析ツールへの需要が大幅に高まっています。ソフトウェア構成分析 (SCA)、静的解析、動的テストソリューションは、信頼性、安全性、基準準拠を犠牲にすることなく、エンジニアリング組織がAIを活用した生産性向上を安全に実現するための重要なガードレールとして機能しています。
自動テストツールの需要には複数の要因があり、ベンダーはこれらすべてを注意深く監視し理解する必要があります。規制圧力、進化する業界標準、変化するソフトウェア開発哲学、AI、そして安全上重要な機能におけるソフトウェアの役割の拡大は、それぞれ異なる形でソフトウェア検証・妥当性確認 (V&V) 市場に影響を与えており、適応的な製品設計と研究開発投資を必要としています。
本レポートでは、自動化ソフトウェアテストツール、セキュリティテストツール、SCAツールの各市場に関連するツール、動向、戦略的考察について詳細な分析を行います。2024年から2029年までの市場規模予測を、ツールタイプ別 (静的解析、動的・モデルベーステスト、SCA)、地域別 (南北アメリカ、欧州・中東・アフリカ、アジア太平洋)、エンタープライズ/組込み用途別、個別垂直市場別に提示します。長期的な成長をもたらす戦略的決定をより適切に支援するため、本レポートにはVDCのVoice of the Engineer調査に基づくエンドユーザーインサイト、ならびにベンダーの市場シェアを含む競合情勢分析も含まれています。
本レポートが取り上げる主な問い
- AIによって加速されるソフトウェアテストおよび分析の需要を牽引している要因は何でしょうか?
- AIコード生成はソフトウェア開発をどのように変革し、どのようなリスクをもたらすのでしょうか?
- ツールの成長にとって最も有望な垂直市場はどこでしょうか?
- 主要なコーディング標準の変更はいつ行われるのでしょうか?
- エンジニアリング組織は、AIの利用状況に基づいてテスト戦略をどのように変更しているのでしょうか?
- 成長しているプログラミング言語はどれでしょうか?また、組み込み分野におけるRustの実際の採用率はどの程度でしょうか?
- 最近の買収は、テストおよびSCAツールの競合情勢をどのように形成したでしょうか?
本レポートに記載されている組織
- AdaCore
- ANSYS
- Battery Ventures
- Black Duck Software
- Checkmarx
- Cursor
- DeepCode AI
- DXC Technology
- Eggplant
- ESI Group
- Finite State
- GitHub
- GitLab
- Hugging Face
- IBM
- JFrog
- Keysight
- LDRA
- MathWorks
- Mend
- MergeBase
- Microsoft
- NVIDIA
- OpenText
- Parasoft
- Perforce
- Phylum
- QA Systems
- Snyk
- Sonatype
- Tasking
- TrustInSoft
- Veracode
- Windsurf
- その他
主な調査結果
- SCAおよび自動化ソフトウェアセキュリティテストツールの世界の市場規模は、2029年に49億米ドルを突破する見込みです。
- 航空宇宙・防衛分野は、世界の防衛支出の大幅な増加と欧州の自動車産業の減速により、自動車分野を抜いて最大の垂直市場となりました。
- EUのCyber Resilience Act法の施行により、エンジニアリングチーム全体でSBOM (ソフトウェア構成材料) の生成と管理を提供するSCAツールへの需要が引き続き高まっています。
- DevOpsがソフトウェア開発を変革し続ける中、プラットフォーム提供や他ツールとの深い統合に対する需要が高まっています。
- AI生成コードを利用する組織は、AIコード生成をまだ検討または統合していない組織に比べ、テストツールのセキュリティ機能を非常に高く評価しています。
- ソフトウェア開発手法の進化に伴いエンドユーザーのニーズが変化するにつれ、ベンダー満足度評価も変動を続けています。
レポート抜粋
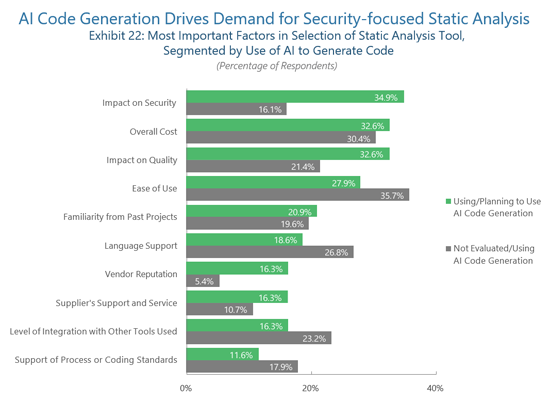
現在プロジェクトでAIを用いたコード生成を実施しているエンジニアは、静的解析ツールを異なる視点で評価しており、セキュリティと品質保証を相対的に高く重視しています。AI生成コードは新たな複雑な脆弱性をもたらす可能性があるため、AIコード生成を利用するエンジニアリング組織は、機械生成ソフトウェアを効果的に検証できるツールを優先します。一方、AIコード生成を利用していないエンジニアリング組織は、コスト面ではAI導入組織と同意見であるもの、使いやすさ、言語サポート、他ツールとの統合レベルを重視しています。このデータは、チームが社内コードに依存し、ツールチェーン全体での自動化をあまり活用しない、より従来型の開発アプローチを反映していますが、同時にソフトウェア開発組織全体におけるAI生成コードへの慎重な姿勢も示しています。さらに、AIコード生成を利用する組織は、ベンダーのブランド評価を著しく重視していました。AI導入に伴うリスクを相殺するため、エンジニアリング組織は高品質なツール提供の実績がある組織による実績あるソリューションを好みます。
AI導入が進むにつれ、セキュリティ重視のツールの重要性はさらに高まります。開発サイクルの早期段階でAI生成の脆弱性やリスクを特定するために特別に設計された静的解析ツールは、予測期間中に市場シェアを拡大していくでしょう。
目次
本レポートの内容
どのような質問が取り上げられていますか?
本レポートを読むべき人は誰ですか?
本レポートで言及されている組織
エグゼクティブサマリー
- 主な調査結果
世界市場:概要
- 静的解析ツール
- 動的/モデルベーステスト
- セキュリティ重視の静的解析
- ソフトウェア構成分析
- プラットフォームソリューション
- 合併と買収
- 言語の使用
- ソフトウェアテストのための生成AI
地域動向と予測
垂直市場の動向と予測
エンドユーザーの洞察
- 静的解析ツールの選択における最も重要な要素:コード生成におけるAIの使用状況別
- AIによるコード生成の利用状況別に見た動的テストツールの選択における最も重要な要素
- 静的解析および動的テストツールの購入に関する典型的な意思決定者
- クラウドにおける静的解析、動的テスト、SCAの使用率
- 静的解析ベンダーのパフォーマンス評価
- 動的/モデルベーステストベンダーのパフォーマンス評価
- SCAベンダーのパフォーマンス評価
競合情勢
ベンダーおよび技術プロバイダーのプロファイル
- AdaCore
- Black Duck
- Checkmarx
- IBM
- Keysight
- LDRA
- MathWorks
- Mend
- OpenText
- Parasoft
- Perforce
- QA Systems
- Snyk
- Sonatype
- TrustInSoft

