|
|
市場調査レポート
商品コード
1346742
デジタル電力ユーティリティ市場:現状分析と予測(2023~2030年)Digital Power Utility Market: Current Analysis and Forecast (2023-2030) |
||||||
|
|
|||||||
カスタマイズ可能
|
|||||||


| デジタル電力ユーティリティ市場:現状分析と予測(2023~2030年) |
|
出版日: 2023年08月01日
発行: UnivDatos Market Insights Pvt Ltd
ページ情報: 英文 146 Pages
納期: 即日から翌営業日
|

- 全表示
- 概要
- 目次
デジタル電力ユーティリティ市場は予測期間中11.2%のCAGRで力強い成長が見込まれます。これは主に、よりクリーンな再生可能エネルギーを推進するための政府プログラムやインセンティブ、世界の電力消費の増加によるものです。公益事業者は、スマートメーターとスマートグリッド、従業員向けのデジタル生産性ツール、バックオフィスプロセスの自動化という3つの手段によって、この可能性のほとんどを実現することができます。近年、すべての大手エネルギー供給会社は、オンラインチャネル、特にモバイル・チャネルに投資してきました。多くの取り組みが最適な結果をもたらしている一方で、ユーザビリティやオンラインと従来の販売チャネル間のインターフェースに関して遅れをとっているところもあります。
デジタル・ユーティリティは、エッジ・コンピューティング、デジタル・ツイン、デジタル・セキュリティ、カスタマー・エクスペリエンスといった動向を示しています。デジタル電力ユーティリティ市場は、多くの企業が提供するサービスのデジタル化に向けてシフトしており、テクノロジーの発展に伴い、これらのシステムは陳腐化したサービスを置き換えるために更新されるため、大きな成長を示しています。例えば、Leakster社はオーストラリアの新興企業で、水道を止めることなくパイプラインの状態を監視する新しい方法を開発しました。同社のACTIVEセンサーはパイプに取り付けられ、クラウドにデータを送信します。リークスターのソフトウェア・プラットフォームは、人工知能ベースのアルゴリズムを用いて、漏水、圧力変動、詰まり、流速を特定します。これにより、水道事業者は情報に基づいた資産管理とメンテナンスの決定を行うことができます。Leaksterの技術は、大規模で高価な修理の必要性を減らすことによって、水道事業体を数100万米ドル節約する可能性を秘めています。
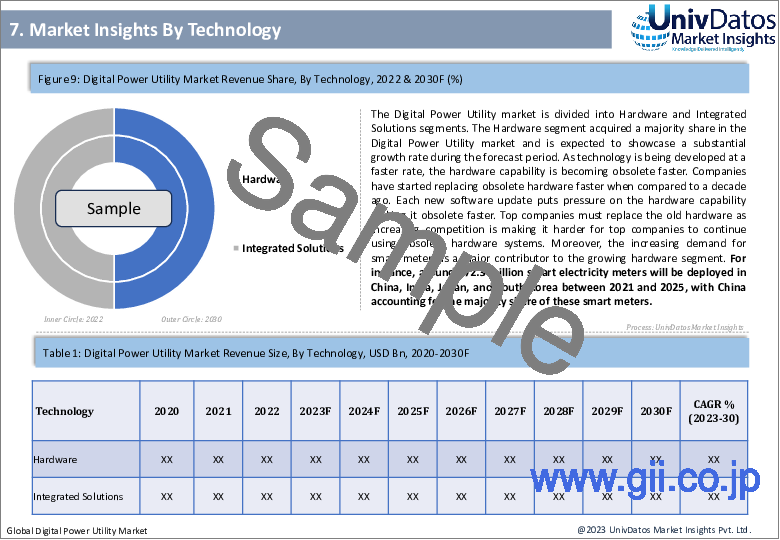
技術に基づくと、市場セグメンテーションはハードウェア・セグメントと統合ソリューション・セグメントに分けられます。ハードウェアセグメントはデジタル電力ユーティリティ市場で大半のシェアを獲得しており、予測期間中に大幅な成長率を示すと予想されています。技術開発のスピードが速まるにつれ、ハードウェアの陳腐化も加速しています。10年前と比較すると、企業は陳腐化したハードウェアをより早く交換し始めています。新しいソフトウェアが更新されるたびに、ハードウェアの性能に圧力がかかり、陳腐化が加速しています。競争の激化により、トップ企業が時代遅れのハードウェア・システムを使い続けることが難しくなっているため、トップ企業は古いハードウェアを交換しなければならないです。さらに、スマートメーターの需要増加が、ハードウェア・セグメントの成長に大きく寄与しています。例えば、2021年から2025年にかけて、中国、インド、日本、韓国で約5億7,230万台のスマート電力メーターが導入される予定であり、これらのスマートメーターの大半のシェアを中国が占めています。
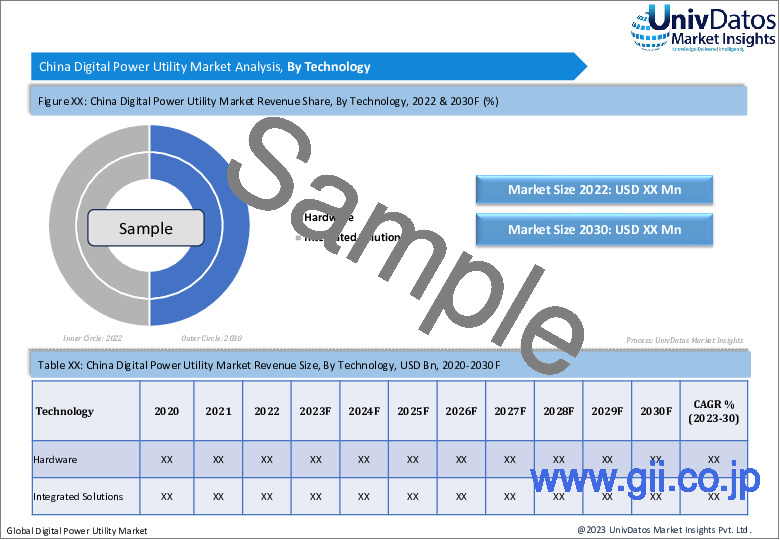
市場セグメンテーションは、ネットワークに基づき、発電、送配電、小売の各セグメントに区分されます。送電・配電セグメントは、ほとんどの国が将来の需要に対応するために送電網の開発、変更、アップグレードを行っているため、予測期間中にデジタル電力ユーティリティ市場で最も急成長するセグメントとなる見込みです。中国やインドなどの国々は、予測期間中に送電網を整備するために大規模な投資を行っており、送配電セグメントの成長に大きく貢献しています。中国は、費用対効果の高いスマートメーター製造能力を持ち、多数のスマートグリッドクラスターの開発を計画していることから、予測期間中、世界最大の送配電市場となっています。
デジタル電力ユーティリティの市場導入に関する理解を深めるため、市場は北米(米国、カナダ、その他の北米地域)、欧州(ドイツ、イタリア、英国、オランダ、フランス、その他の欧州地域)、アジア太平洋地域(中国、日本、オーストラリア、韓国、その他のアジア太平洋地域)、世界のその他の地域における世界の存在に基づいて分析されます。アジア太平洋はデジタル電力ユーティリティ市場で最も高い市場シェアを記録し、予測期間中に影響力のあるCAGRを示すことが期待されています。これは主に、中国、インド、オーストラリア、韓国、日本で多くのデジタル電力ユーティリティプロジェクトが行われているためです。さらに、各国によって設定された再生可能エネルギー目標達成のための有利な政府政策、規制、投資が市場を牽引しています。中国は、北部の国家電網(State Grid)と南部の中国南方電網(China Southern Power Grid)からの大規模な投資により、デジタル電力ユーティリティ市場で最大のプレーヤーとなっています。中国政府は、非水力自然エネルギーの割合を2030年に最大25.9%、2035年に最大36.0%とする目標を設定しており、風力と太陽光発電の総設備容量は2030年までに120万kW以上に拡大します。高い発電目標を伴う大規模投資は、予測期間中のアジア太平洋 デジタル電力ユーティリティ市場成長の触媒となるであろう。
同市場で事業を展開する主要企業には、ABB LTD、Schneider Electric SE、Microsoft Corporation、IBM、General Electric、SAP SE、Eaton Corporation、Capgemini、Oracle Corporation、Siemens AGなどがあります。
目次
第1章 市場イントロダクション
- 市場の定義
- 主な目標
- ステークホルダー
- 制限事項
第2章 調査手法または前提
- 調査プロセス
- 調査手法
- 回答者プロファイル
第3章 市場の主要な洞察
第4章 エグゼクティブサマリー
第5章 世界のデジタル電力ユーティリティ市場新型コロナウイルス感染症(COVID-19)の影響
第6章 世界のデジタル電力ユーティリティ市場収益、2020~2030年
第7章 技術別の市場洞察
- ハードウェア
- 統合ソリューション
第8章 ネットワーク別の市場洞察
- 世代
- 送配電
- 小売り
第9章 地域別の市場洞察
- 北米のデジタル電力ユーティリティ市場
- 米国
- カナダ
- その他の北米地域
- 欧州のデジタル電力ユーティリティ市場
- ドイツ
- イタリア
- 英国
- フランス
- スペイン
- その他の欧州地域
- アジア太平洋のデジタル電力ユーティリティ市場
- 中国
- 日本
- オーストラリア
- インド
- アジア太平洋のその他諸国
- その他地域のデジタル電力ユーティリティ市場
第10章 デジタル電力ユーティリティ市場力学
- 市場促進要因
- 市場の課題
- 影響分析
第11章 デジタル電力ユーティリティ市場機会
第12章 デジタル電力ユーティリティ市場動向
第13章 需要側と供給側の分析
- 需要側分析
- 供給側分析
第14章 バリューチェーン分析
第15章 競合シナリオ
- 競合情勢
- ポーターのファイブフォース分析
- 企業ランキング分析
第16章 企業プロファイル
- ABB LTD
- Schneider Electric SE
- Microsoft Corporation
- IBM
- General Electric
- SAP SE
- Eaton Corporation
- Capgemini
- Oracle Corporation
- Siemens AG
第17章 免責事項
Power utility means any organization engaged in generating, transmitting, distributing, or furnishing electricity. The digital power utility solution helps the power distributor by providing a real-time solution to control the assets using the cloud and Internet of Things application. Renewables, distributed generation, and smart grids demand new capabilities and are triggering new business models and regulatory frameworks. digital economy are disrupting the industrial landscape, while governments and regulatory bodies seek to encourage smarter measuring systems and greener standards for generation and consumption.
The Digital Power Utility Market is expected to grow at a strong CAGR of 11.2% during the forecast period. It is mainly owing to the government programs and incentives to promote cleaner renewable and increasing consumption of electricity globally. Utilities can realize most of this potential by three means: smart meters & the smart grid, digital productivity tools for employees, and automation of back-office processes. All major energy suppliers have invested in online and especially mobile channels in recent years. While many of the efforts have yielded optimal results, some lag with respect to usability and the interface between the online and traditional sales channels.
Digital Utilities are showcasing trends such as Edge computing, Digital twins, Digital security, and Customer experience. The market for digital power utility market is showcasing major growth as most companies are shifting towards the digitalization of their services provided, and as technology develops, these systems are updated in order to replace obsolete services. For instance, Leakster is an Australian startup that has developed a new way to monitor the condition of pipelines without needing to shut off the water supply. The company's ACTIVE sensor is fitted onto a pipe and sends data to the cloud, where Leakster's software platform uses artificial intelligence-based algorithms to identify leaks, pressure variations, blockages, and velocity. This allows water utility companies to make informed asset management and maintenance decisions. Leakster's technology has the potential to save water utilities millions of dollars by reducing the need for extensive and expensive repairs.
Based on Technology, The Digital Power Utility market is divided into Hardware and Integrated Solutions segments. The Hardware segment acquired a majority share in the Digital Power Utility market and is expected to showcase a substantial growth rate during the forecast period. As technology is being developed at a faster rate, the hardware capability is becoming obsolete faster. Companies have started replacing obsolete hardware faster when compared to a decade ago. Each new software update puts pressure on the hardware capability making it obsolete faster. Top companies must replace the old hardware as increasing competition is making it harder for top companies to continue using obsolete hardware systems. Moreover, the increasing demand for smart meters is a major contributor to the growing hardware segment. For instance, around 572.3 million smart electricity meters will be deployed in China, India, Japan, and South Korea between 2021 and 2025, with China accounting for the majority share of these smart meters.
Based on Network, the Digital Power Utility market is segmented into Generation, Transmission & Distribution, and Retail segments. The transmission & Distribution segment is expected to be the fastest-growing segment in the digital power utility market during the forecast period as most countries are developing, modifying, and upgrading their power grids to cope with future demand. Countries such as China and India are contributing heavily to the growth of the transmission & distribution segment during the forecast period due to massive investments by them to develop their electricity grid during the projected period. China is the largest transmission and distribution market globally during the forecast period due to its cost-effective smart meters manufacturing capability and plans to develop a high number of smart grid clusters.
For a better understanding of the market adoption of Digital Power Utility, the market is analyzed based on its worldwide presence in the countries such as North America (U.S.A, Canada, and the Rest of North America), Europe (Germany, Italy, United Kingdom, Netherlands, France, and Rest of Europe), Asia-Pacific (China, Japan, Australia, South Korea, and Rest of Asia-Pacific) and Rest of World. APAC registered the highest market share in the Digital Power Utility market and is expected to witness an influential CAGR in the forecasted period. It is mainly owing to many Digital Power Utility projects taking place in China, India, Australia, South Korea, and Japan. Moreover, favorable government policies, regulations, and investments in achieving renewable energy targets set by various countries are driving the market. China has become the largest player in the digital power utility market due to massive investments from the State Grid in the North and China Southern Power Grid in the South. The Chinese government has set targets for the share of non-hydro renewables of up to 25.9% in 2030 and 36.0% in 2035, expanding its total installed capacity of wind and solar power to over 1 200 GW by 2030. Massive investments with high targets of power generation will act as a catalyst in the growth of the APAC Digital Power Utility Market during the forecast period.
Some of the major players operating in the market are ABB LTD, Schneider Electric SE, Microsoft Corporation, IBM, General Electric, SAP SE, Eaton Corporation, Capgemini, Oracle Corporation, and Siemens AG.
TABLE OF CONTENTS
1 MARKET INTRODUCTION
- 1.1. Market Definitions
- 1.2. Main Objective
- 1.3. Stakeholders
- 1.4. Limitation
2 RESEARCH METHODOLOGY OR ASSUMPTION
- 2.1. Research Process of the Digital Power Utility Market
- 2.2. Research Methodology of the Digital Power Utility Market
- 2.3. Respondent Profile
3 MARKET KEY INSIGHTS
4 EXECUTIVE SUMMARY
5 GLOBAL DIGITAL POWER UTILITY MARKET COVID-19 IMPACT
6 GLOBAL DIGITAL POWER UTILITY MARKET REVENUE, 2020-2030F
7 MARKET INSIGHTS BY TECHNOLOGY
- 7.1. Hardware
- 7.2. Integrated Solutions
8 MARKET INSIGHTS BY NETWORK
- 8.1. Generation
- 8.2. Transmission and Distribution
- 8.3. Retail
9 MARKET INSIGHTS BY REGION
- 9.1. North America DIGITAL POWER UTILITY Market
- 9.1.1. U.S.A
- 9.1.2. Canada
- 9.1.3. Rest of North America
- 9.2. Europe DIGITAL POWER UTILITY Market
- 9.2.1. Germany
- 9.2.2. Italy
- 9.2.3. United Kingdom
- 9.2.4. France
- 9.2.5. Spain
- 9.2.6. Rest of Europe
- 9.3. Asia-Pacific DIGITAL POWER UTILITY Market
- 9.3.1. China
- 9.3.2. Japan
- 9.3.3. Australia
- 9.3.4. India
- 9.3.5. Rest of APAC
- 9.4. Rest of the World DIGITAL POWER UTILITY Market
10 DIGITAL POWER UTILITY MARKET DYNAMICS
- 10.1. Market Drivers
- 10.2. Market Challenges
- 10.3. Impact Analysis
11 DIGITAL POWER UTILITY MARKET OPPORTUNITIES
12 DIGITAL POWER UTILITY MARKET TRENDS
13 DEMAND AND SUPPLY-SIDE ANALYSIS
- 13.1. Demand Side Analysis
- 13.2. Supply Side Analysis
14 VALUE CHAIN ANALYSIS
15 COMPETITIVE SCENARIO
- 15.1. Competitive Landscape
- 15.1.1. Porters Fiver Forces Analysis
- 15.1.2. Company Ranking Analysis
16 COMPANY PROFILED
- 16.1. ABB LTD
- 16.2. Schneider Electric SE
- 16.3. Microsoft Corporation
- 16.4. IBM
- 16.5. General Electric
- 16.6. SAP SE
- 16.7. Eaton Corporation
- 16.8. Capgemini
- 16.9. Oracle Corporation
- 16.10. Siemens AG
