|
|
市場調査レポート
商品コード
1178051
動物用医薬品調剤市場 - 世界の業界分析、規模、シェア、成長、動向、予測(2022年~2031年)Animal Drug Compounding Market - Global Industry Analysis, Size, Share, Growth, Trends, and Forecast, 2022-2031 |
||||||
|
|
|||||||
|
● お客様のご希望に応じて、既存データの加工や未掲載情報(例:国別セグメント)の追加などの対応が可能です。 詳細はお問い合わせください。 |
|||||||


| 動物用医薬品調剤市場 - 世界の業界分析、規模、シェア、成長、動向、予測(2022年~2031年) |
|
出版日: 2022年11月15日
発行: Transparency Market Research
ページ情報: 英文 233 Pages
納期: 2~10営業日
|
- 全表示
- 概要
- 図表
- 目次
当レポートでは、世界の動物用医薬品調剤市場について調査し、市場の概要とともに、2022年~2031年の予測、製品別、動物タイプ別、剤形別、投与経路別、地域別の動向、および市場に参入する企業のプロファイルなどを提供しています。
目次
第1章 序文
第2章 前提と調査手法
第3章 エグゼクティブサマリー:世界の動物用医薬品調剤市場
第4章 市場概要
- イントロダクション
- 概要
- 市場力学
- 促進要因
- 抑制要因
- 機会
- 世界の動物用医薬品調剤市場の分析と予測、2017年~2031年
第5章 主な洞察
第6章 世界の動物用医薬品調剤市場の分析と予測、製品別
- イントロダクションと定義
- 主な調査結果/開発
- 市場価値予測、製品別、2017年~2031年
- 抗感染薬
- 抗炎症薬
- CNS薬
- 胃腸薬
- その他
- 市場魅力分析、製品別
第7章 世界の動物用医薬品調剤市場の分析と予測、動物タイプ別
- イントロダクションと定義
- 主な調査結果/開発
- 市場価値予測、動物タイプ別、2017年~2031年
- コンパニオンアニマル
- 家畜
- 市場魅力分析、動物タイプ別
第8章 世界の動物用医薬品調剤市場の分析と予測、剤形別
- イントロダクションと定義
- 主な調査結果/開発
- 市場価値予測、剤形別、2017年~2031年
- カプセル
- 溶剤
- 粉末
- 懸濁液
- その他
- 市場魅力度分析、剤形別
第9章 世界の動物用医薬品調剤市場の分析と予測、投与経路別
- イントロダクションと定義
- 主な調査結果/開発
- 市場価値予測、投与経路別、2017年~2031年
- 経口
- 注射
- 局所
- 経腸
- 点眼
- 市場魅力分析、投与経路別
第10章 世界の動物用医薬品調剤市場の分析と予測、地域別
- 主な調査結果
- 地域別市場価値予測
- 北米
- 欧州
- アジア太平洋
- ラテンアメリカ
- 中東・アフリカ
- 市場魅力分析、地域別
第11章 北米の動物用医薬品調剤市場の分析と予測
第12章 欧州の動物用医薬品調剤市場の分析と予測
第13章 アジア太平洋の動物用医薬品調剤市場の分析と予測
第14章 ラテンアメリカの動物用医薬品調剤市場の分析と予測
第15章 中東・アフリカの動物用医薬品調剤市場の分析と予測
第16章 競合情勢
- 市場参入企業-競合マトリクス(層および企業規模別)
- 市場シェア分析、企業別、2021年
- 企業プロファイル
- Wedgewood Pharmacy
- Triangle Compounding Pharmacy
- Davis Islands Pharmacy
- Custom Med Compounding Pharmacy
- Central Compounding Center South
- Wellness Pharmacy of Cary
- Caringbah Compounding Pharmacy
- Millers Pharmacy
- Smith's Pharmacy
- Specialist Compounding Pharmacy Pte Ltd.
- Tache Pharmacy
List of Tables
- Table 01: Global Animal Drug Compounding Market Value (US$ Mn) Forecast, by Product, 2017-2031
- Table 02: Global Animal Drug Compounding Market Value (US$ Mn) Forecast, by Anti-infectives, 2017-2031
- Table 03: Global Animal Drug Compounding Market Value (US$ Mn) Forecast, by Anti-inflammatory, 2017-2031
- Table 04: Global Animal Drug Compounding Market Value (US$ Mn) Forecast, by CNS Agents, 2017-2031
- Table 05: Global Animal Drug Compounding Market Value (US$ Mn) Forecast, by GI Drugs, 2017-2031
- Table 06: Global Animal Drug Compounding Market Value (US$ My) Forecast, by Others, 2017-2031
- Table 07: Global Animal Drug Compounding Market Value (US$ Mn) Forecast, by Animal Type, 2017-2031
- Table 08: Global Animal Drug Compounding Market Value (US$ Mn) Forecast, by Anti-infectives, 2017-2031
- Table 09: Global Animal Drug Compounding Market Value (US$ Mn) Forecast, by Dosage Form, 2017-2031
- Table 10: Global Animal Drug Compounding Market Value (US$ Mn) Forecast, by Route of Administration, 2017-2031
- Table 11: Global Animal Drug Compounding Market Value (US$ Mn) Forecast, by Region, 2017-2031
- Table 12: North America Animal Drug Compounding Market Value (US$ Mn) Forecast, by Country, 2017-2031
- Table 13: North America Animal Drug Compounding Market Value (US$ Mn) Forecast, by Product, 2017-2031
- Table 14: North America Animal Drug Compounding Market Value (US$ Mn) Forecast, by Anti-infectives, 2017-2031
- Table 15: North America Animal Drug Compounding Market Value (US$ Mn) Forecast, by Anti-inflammatory, 2017-2031
- Table 16: North America Animal Drug Compounding Market Value (US$ Mn) Forecast, by CNS Agents, 2017-2031
- Table 17: North America Animal Drug Compounding Market Value (US$ Mn) Forecast, by GI Drugs, 2017-2031
- Table 18: North America Animal Drug Compounding Market Value (US$ Mn) Forecast, by Others, 2017-2031
- Table 19: North America Animal Drug Compounding Market Value (US$ Mn) Forecast, by Animal Type, 2017-2031
- Table 20: North America Animal Drug Compounding Market Value (US$ Mn) Forecast, by Companion Animal, 2017-2031
- Table 21: North America Animal Drug Compounding Market Value (US$ Mn) Forecast, by Dosage Form, 2017-2031
- Table 22: North America Animal Drug Compounding Market Value (US$ Mn) Forecast, by Route of Administration, 2017-2031
- Table 23: Europe Animal Drug Compounding Market Value (US$ Mn) Forecast, by Country/Sub-region, 2017-2031
- Table 24: Europe Animal Drug Compounding Market Value (US$ Mn) Forecast, by Product, 2017-2031
- Table 25: Europe Animal Drug Compounding Market Value (US$ Mn) Forecast, by Anti-infectives, 2017-2031
- Table 26: Europe Animal Drug Compounding Market Value (US$ Mn) Forecast, by Anti-inflammatory, 2017-2031
- Table 27: Europe Animal Drug Compounding Market Value (US$ Mn) Forecast, by CNS Agents, 2017-2031
- Table 28: Europe Animal Drug Compounding Market Value (US$ Mn) Forecast, by GI Drugs, 2017-2031
- Table 29: Europe Animal Drug Compounding Market Value (US$ Mn) Forecast, by Others, 2017-2031
- Table 30: Europe Animal Drug Compounding Market Value (US$ Mn) Forecast, by Animal Type, 2017-2031
- Table 31: Europe Animal Drug Compounding Market Value (US$ Mn) Forecast, by Companion Animal, 2017-2031
- Table 32: Europe Animal Drug Compounding Market Value (US$ Mn) Forecast, by Dosage Form, 2017-2031
- Table 33: Europe Animal Drug Compounding Market Value (US$ Mn) Forecast, by Route of Administration, 2017-2031
- Table 34: Asia Pacific Animal Drug Compounding Market Value (US$ Mn) Forecast, by Country/Sub-region, 2017-2031
- Table 35: Asia Pacific Animal Drug Compounding Market Value (US$ Mn) Forecast, by Product, 2017-2031
- Table 36: Asia Pacific Animal Drug Compounding Market Value (US$ Mn) Forecast, by Anti-infectives, 2017-2031
- Table 37: Asia Pacific Animal Drug Compounding Market Value (US$ Mn) Forecast, by Anti-inflammatory, 2017-2031
- Table 38: Asia Pacific Animal Drug Compounding Market Value (US$ Mn) Forecast, by CNS Agents, 2017-2031
- Table 39: Asia Pacific Animal Drug Compounding Market Value (US$ Mn) Forecast, by GI Drugs, 2017-2031
- Table 40: Asia Pacific Animal Drug Compounding Market Value (US$ Mn) Forecast, by Others, 2017-2031
- Table 41: Asia Pacific Animal Drug Compounding Market Value (US$ Mn) Forecast, by Animal Type, 2017-2031
- Table 42: Asia Pacific Animal Drug Compounding Market Value (US$ Mn) Forecast, by Companion Animal, 2017-2031
- Table 43: Asia Pacific Animal Drug Compounding Market Value (US$ Mn) Forecast, by Dosage Form, 2017-2031
- Table 44: Asia Pacific Animal Drug Compounding Market Value (US$ Mn) Forecast, by Route of Administration, 2017-2031
- Table 45: Latin America Animal Drug Compounding Market Value (US$ Mn) Forecast, by Country/Sub-region, 2017-2031
- Table 46: Latin America Animal Drug Compounding Market Value (US$ Mn) Forecast, by Product, 2017-2031
- Table 47: Latin America Animal Drug Compounding Market Value (US$ Mn) Forecast, by Anti-infectives, 2017-2031
- Table 48: Latin America Animal Drug Compounding Market Value (US$ Mn) Forecast, by Anti-inflammatory, 2017-2031
- Table 49: Latin America Animal Drug Compounding Market Value (US$ Mn) Forecast, by CNS Agents, 2017-2031
- Table 50: Latin America Animal Drug Compounding Market Value (US$ Mn) Forecast, by GI Drugs, 2017-2031
- Table 51: Latin America Animal Drug Compounding Market Value (US$ Mn) Forecast, by Others, 2017-2031
- Table 52: Latin America Animal Drug Compounding Market Value (US$ Mn) Forecast, by Animal Type, 2017-2031
- Table 53: Latin America Animal Drug Compounding Market Value (US$ Mn) Forecast, by Companion Animal, 2017-2031
- Table 54: Latin America Animal Drug Compounding Market Value (US$ Mn) Forecast, by Dosage Form, 2017-2031
- Table 55: Latin America Animal Drug Compounding Market Value (US$ Mn) Forecast, by Route of Administration, 2017-2031
- Table 56: Middle East & Africa Animal Drug Compounding Market Value (US$ Mn) Forecast, by Country/Sub-region, 2017-2031
- Table 57: Middle East & Africa Animal Drug Compounding Market Value (US$ Mn) Forecast, by Product, 2017-2031
- Table 58: Middle East & Africa Animal Drug Compounding Market Value (US$ Mn) Forecast, by Anti-infectives, 2017-2031
- Table 59: Middle East & Africa Animal Drug Compounding Market Value (US$ Mn) Forecast, by Anti-inflammatory, 2017-2031
- Table 60: Middle East & Africa Animal Drug Compounding Market Value (US$ Mn) Forecast, by CNS Agents, 2017-2031
- Table 61: Middle East & Africa Animal Drug Compounding Market Value (US$ Mn) Forecast, by GI Drugs, 2017-2031
- Table 62: Middle East & Africa Animal Drug Compounding Market Value (US$ Mn) Forecast, by Others, 2017-2031
- Table 63: Middle East & Africa Animal Drug Compounding Market Value (US$ Mn) Forecast, by Animal Type, 2017-2031
- Table 64: Middle East & Africa Animal Drug Compounding Market Value (US$ Mn) Forecast, by Companion Animal, 2017-2031
- Table 65: Middle East & Africa Animal Drug Compounding Market Value (US$ Mn) Forecast, by Dosage Form, 2017-2031
- Table 66: Middle East & Africa Animal Drug Compounding Market Value (US$ Mn) Forecast, by Route of Administration, 2017-2031
List of Figures
- Figure 01: Global Animal Drug Compounding Market, by Product, 2021 and 2031
- Figure 02: Global Animal Drug Compounding Market Attractiveness Analysis, Product, 2022-2031
- Figure 03: Global Animal Drug Compounding Market (US$ Mn), by Anti-infectives, 2017-2031
- Figure 04: Global Animal Drug Compounding Market (US$ Mn), by Anti-inflammatory, 2017-2031
- Figure 05: Global Animal Drug Compounding Market (US$ Mn), by CNS Agents, 2017-2031
- Figure 06: Global Animal Drug Compounding Market (US$ Mn), by GI Drugs, 2017-2031
- Figure 07: Global Animal Drug Compounding Market (US$ Mn), by Others, 2017-2031
- Figure 08: Global Animal Drug Compounding Market, by Animal Type, 2021 and 2031
- Figure 09: Global Animal Drug Compounding Market Attractiveness Analysis, Animal Type, 2022-2031
- Figure 10: Global Animal Drug Compounding Market (US$ Mn), by Companion Animal, 2017-2031
- Figure 11: Global Animal Drug Compounding Market (US$ Mn), by Livestock Animal, 2017-2031
- Figure 12: Global Animal Drug Compounding Market, by Dosage Form, 2021 and 2031
- Figure 13: Global Animal Drug Compounding Market Attractiveness Analysis, Dosage Form, 2022-2031
- Figure 14: Global Animal Drug Compounding Market (US$ Mn), by Capsules, 2017-2031
- Figure 15: Global Animal Drug Compounding Market (US$ Mn), by Solutions, 2017-2031
- Figure 16: Global Animal Drug Compounding Market (US$ Mn), by Powders, 2017-2031
- Figure 17: Global Animal Drug Compounding Market (US$ Mn), by Suspension, 2017-2031
- Figure 18: Global Animal Drug Compounding Market (US$ Mn), by Others, 2017-2031
- Figure 19: Global Animal Drug Compounding Market, by Route of Administration, 2021 and 2031
- Figure 20: Global Animal Drug Compounding Market Attractiveness Analysis, Route of Administration, 2022-2031
- Figure 21: Global Animal Drug Compounding Market (US$ Mn), by Oral, 2017-2031
- Figure 22: Global Animal Drug Compounding Market (US$ Mn), by Injectable, 2017-2031
- Figure 23: Global Animal Drug Compounding Market (US$ Mn), by Topical, 2017-2031
- Figure 24: Global Animal Drug Compounding Market (US$ Mn), by Rectal, 2017-2031
- Figure 25: Global Animal Drug Compounding Market (US$ Mn), by Ocular, 2017-2031
- Figure 26: Global Animal Drug Compounding Market Value Share Analysis, by Region, 2021 and 2031
- Figure 27: Global Animal Drug Compounding Market Attractiveness Analysis, by Region, 2022-2031
- Figure 28: North America Animal Drug Compounding Market Value (US$ Mn) Forecast and Y-o-Y Growth (%) Projection, 2017-2031
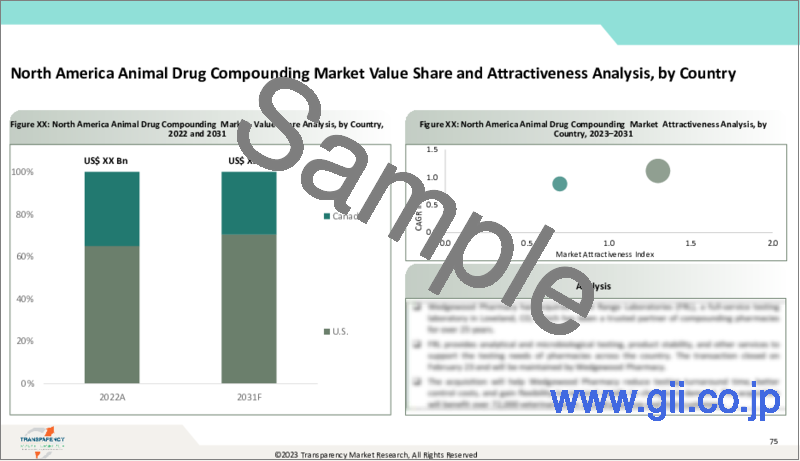
- Figure 29: North America Animal Drug Compounding Market Value Share Analysis, by Country, 2021 and 2031
- Figure 30: North America Animal Drug Compounding Market Attractiveness Analysis, by Country, 2022-2031
- Figure 31: North America Animal Drug Compounding Market Value Share Analysis, by Product, 2021 and 2031
- Figure 32: North America Animal Drug Compounding Market Attractiveness Analysis, by Product, 2022-2031
- Figure 33: North America Animal Drug Compounding Market Value Share Analysis, by Animal Type, 2021 and 2031
- Figure 34: North America Animal Drug Compounding Market Attractiveness Analysis, by Animal Type, 2022-2031
- Figure 35: North America Animal Drug Compounding Market Value Share Analysis, by Dosage Form, 2021 and 2031
- Figure 36: North America Animal Drug Compounding Market Attractiveness Analysis, by Dosage Form, 2022-2031
- Figure 37: North America Animal Drug Compounding Market Value Share Analysis, by Route of Administration, 2021 and 2031
- Figure 38: North America Animal Drug Compounding Market Attractiveness Analysis, by Route of Administration, 2022-2031
- Figure 39: Europe Animal Drug Compounding Market Value (US$ Mn) Forecast and Y-o-Y Growth (%) Projection, 2017-2031
- Figure 40: Europe Animal Drug Compounding Market Value Share Analysis, by Country/Sub-region, 2021 and 2031
- Figure 41: Europe Animal Drug Compounding Market Attractiveness Analysis, by Country/Sub-region, 2022-2031
- Figure 42: Europe Animal Drug Compounding Market Value Share Analysis, by Product, 2021 and 2031
- Figure 43: Europe Animal Drug Compounding Market Attractiveness Analysis, by Product, 2022-2031
- Figure 44: Europe Animal Drug Compounding Market Value Share Analysis, by Animal Type, 2021 and 2031
- Figure 45: Europe Animal Drug Compounding Market Attractiveness Analysis, by Animal Type, 2022-2031
- Figure 46: Europe Animal Drug Compounding Market Value Share Analysis, by Dosage Form, 2021 and 2031
- Figure 47: Europe Animal Drug Compounding Market Attractiveness Analysis, by Dosage Form, 2022-2031
- Figure 48: Europe Animal Drug Compounding Market Value Share Analysis, by Route of Administration, 2021 and 2031
- Figure 49: Europe Animal Drug Compounding Market Attractiveness Analysis, by Route of Administration, 2022-2031
- Figure 50: Asia Pacific Animal Drug Compounding Market Value (US$ Mn) Forecast and Y-o-Y Growth (%) Projection, 2017-2031
- Figure 51: Asia Pacific Animal Drug Compounding Market Value Share Analysis, by Country/Sub-region, 2021 and 2031
- Figure 52: Asia Pacific Animal Drug Compounding Market Attractiveness Analysis, by Country/Sub-region, 2022-2031
- Figure 53: Asia Pacific Animal Drug Compounding Market Value Share Analysis, by Product, 2021 and 2031
- Figure 54: Asia Pacific Animal Drug Compounding Market Attractiveness Analysis, by Product, 2022-2031
- Figure 55: Asia Pacific Animal Drug Compounding Market Value Share Analysis, by Animal Type, 2021 and 2031
- Figure 56: Asia Pacific Animal Drug Compounding Market Attractiveness Analysis, by Animal Type, 2022-2031
- Figure 57: Asia Pacific Animal Drug Compounding Market Value Share Analysis, by Dosage Form, 2021 and 2031
- Figure 58: Asia Pacific Animal Drug Compounding Market Attractiveness Analysis, by Dosage Form, 2022-2031
- Figure 59: Asia Pacific Animal Drug Compounding Market Value Share Analysis, by Route of Administration, 2021 and 2031
- Figure 60: Asia Pacific Animal Drug Compounding Market Attractiveness Analysis, by Route of Administration, 2022-2031
- Figure 61: Latin America Animal Drug Compounding Market Value (US$ Mn) Forecast and Y-o-Y Growth (%) Projection, 2017-2031
- Figure 62: Latin America Animal Drug Compounding Market Value Share Analysis, by Country/Sub-region, 2021 and 2031
- Figure 63: Latin America Animal Drug Compounding Market Attractiveness Analysis, by Country/Sub-region, 2022-2031
- Figure 64: Latin America Animal Drug Compounding Market Value Share Analysis, by Product, 2021 and 2031
- Figure 65: Latin America Animal Drug Compounding Market Attractiveness Analysis, by Product, 2022-2031
- Figure 66: Latin America Animal Drug Compounding Market Value Share Analysis, by Animal Type, 2021 and 2031
- Figure 67: Latin America Animal Drug Compounding Market Attractiveness Analysis, by Animal Type, 2022-2031
- Figure 68: Latin America Animal Drug Compounding Market Value Share Analysis, by Dosage Form, 2021 and 2031
- Figure 69: Latin America Animal Drug Compounding Market Attractiveness Analysis, by Dosage Form, 2022-2031
- Figure 70: Latin America Animal Drug Compounding Market Value Share Analysis, by Route of Administration, 2021 and 2031
- Figure 71: Latin America Animal Drug Compounding Market Attractiveness Analysis, by Route of Administration, 2022-2031
- Figure 72: Middle East & Africa Animal Drug Compounding Market Value (US$ Mn) Forecast and Y-o-Y Growth (%) Projection, 2017-2031
- Figure 73: Middle East & Africa Animal Drug Compounding Market Value Share Analysis, by Country/Sub-region, 2021 and 2031
- Figure 74: Middle East and Africa Animal Drug Compounding Market Attractiveness Analysis, by Country/Sub-region, 2022-2031
- Figure 75: Middle East & Africa Animal Drug Compounding Market Value Share Analysis, by Product, 2021 and 2031
- Figure 76: Middle East & Africa Animal Drug Compounding Market Attractiveness Analysis, by Product, 2022-2031
- Figure 77: Middle East & Africa Animal Drug Compounding Market Value Share Analysis, by Animal Type, 2021 and 2031
- Figure 78: Middle East & Africa Animal Drug Compounding Market Attractiveness Analysis, by Animal Type, 2022-2031
- Figure 79: Middle East & Africa Animal Drug Compounding Market Value Share Analysis, by Dosage Form, 2021 and 2031
- Figure 80: Middle East & Africa Animal Drug Compounding Market Attractiveness Analysis, by Dosage Form, 2022-2031
- Figure 81: Middle East & Africa Animal Drug Compounding Market Value Share Analysis, by Route of Administration, 2021 and 2031
- Figure 82: Middle East & Africa Animal Drug Compounding Market Attractiveness Analysis, by Route of Administration, 2022-2031
TMR's report on the global animal drug compounding market studies the past as well as the current growth trends and opportunities to gain valuable insights of the indicators of the market during the forecast period from 2022 to 2031. The report provides revenue of the global animal drug compounding market for the period 2017-2031, considering 2021 as the base year and 2031 as the forecast year. The report also provides the compound annual growth rate (CAGR %) of the global animal drug compounding market from 2022 to 2031.
The report has been prepared after an extensive research. Primary research involved bulk of the research efforts, wherein analysts carried out interviews with key opinion leaders, industry leaders, and opinion makers. Secondary research involved referring to key players' product literature, annual reports, press releases, and relevant documents to understand the animal drug compounding market.
The report delves into the competitive landscape of the global animal drug compounding market. Key players operating in the global animal drug compounding market have been identified and each one of these has been profiled, in terms of various attributes. Company overview, financial standings, recent developments, and SWOT are attributes of players in the global animal drug compounding market profiled in this report.
Table of Contents
1. Preface
- 1.1. Market Definition and Scope
- 1.2. Market Segmentation
- 1.3. Key Research Objectives
- 1.4. Research Highlights
2. Assumptions and Research Methodology
3. Executive Summary: Global Animal Drug Compounding Market
4. Market Overview
- 4.1. Introduction
- 4.1.1. Product Definition
- 4.1.2. Industry Evolution / Developments
- 4.2. Overview
- 4.3. Market Dynamics
- 4.3.1. Drivers
- 4.3.2. Restraints
- 4.3.3. Opportunities
- 4.4. Global Animal Drug Compounding Market Analysis and Forecast, 2017-2031
5. Key Insights
- 5.1. Technological Advancements
- 5.2. Regulatory Scenario by Region/globally
- 5.3. Key Industry Events (mergers, acquisitions, partnerships, collaborations, etc.)
- 5.4. COVID-19 Pandemic Impact on Industry (value chain and short / mid / long term impact)
6. Global Animal Drug Compounding Market Analysis and Forecast, by Product
- 6.1. Introduction & Definition
- 6.2. Key Findings / Developments
- 6.3. Market Value Forecast, by Product, 2017-2031
- 6.3.1. Anti-invectives
- 6.3.1.1. Metranidazole
- 6.3.1.2. Ketaconazole
- 6.3.1.3. Other Anti invectives
- 6.3.2. Anti-inflammatory
- 6.3.2.1. Prednisolone
- 6.3.2.2. Tramadol
- 6.3.2.3. Others
- 6.3.3. CNS Agents
- 6.3.3.1. Potassium bromide
- 6.3.3.2. Gabapentin
- 6.3.3.3. Other CNS agents
- 6.3.4. GI Drugs
- 6.3.4.1. Apomorphine
- 6.3.4.2. Ursodiol
- 6.3.4.3. Cisapride
- 6.3.4.4. Other GI Drugs
- 6.3.5. Others
- 6.3.1. Anti-invectives
- 6.4. Market Attractiveness Analysis, by Product
7. Global Animal Drug Compounding Market Analysis and Forecast, by Animal Type
- 7.1. Introduction & Definition
- 7.2. Key Findings / Developments
- 7.3. Market Value Forecast, by Animal Type, 2017-2031
- 7.3.1. Companion Animal
- 7.3.1.1. Dogs
- 7.3.1.2. Cats
- 7.3.1.3. Others
- 7.3.2. Live Stock
- 7.3.1. Companion Animal
- 7.4. Market Attractiveness Analysis, by Animal Type
8. Global Animal Drug Compounding Market Analysis and Forecast, by Dosage Form
- 8.1. Introduction & Definition
- 8.2. Key Findings / Developments
- 8.3. Market Value Forecast, by Dosage Form, 2017-2031
- 8.3.1. Capsules
- 8.3.2. Solutions
- 8.3.3. Powders
- 8.3.4. Suspension
- 8.3.5. Others
- 8.4. Market Attractiveness Analysis, by Dosage Form
9. Global Animal Drug Compounding Market Analysis and Forecast, by Route of Administration
- 9.1. Introduction & Definition
- 9.2. Key Findings / Developments
- 9.3. Market Value Forecast, by Route of Administration, 2017-2031
- 9.3.1. Oral
- 9.3.2. Injectable
- 9.3.3. Topical
- 9.3.4. Rectal
- 9.3.5. Ocular
- 9.4. Market Attractiveness Analysis, by Route of Administration
10. Global Animal Drug Compounding Market Analysis and Forecast, by Region
- 10.1. Key Findings
- 10.2. Market Value Forecast, by Region
- 10.2.1. North America
- 10.2.2. Europe
- 10.2.3. Asia Pacific
- 10.2.4. Latin America
- 10.2.5. Middle East & Africa
- 10.3. Market Attractiveness Analysis, by Region
11. North America Animal Drug Compounding Market Analysis and Forecast
- 11.1. Introduction
- 11.1.1. Key Findings
- 11.2. Market Value Forecast, by Product, 2017-2031
- 11.2.1. Anti-infectives
- 11.2.1.1. Metranidazole
- 11.2.1.2. Ketaconazole
- 11.2.1.3. Other Anti-infectives
- 11.2.2. Anti-inflammatory
- 11.2.2.1. Prednisolone
- 11.2.2.2. Tramadol
- 11.2.2.3. Others
- 11.2.3. CNS Agents
- 11.2.3.1. Potassium bromide
- 11.2.3.2. Gabapentin
- 11.2.3.3. Other CNS agents
- 11.2.4. GI Drugs
- 11.2.4.1. Apomorphine
- 11.2.4.2. Ursodiol
- 11.2.4.3. Cisapride
- 11.2.4.4. Other GI Drugs
- 11.2.5. Others
- 11.2.1. Anti-infectives
- 11.3. Market Value Forecast, by Animal Type, 2017-2031
- 11.3.1. Companion Animal
- 11.3.1.1. Dogs
- 11.3.1.2. Cats
- 11.3.1.3. Others
- 11.3.2. Live Stock
- 11.3.1. Companion Animal
- 11.4. Market Value Forecast, by Dosage Form, 2017-2031
- 11.4.1. Capsules
- 11.4.2. Solutions
- 11.4.3. Powders
- 11.4.4. Suspension
- 11.4.5. Others
- 11.5. Market Value Forecast, by Route of Administration, 2017-2031
- 11.5.1. Oral
- 11.5.2. Injectable
- 11.5.3. Topical
- 11.5.4. Rectal
- 11.5.5. Ocular
- 11.6. Market Value Forecast, by Country, 2017-2031
- 11.6.1. U.S.
- 11.6.2. Canada
- 11.7. Market Attractiveness Analysis
- 11.7.1. By Product
- 11.7.2. By Animal Type
- 11.7.3. By Dosage Form
- 11.7.4. By Route of Administration
- 11.7.5. By Country
12. Europe Animal Drug Compounding Market Analysis and Forecast
- 12.1. Introduction
- 12.1.1. Key Findings
- 12.2. Market Value Forecast, by Product, 2017-2031
- 12.2.1. Anti-infectives
- 12.2.1.1. Metranidazole
- 12.2.1.2. Ketaconazole
- 12.2.1.3. Other Anti-infectives
- 12.2.2. Anti-inflammatory
- 12.2.2.1. Prednisolone
- 12.2.2.2. Tramadol
- 12.2.2.3. Others
- 12.2.3. CNS Agents
- 12.2.3.1. Potassium bromide
- 12.2.3.2. Gabapentin
- 12.2.3.3. Other CNS agents
- 12.2.4. GI Drugs
- 12.2.4.1. Apomorphine
- 12.2.4.2. Ursodiol
- 12.2.4.3. Cisapride
- 12.2.4.4. Other GI Drugs
- 12.2.5. Others
- 12.2.1. Anti-infectives
- 12.3. Market Value Forecast, by Animal Type, 2017-2031
- 12.3.1. Companion Animal
- 12.3.1.1. Dogs
- 12.3.1.2. Cats
- 12.3.1.3. Others
- 12.3.2. Live Stock
- 12.3.1. Companion Animal
- 12.4. Market Value Forecast, by Dosage Form, 2017-2031
- 12.4.1. Capsules
- 12.4.2. Solutions
- 12.4.3. Powders
- 12.4.4. Suspension
- 12.4.5. Others
- 12.5. Market Value Forecast, by Route of Administration, 2017-2031
- 12.5.1. Oral
- 12.5.2. Injectable
- 12.5.3. Topical
- 12.5.4. Rectal
- 12.5.5. Ocular
- 12.6. Market Value Forecast, by Country/Sub-region, 2017-2031
- 12.6.1. Germany
- 12.6.2. U.K.
- 12.6.3. France
- 12.6.4. Spain
- 12.6.5. Italy
- 12.6.6. Rest of Europe
- 12.7. Market Attractiveness Analysis
- 12.7.1. By Product
- 12.7.2. By Animal Type
- 12.7.3. By Dosage Form
- 12.7.4. By Route of Administration
- 12.7.5. By Country/Sub-region
13. Asia Pacific Animal Drug Compounding Market Analysis and Forecast
- 13.1. Introduction
- 13.1.1. Key Findings
- 13.2. Market Value Forecast, by Product, 2017-2031
- 13.2.1. Anti-infectives
- 13.2.1.1. Metranidazole
- 13.2.1.2. Ketaconazole
- 13.2.1.3. Other Anti-infectives
- 13.2.2. Anti-inflammatory
- 13.2.2.1. Prednisolone
- 13.2.2.2. Tramadol
- 13.2.2.3. Others
- 13.2.3. CNS Agents
- 13.2.3.1. Potassium bromide
- 13.2.3.2. Gabapentin
- 13.2.3.3. Other CNS agents
- 13.2.4. GI Drugs
- 13.2.4.1. Apomorphine
- 13.2.4.2. Ursodiol
- 13.2.4.3. Cisapride
- 13.2.4.4. Other GI Drugs
- 13.2.5. Others
- 13.2.1. Anti-infectives
- 13.3. Market Value Forecast, by Animal Type, 2017-2031
- 13.3.1. Companion Animal
- 13.3.1.1. Dogs
- 13.3.1.2. Cats
- 13.3.1.3. Others
- 13.3.2. Live Stock
- 13.3.1. Companion Animal
- 13.4. Market Value Forecast, by Dosage Form, 2017-2031
- 13.4.1. Capsules
- 13.4.2. Solutions
- 13.4.3. Powders
- 13.4.4. Suspension
- 13.4.5. Others
- 13.5. Market Value Forecast, by Route of Administration, 2017-2031
- 13.5.1. Oral
- 13.5.2. Injectable
- 13.5.3. Topical
- 13.5.4. Rectal
- 13.5.5. Ocular
- 13.6. Market Value Forecast, by Country/Sub-region, 2017-2031
- 13.6.1. China
- 13.6.2. Japan
- 13.6.3. India
- 13.6.4. Australia & New Zealand
- 13.6.5. Rest of Asia Pacific
- 13.7. Market Attractiveness Analysis
- 13.7.1. By Product
- 13.7.2. By Animal Type
- 13.7.3. By Dosage Form
- 13.7.4. By Route of Administration
- 13.7.5. By Country/Sub-region
14. Latin America Animal Drug Compounding Market Analysis and Forecast
- 14.1. Introduction
- 14.1.1. Key Findings
- 14.2. Market Value Forecast, by Product, 2017-2031
- 14.2.1. Anti-infectives
- 14.2.1.1. Metranidazole
- 14.2.1.2. Ketaconazole
- 14.2.1.3. Other Anti-infectives
- 14.2.2. Anti-inflammatory
- 14.2.2.1. Prednisolone
- 14.2.2.2. Tramadol
- 14.2.2.3. Other Anti-inflammatory
- 14.2.3. CNS Agents
- 14.2.3.1. Potassium bromide
- 14.2.3.2. Gabapentin
- 14.2.3.3. Other CNS agents
- 14.2.4. GI Drugs
- 14.2.4.1. Apomorphine
- 14.2.4.2. Ursodiol
- 14.2.4.3. Cisapride
- 14.2.4.4. Other GI Drugs
- 14.2.5. Others
- 14.2.1. Anti-infectives
- 14.3. Market Value Forecast, by Animal Type, 2017-2031
- 14.3.1. Companion Animal
- 14.3.1.1. Dogs
- 14.3.1.2. Cats
- 14.3.1.3. Others
- 14.3.2. Live Stock
- 14.3.1. Companion Animal
- 14.4. Market Value Forecast, by Dosage Form, 2017-2031
- 14.4.1. Capsules
- 14.4.2. Solutions
- 14.4.3. Powders
- 14.4.4. Suspension
- 14.4.5. Others
- 14.5. Market Value Forecast, by Route of Administration, 2017-2031
- 14.5.1. Oral
- 14.5.2. Injectable
- 14.5.3. Topical
- 14.5.4. Rectal
- 14.5.5. Ocular
- 14.6. Market Value Forecast, by Country/Sub-region, 2017-2031
- 14.6.1. Brazil
- 14.6.2. Mexico
- 14.6.3. Rest of Latin America
- 14.7. Market Attractiveness Analysis
- 14.7.1. By Product
- 14.7.2. By Animal Type
- 14.7.3. By Dosage Form
- 14.7.4. By Route of Administration
- 14.7.5. By Country/Sub-region
15. Middle East & Africa Animal Drug Compounding Market Analysis and Forecast
- 15.1. Introduction
- 15.1.1. Key Findings
- 15.2. Market Value Forecast, by Product, 2017-2031
- 15.2.1. Anti-infectives
- 15.2.1.1. Metranidazole
- 15.2.1.2. Ketaconazole
- 15.2.1.3. Other Anti-infectives
- 15.2.2. Anti-inflammatory
- 15.2.2.1. Prednisolone
- 15.2.2.2. Tramadol
- 15.2.2.3. Other Anti-inflammatory
- 15.2.3. CNS Agents
- 15.2.3.1. Potassium bromide
- 15.2.3.2. Gabapentin
- 15.2.3.3. Other CNS agents
- 15.2.4. GI Drugs
- 15.2.4.1. Apomorphine
- 15.2.4.2. Ursodiol
- 15.2.4.3. Cisapride
- 15.2.4.4. Other GI Drugs
- 15.2.5. Others
- 15.2.1. Anti-infectives
- 15.3. Market Value Forecast, by Animal Type, 2017-2031
- 15.3.1. Companion Animal
- 15.3.1.1. Dogs
- 15.3.1.2. Cats
- 15.3.1.3. Others
- 15.3.2. Live Stock
- 15.3.1. Companion Animal
- 15.4. Market Value Forecast, by Dosage Form, 2017-2031
- 15.4.1. Capsules
- 15.4.2. Solutions
- 15.4.3. Powders
- 15.4.4. Suspension
- 15.4.5. Others
- 15.5. Market Value Forecast, by Route of Administration, 2017-2031
- 15.5.1. Oral
- 15.5.2. Injectable
- 15.5.3. Topical
- 15.5.4. Rectal
- 15.5.5. Ocular
- 15.6. Market Value Forecast, by Country/Sub-region, 2017-2031
- 15.6.1. GCC Country
- 15.6.2. South Africa
- 15.6.3. Rest of Middle East & Africa
- 15.7. Market Attractiveness Analysis
- 15.7.1. By Product
- 15.7.2. By Animal Type
- 15.7.3. By Dosage Form
- 15.7.4. By Route of Administration
- 15.7.5. By Country/Sub-region
16. Competition Landscape
- 16.1. Market Player - Competition Matrix (by tier and size of companies)
- 16.2. Market Share Analysis, by Company, 2021
- 16.3. Company Profiles
- 16.3.1. Wedgewood Pharmacy
- 16.3.1.1. Company Overview (HQ, Business Segments, Employee Strength)
- 16.3.1.2. Company Financials
- 16.3.1.3. Growth Strategies
- 16.3.1.4. SWOT Analysis
- 16.3.2. Triangle Compounding Pharmacy
- 16.3.2.1. Company Overview (HQ, Business Segments, Employee Strength)
- 16.3.2.2. Company Financials
- 16.3.2.3. Growth Strategies
- 16.3.2.4. SWOT Analysis
- 16.3.3. Davis Islands Pharmacy
- 16.3.3.1. Company Overview (HQ, Business Segments, Employee Strength)
- 16.3.3.2. Company Financials
- 16.3.3.3. Growth Strategies
- 16.3.3.4. SWOT Analysis
- 16.3.4. Custom Med Compounding Pharmacy
- 16.3.4.1. Company Overview (HQ, Business Segments, Employee Strength)
- 16.3.4.2. Company Financials
- 16.3.4.3. Growth Strategies
- 16.3.4.4. SWOT Analysis
- 16.3.5. Central Compounding Center South
- 16.3.5.1. Company Overview (HQ, Business Segments, Employee Strength)
- 16.3.5.2. Company Financials
- 16.3.5.3. Growth Strategies
- 16.3.5.4. SWOT Analysis
- 16.3.6. Wellness Pharmacy of Cary
- 16.3.6.1. Company Overview (HQ, Business Segments, Employee Strength)
- 16.3.6.2. Company Financials
- 16.3.6.3. Growth Strategies
- 16.3.6.4. SWOT Analysis
- 16.3.7. Caringbah Compounding Pharmacy
- 16.3.7.1. Company Overview (HQ, Business Segments, Employee Strength)
- 16.3.7.2. Company Financials
- 16.3.7.3. Growth Strategies
- 16.3.7.4. SWOT Analysis
- 16.3.8. Millers Pharmacy
- 16.3.8.1. Company Overview (HQ, Business Segments, Employee Strength)
- 16.3.8.2. Company Financials
- 16.3.8.3. Growth Strategies
- 16.3.8.4. SWOT Analysis
- 16.3.9. Smith's Pharmacy
- 16.3.9.1. Company Overview (HQ, Business Segments, Employee Strength)
- 16.3.9.2. Company Financials
- 16.3.9.3. Growth Strategies
- 16.3.9.4. SWOT Analysis
- 16.3.10. Specialist Compounding Pharmacy Pte Ltd.
- 16.3.10.1. Company Overview (HQ, Business Segments, Employee Strength)
- 16.3.10.2. Company Financials
- 16.3.10.3. Growth Strategies
- 16.3.10.4. SWOT Analysis
- 16.3.11. Tache Pharmacy
- 16.3.11.1. Company Overview (HQ, Business Segments, Employee Strength)
- 16.3.11.2. Company Financials
- 16.3.11.3. Growth Strategies
- 16.3.11.4. SWOT Analysis
- 16.3.1. Wedgewood Pharmacy