|
|
市場調査レポート
商品コード
1349363
再生可能エネルギー市場:世界の産業分析、規模、シェア、成長、動向、予測、2023~2031年Renewable Energy Market (Type: Solar Energy, Wind Energy, Hydroelectric Energy, Ocean Energy, Geothermal Energy, Biomass Energy, and Others) - Global Industry Analysis, Size, Share, Growth, Trends, and Forecast, 2023-2031 |
||||||
|
|
|||||||
カスタマイズ可能
|
|||||||


| 再生可能エネルギー市場:世界の産業分析、規模、シェア、成長、動向、予測、2023~2031年 |
|
出版日: 2023年07月03日
発行: Transparency Market Research
ページ情報: 英文 435 Pages
納期: 2~10営業日
|

- 全表示
- 概要
- 図表
- 目次
再生可能エネルギー市場- レポートの範囲
世界の再生可能エネルギー市場に関するTMRのレポートは、過去と現在の成長動向、および2023年から2031年の予測期間中に市場の指標の貴重な洞察を得る機会を研究しています。このレポートは、2023年を基準年、2031年を予測年とし、2017年から2031年までの世界市場の収益を提供します。また、2023年から2031年までの世界市場の複合年間成長率(CAGR %)も提供します。
このレポートは広範な調査を経て作成されました。1次調査では、調査活動の大部分が行われ、アナリストが主要なオピニオンリーダー、業界リーダー、オピニオンメーカーにインタビューを実施しました。2次調査には、再生可能エネルギー市場を理解するために、主要企業の製品文献、年次報告書、プレスリリース、および関連文書の参照が含まれます。
| 市場スナップショット | |
|---|---|
| 2023年の市場価値 | 143億米ドル |
| 2031年の市場価値 | 301億米ドル |
| CAGR | 8.6% |
このレポートは、世界の再生可能エネルギー市場の競合情勢を詳しく掘り下げています。世界の再生可能エネルギー市場で活動する主要企業が特定され、それぞれの企業がさまざまな属性の観点からプロファイルされています。会社概要、財務状況、最近の動向、 SWOTは、このレポートで紹介されている世界の再生可能エネルギー市場のプレーヤーの属性です。
目次
第1章 エグゼクティブサマリー
第2章 市場概要
- 市場セグメンテーション
- 主な発展
- 市場の定義
- 主要な市場動向
- 市場力学
- 世界市場の分析と予測、2023~2031年
- ポーターのファイブフォース分析
- 規制状況
- バリューチェーン分析
- 製品仕様の分析
- 生産概要
- コスト構造分析
- COVID-19後の経済回復
第3章 現在の地政学的シナリオが市場に与える影響
第4章 生産高分析(GW)
- 北米
- 欧州
- アジア太平洋地域
- ラテンアメリカ
- 中東・アフリカ
第5章 価格動向分析と予測、2023~2031年
- タイプ別の価格比較分析
- 地域別の価格比較分析
第6章 世界市場の分析と予測:タイプ別、2023-2031年
- イントロダクションと定義
- 世界の市場規模(金額と数量)予測:タイプ別、2023-2031
- 太陽光エネルギー
- アクティブエネルギー
- パッシブエネルギー
- 風力エネルギー
- オフショア
- 陸上
- 水力エネルギー
- 海洋エネルギー
- 地熱エネルギー
- バイオマスエネルギー
- 生物廃棄物
- バイオ燃料
- 木材
- その他(藻類燃料)
- 太陽光エネルギー
- 世界市場の魅力:タイプ別
第7章 世界市場の分析と予測:コネクティビティ別、2023~2031年
- イントロダクションと定義
- 世界市場規模(GW)と価値予測:接続性別、2023-2031
- オングリッド
- オフグリッド
- 世界市場の魅力:コネクティビティ別
第8章 世界市場の分析と予測:用途別、2023~2031年
- イントロダクションと定義
- 世界市場規模(金額と数量)予測:用途別、2023~2031年
- 加熱と冷却
- 発電
- その他
- 世界市場の魅力:用途別
第9章 世界市場の分析と予測:最終用途別、2023~2031年
- イントロダクションと定義
- 世界の市場規模(金額と数量)予測:最終用途別、2023-2031
- 住宅
- 商業
- 産業
- その他
- 世界市場の魅力:最終用途別
第10章 世界市場分析と予測:地域別、2023-2031年
- 主な調査結果
- 世界市場規模(金額と数量)予測:地域別、2023~2031年
- 北米
- 欧州
- アジア太平洋地域
- ラテンアメリカ
- 中東・アフリカ
- 世界市場の魅力:地域別
第11章 北米市場の分析と予測、2023~2031年
第12章 欧州市場の分析と予測、2023~2031年
第13章 アジア太平洋市場の分析と予測、2023~2031年
第14章 ラテンアメリカ市場の分析と予測、2023~2031年
第15章 中東およびアフリカ市場の分析と予測、2023~2031年
第16章 競合情勢
- 市場参入企業-競合マトリックス(企業の階層および規模別)
- 市場シェア分析、2022年
- 市場フットプリント分析
- 企業プロファイル
- ABB
- Xcel Energy Inc.
- EDF
- National Grid Renewables
- Acciona
- Enel Spa
- Innergex
- Tata Power Company Limited
- General Electric
- Invenergy
第17章 1次調査:主要な洞察
第18章 付録
List of Tables
- Table 1: Global Renewable Energy Market Volume (GW) Forecast, by Type, 2023-2031
- Table 2: Global Renewable Energy Market Value (US$ Bn) Forecast, by Type, 2023-2031
- Table 3: Global Renewable Energy Market Volume (GW) Forecast, by Connectivity, 2023-2031
- Table 4: Global Renewable Energy Market Value (US$ Bn) Forecast, by Connectivity, 2023-2031
- Table 5: Global Renewable Energy Market Volume (GW) Forecast, by Application, 2023-2031
- Table 6: Global Renewable Energy Market Value (US$ Bn) Forecast, by Application, 2023-2031
- Table 7: Global Renewable Energy Market Volume (GW) Forecast, by End-use, 2023-2031
- Table 8: Global Renewable Energy Market Value (US$ Bn) Forecast, by End-use, 2023-2031
- Table 9: Global Renewable Energy Market Volume (GW) Forecast, by Region, 2023-2031
- Table 10: Global Renewable Energy Market Value (US$ Bn) Forecast, by Region, 2023-2031
- Table 11: North America Renewable Energy Market Volume (GW) Forecast, by Type, 2023-2031
- Table 12: North America Renewable Energy Market Value (US$ Bn) Forecast, by Type, 2023-2031
- Table 13: North America Renewable Energy Market Volume (GW) Forecast, by Connectivity, 2023-2031
- Table 14: North America Renewable Energy Market Value (US$ Bn) Forecast, by Connectivity, 2023-2031
- Table 15: North America Renewable Energy Market Volume (GW) Forecast, by Application, 2023-2031
- Table 16: North America Renewable Energy Market Value (US$ Bn) Forecast, by Application, 2023-2031
- Table 17: North America Renewable Energy Market Volume (GW) Forecast, by End-use, 2023-2031
- Table 18: North America Renewable Energy Market Value (US$ Bn) Forecast, by End-use, 2023-2031
- Table 19: North America Renewable Energy Market Volume (GW) Forecast, by Country, 2023-2031
- Table 20: North America Renewable Energy Market Value (US$ Bn) Forecast, by Country, 2023-2031
- Table 21: U.S. Renewable Energy Market Volume (GW) Forecast, by Type, 2023-2031
- Table 22: U.S. Renewable Energy Market Value (US$ Bn) Forecast, by Type, 2023-2031
- Table 23: U.S. Renewable Energy Market Volume (GW) Forecast, by Connectivity, 2023-2031
- Table 24: U.S. Renewable Energy Market Value (US$ Bn) Forecast, by Connectivity, 2023-2031
- Table 25: U.S. Renewable Energy Market Volume (GW) Forecast, by Application, 2023-2031
- Table 26: U.S. Renewable Energy Market Value (US$ Bn) Forecast, by Application, 2023-2031
- Table 27: U.S. Renewable Energy Market Volume (GW) Forecast, by End-use, 2023-2031
- Table 28: U.S. Renewable Energy Market Value (US$ Bn) Forecast, by End-use, 2023-2031
- Table 29: Canada Renewable Energy Market Volume (GW) Forecast, by Type, 2023-2031
- Table 30: Canada Renewable Energy Market Value (US$ Bn) Forecast, by Type, 2023-2031
- Table 31: Canada Renewable Energy Market Volume (GW) Forecast, by Connectivity, 2023-2031
- Table 32: Canada Renewable Energy Market Value (US$ Bn) Forecast, by Connectivity, 2023-2031
- Table 33: Canada Renewable Energy Market Volume (GW) Forecast, by Application, 2023-2031
- Table 34: Canada Renewable Energy Market Value (US$ Bn) Forecast, by Application, 2023-2031
- Table 35: Canada Renewable Energy Market Volume (GW) Forecast, by End-use, 2023-2031
- Table 36: Canada Renewable Energy Market Value (US$ Bn) Forecast, by End-use 2023-2031
- Table 37: Europe Renewable Energy Market Volume (GW) Forecast, by Type, 2023-2031
- Table 38: Europe Renewable Energy Market Value (US$ Bn) Forecast, by Type, 2023-2031
- Table 39: Europe Renewable Energy Market Volume (GW) Forecast, by Connectivity, 2023-2031
- Table 40: Europe Renewable Energy Market Value (US$ Bn) Forecast, by Connectivity, 2023-2031
- Table 41: Europe Renewable Energy Market Volume (GW) Forecast, by Application, 2023-2031
- Table 42: Europe Renewable Energy Market Value (US$ Bn) Forecast, by Application, 2023-2031
- Table 43: Europe Renewable Energy Market Volume (GW) Forecast, by End-use, 2023-2031
- Table 44: Europe Renewable Energy Market Value (US$ Bn) Forecast, by End-use 2023-2031
- Table 45: Europe Renewable Energy Market Volume (GW) Forecast, by Country and Sub-region, 2023-2031
- Table 46: Europe Renewable Energy Market Value (US$ Bn) Forecast, by Country and Sub-region, 2023-2031
- Table 47: Germany Renewable Energy Market Volume (GW) Forecast, by Type, 2023-2031
- Table 48: Germany Renewable Energy Market Value (US$ Bn) Forecast, by Type, 2023-2031
- Table 49: Germany Renewable Energy Market Volume (GW) Forecast, by Connectivity, 2023-2031
- Table 50: Germany Renewable Energy Market Value (US$ Bn) Forecast, by Connectivity, 2023-2031
- Table 51: Germany Renewable Energy Market Volume (GW) Forecast, by Application, 2023-2031
- Table 52: Germany Renewable Energy Market Value (US$ Bn) Forecast, by Application, 2023-2031
- Table 53: Germany Renewable Energy Market Volume (GW) Forecast, by End-use, 2023-2031
- Table 54: Germany Renewable Energy Market Value (US$ Bn) Forecast, by End-use 2023-2031
- Table 55: France Renewable Energy Market Volume (GW) Forecast, by Type, 2023-2031
- Table 56: France Renewable Energy Market Value (US$ Bn) Forecast, by Type, 2023-2031
- Table 57: France Renewable Energy Market Volume (GW) Forecast, by Connectivity, 2023-2031
- Table 58: France Renewable Energy Market Value (US$ Bn) Forecast, by Connectivity, 2023-2031
- Table 59: France Renewable Energy Market Volume (GW) Forecast, by Application, 2023-2031
- Table 60: France Renewable Energy Market Value (US$ Bn) Forecast, by Application, 2023-2031
- Table 61: France Renewable Energy Market Volume (GW) Forecast, by End-use, 2023-2031
- Table 62: France Renewable Energy Market Value (US$ Bn) Forecast, by End-use 2023-2031
- Table 63: U.K. Renewable Energy Market Volume (GW) Forecast, by Type, 2023-2031
- Table 64: U.K. Renewable Energy Market Value (US$ Bn) Forecast, by Type, 2023-2031
- Table 65: U.K. Renewable Energy Market Volume (GW) Forecast, by Connectivity, 2023-2031
- Table 66: U.K. Renewable Energy Market Value (US$ Bn) Forecast, by Connectivity, 2023-2031
- Table 67: U.K. Renewable Energy Market Volume (GW) Forecast, by Application, 2023-2031
- Table 68: U.K. Renewable Energy Market Value (US$ Bn) Forecast, by Application, 2023-2031
- Table 69: U.K. Renewable Energy Market Volume (GW) Forecast, by End-use, 2023-2031
- Table 70: U.K. Renewable Energy Market Value (US$ Bn) Forecast, by End-use 2023-2031
- Table 71: Italy Renewable Energy Market Volume (GW) Forecast, by Type, 2023-2031
- Table 72: Italy Renewable Energy Market Value (US$ Bn) Forecast, by Type, 2023-2031
- Table 73: Italy Renewable Energy Market Volume (GW) Forecast, by Connectivity, 2023-2031
- Table 74: Italy Renewable Energy Market Value (US$ Bn) Forecast, by Connectivity, 2023-2031
- Table 75: Italy Renewable Energy Market Volume (GW) Forecast, by Application, 2023-2031
- Table 76: Italy Renewable Energy Market Value (US$ Bn) Forecast, by Application, 2023-2031
- Table 77: Italy Renewable Energy Market Volume (GW) Forecast, by End-use, 2023-2031
- Table 78: Italy Renewable Energy Market Value (US$ Bn) Forecast, by End-use 2023-2031
- Table 79: Spain Renewable Energy Market Volume (GW) Forecast, by Type, 2023-2031
- Table 80: Spain Renewable Energy Market Value (US$ Bn) Forecast, by Type, 2023-2031
- Table 81: Spain Renewable Energy Market Volume (GW) Forecast, by Connectivity, 2023-2031
- Table 82: Spain Renewable Energy Market Value (US$ Bn) Forecast, by Connectivity, 2023-2031
- Table 83: Spain Renewable Energy Market Volume (GW) Forecast, by Application, 2023-2031
- Table 84: Spain Renewable Energy Market Value (US$ Bn) Forecast, by Application, 2023-2031
- Table 85: Spain Renewable Energy Market Volume (GW) Forecast, by End-use, 2023-2031
- Table 86: Spain Renewable Energy Market Value (US$ Bn) Forecast, by End-use 2023-2031
- Table 87: Russia & CIS Renewable Energy Market Volume (GW) Forecast, by Type, 2023-2031
- Table 88: Russia & CIS Renewable Energy Market Value (US$ Bn) Forecast, by Type, 2023-2031
- Table 89: Russia & CIS Renewable Energy Market Volume (GW) Forecast, by Connectivity, 2023-2031
- Table 90: Russia & CIS Renewable Energy Market Value (US$ Bn) Forecast, by Connectivity, 2023-2031
- Table 91: Russia & CIS Renewable Energy Market Volume (GW) Forecast, by Application, 2023-2031
- Table 92: Russia & CIS Renewable Energy Market Value (US$ Bn) Forecast, by Application, 2023-2031
- Table 93: Russia & CIS Renewable Energy Market Volume (GW) Forecast, by End-use, 2023-2031
- Table 94: Russia & CIS Renewable Energy Market Value (US$ Bn) Forecast, by End-use 2023-2031
- Table 95: Rest of Europe Renewable Energy Market Volume (GW) Forecast, by Type, 2023-2031
- Table 96: Rest of Europe Renewable Energy Market Value (US$ Bn) Forecast, by Type, 2023-2031
- Table 97: Rest of Europe Renewable Energy Market Volume (GW) Forecast, by Connectivity, 2023-2031
- Table 98: Rest of Europe Renewable Energy Market Value (US$ Bn) Forecast, by Connectivity, 2023-2031
- Table 99: Rest of Europe Renewable Energy Market Volume (GW) Forecast, by Application, 2023-2031
- Table 100: Rest of Europe Renewable Energy Market Value (US$ Bn) Forecast, by Application, 2023-2031
- Table 101: Rest of Europe Renewable Energy Market Volume (GW) Forecast, by End-use, 2023-2031
- Table 102: Rest of Europe Renewable Energy Market Value (US$ Bn) Forecast, by End-use 2023-2031
- Table 103: Asia Pacific Renewable Energy Market Volume (GW) Forecast, by Type, 2023-2031
- Table 104: Asia Pacific Renewable Energy Market Value (US$ Bn) Forecast, by Type, 2023-2031
- Table 105: Asia Pacific Renewable Energy Market Volume (GW) Forecast, by Connectivity, 2023-2031
- Table 106: Asia Pacific Renewable Energy Market Value (US$ Bn) Forecast, by Connectivity, 2023-2031
- Table 107: Asia Pacific Renewable Energy Market Volume (GW) Forecast, by Application, 2023-2031
- Table 108: Asia Pacific Renewable Energy Market Value (US$ Bn) Forecast, by Application, 2023-2031
- Table 109: Asia Pacific Renewable Energy Market Volume (GW) Forecast, by End-use, 2023-2031
- Table 110: Asia Pacific Renewable Energy Market Value (US$ Bn) Forecast, by End-use 2023-2031
- Table 111: Asia Pacific Renewable Energy Market Volume (GW) Forecast, by Country and Sub-region, 2023-2031
- Table 112: Asia Pacific Renewable Energy Market Value (US$ Bn) Forecast, by Country and Sub-region, 2023-2031
- Table 113: China Renewable Energy Market Volume (GW) Forecast, by Type, 2023-2031
- Table 114: China Renewable Energy Market Value (US$ Bn) Forecast, by Type 2023-2031
- Table 115: China Renewable Energy Market Volume (GW) Forecast, by Connectivity, 2023-2031
- Table 116: China Renewable Energy Market Value (US$ Bn) Forecast, by Connectivity, 2023-2031
- Table 117: China Renewable Energy Market Volume (GW) Forecast, by Application, 2023-2031
- Table 118: China Renewable Energy Market Value (US$ Bn) Forecast, by Application, 2023-2031
- Table 119: China Renewable Energy Market Volume (GW) Forecast, by End-use, 2023-2031
- Table 120: China Renewable Energy Market Value (US$ Bn) Forecast, by End-use 2023-2031
- Table 121: Japan Renewable Energy Market Volume (GW) Forecast, by Type, 2023-2031
- Table 122: Japan Renewable Energy Market Value (US$ Bn) Forecast, by Type, 2023-2031
- Table 123: Japan Renewable Energy Market Volume (GW) Forecast, by Connectivity, 2023-2031
- Table 124: Japan Renewable Energy Market Value (US$ Bn) Forecast, by Connectivity, 2023-2031
- Table 125: Japan Renewable Energy Market Volume (GW) Forecast, by Application, 2023-2031
- Table 126: Japan Renewable Energy Market Value (US$ Bn) Forecast, by Application, 2023-2031
- Table 127: Japan Renewable Energy Market Volume (GW) Forecast, by End-use, 2023-2031
- Table 128: Japan Renewable Energy Market Value (US$ Bn) Forecast, by End-use 2023-2031
- Table 129: India Renewable Energy Market Volume (GW) Forecast, by Type, 2023-2031
- Table 130: India Renewable Energy Market Value (US$ Bn) Forecast, by Type, 2023-2031
- Table 131: India Renewable Energy Market Volume (GW) Forecast, by Connectivity, 2023-2031
- Table 132: India Renewable Energy Market Value (US$ Bn) Forecast, by Connectivity, 2023-2031
- Table 133: India Renewable Energy Market Volume (GW) Forecast, by Application, 2023-2031
- Table 134: India Renewable Energy Market Value (US$ Bn) Forecast, by Application, 2023-2031
- Table 135: India Renewable Energy Market Volume (GW) Forecast, by End-use, 2023-2031
- Table 136: India Renewable Energy Market Value (US$ Bn) Forecast, by End-use 2023-2031
- Table 137: ASEAN Renewable Energy Market Volume (GW) Forecast, by Type, 2023-2031
- Table 138: ASEAN Renewable Energy Market Value (US$ Bn) Forecast, by Type, 2023-2031
- Table 139: ASEAN Renewable Energy Market Volume (GW) Forecast, by Connectivity, 2023-2031
- Table 140: ASEAN Renewable Energy Market Value (US$ Bn) Forecast, by Connectivity, 2023-2031
- Table 141: ASEAN Renewable Energy Market Volume (GW) Forecast, by Application, 2023-2031
- Table 142: ASEAN Renewable Energy Market Value (US$ Bn) Forecast, by Application, 2023-2031
- Table 143: ASEAN Renewable Energy Market Volume (GW) Forecast, by End-use, 2023-2031
- Table 144: ASEAN Renewable Energy Market Value (US$ Bn) Forecast, by End-use 2023-2031
- Table 145: Rest of Asia Pacific Renewable Energy Market Volume (GW) Forecast, by Type, 2023-2031
- Table 146: Rest of Asia Pacific Renewable Energy Market Value (US$ Bn) Forecast, by Type, 2023-2031
- Table 147: Rest of Asia Pacific Renewable Energy Market Volume (GW) Forecast, by Connectivity, 2023-2031
- Table 148: Rest of Asia Pacific Renewable Energy Market Value (US$ Bn) Forecast, by Connectivity, 2023-2031
- Table 149: Rest of Asia Pacific Renewable Energy Market Volume (GW) Forecast, by Application, 2023-2031
- Table 150: Rest of Asia Pacific Renewable Energy Market Value (US$ Bn) Forecast, by Application, 2023-2031
- Table 151: Rest of Asia Pacific Renewable Energy Market Volume (GW) Forecast, by End-use, 2023-2031
- Table 152: Rest of Asia Pacific Renewable Energy Market Value (US$ Bn) Forecast, by End-use 2023-2031
- Table 153: Latin America Renewable Energy Market Volume (GW) Forecast, by Type, 2023-2031
- Table 154: Latin America Renewable Energy Market Value (US$ Bn) Forecast, by Type, 2023-2031
- Table 155: Latin America Renewable Energy Market Volume (GW) Forecast, by Connectivity, 2023-2031
- Table 156: Latin America Renewable Energy Market Value (US$ Bn) Forecast, by Connectivity, 2023-2031
- Table 157: Latin America Renewable Energy Market Volume (GW) Forecast, by Application, 2023-2031
- Table 158: Latin America Renewable Energy Market Value (US$ Bn) Forecast, by Application, 2023-2031
- Table 159: Latin America Renewable Energy Market Volume (GW) Forecast, by End-use, 2023-2031
- Table 160: Latin America Renewable Energy Market Value (US$ Bn) Forecast, by End-use 2023-2031
- Table 161: Latin America Renewable Energy Market Volume (GW) Forecast, by Country and Sub-region, 2023-2031
- Table 162: Latin America Renewable Energy Market Value (US$ Bn) Forecast, by Country and Sub-region, 2023-2031
- Table 163: Brazil Renewable Energy Market Volume (GW) Forecast, by Type, 2023-2031
- Table 164: Brazil Renewable Energy Market Value (US$ Bn) Forecast, by Type, 2023-2031
- Table 165: Brazil Renewable Energy Market Volume (GW) Forecast, by Connectivity, 2023-2031
- Table 166: Brazil Renewable Energy Market Value (US$ Bn) Forecast, by Connectivity, 2023-2031
- Table 167: Brazil Renewable Energy Market Volume (GW) Forecast, by Application, 2023-2031
- Table 168: Brazil Renewable Energy Market Value (US$ Bn) Forecast, by Application, 2023-2031
- Table 169: Brazil Renewable Energy Market Volume (GW) Forecast, by End-use, 2023-2031
- Table 170: Brazil Renewable Energy Market Value (US$ Bn) Forecast, by End-use 2023-2031
- Table 171: Mexico Renewable Energy Market Volume (GW) Forecast, by Type, 2023-2031
- Table 172: Mexico Renewable Energy Market Value (US$ Bn) Forecast, by Type, 2023-2031
- Table 173: Mexico Renewable Energy Market Volume (GW) Forecast, by Connectivity, 2023-2031
- Table 174: Mexico Renewable Energy Market Value (US$ Bn) Forecast, by Connectivity, 2023-2031
- Table 175: Mexico Renewable Energy Market Volume (GW) Forecast, by Application, 2023-2031
- Table 176: Mexico Renewable Energy Market Value (US$ Bn) Forecast, by Application, 2023-2031
- Table 177: Mexico Renewable Energy Market Volume (GW) Forecast, by End-use, 2023-2031
- Table 178: Mexico Renewable Energy Market Value (US$ Bn) Forecast, by End-use 2023-2031
- Table 179: Rest of Latin America Renewable Energy Market Volume (GW) Forecast, by Type, 2023-2031
- Table 180: Rest of Latin America Renewable Energy Market Value (US$ Bn) Forecast, by Type, 2023-2031
- Table 181: Rest of Latin America Renewable Energy Market Volume (GW) Forecast, by Connectivity, 2023-2031
- Table 182: Rest of Latin America Renewable Energy Market Value (US$ Bn) Forecast, by Connectivity, 2023-2031
- Table 183: Rest of Latin America Renewable Energy Market Volume (GW) Forecast, by Application, 2023-2031
- Table 184: Rest of Latin America Renewable Energy Market Value (US$ Bn) Forecast, by Application, 2023-2031
- Table 185: Rest of Latin America Renewable Energy Market Volume (GW) Forecast, by End-use, 2023-2031
- Table 186: Rest of Latin America Renewable Energy Market Value (US$ Bn) Forecast, by End-use 2023-2031
- Table 187: Middle East & Africa Renewable Energy Market Volume (GW) Forecast, by Type, 2023-2031
- Table 188: Middle East & Africa Renewable Energy Market Value (US$ Bn) Forecast, by Type, 2023-2031
- Table 189: Middle East & Africa Renewable Energy Market Volume (GW) Forecast, by Connectivity, 2023-2031
- Table 190: Middle East & Africa Renewable Energy Market Value (US$ Bn) Forecast, by Connectivity, 2023-2031
- Table 191: Middle East & Africa Renewable Energy Market Volume (GW) Forecast, by Application, 2023-2031
- Table 192: Middle East & Africa Renewable Energy Market Value (US$ Bn) Forecast, by Application, 2023-2031
- Table 193: Middle East & Africa Renewable Energy Market Volume (GW) Forecast, by End-use, 2023-2031
- Table 194: Middle East & Africa Renewable Energy Market Value (US$ Bn) Forecast, by End-use 2023-2031
- Table 195: Middle East & Africa Renewable Energy Market Volume (GW) Forecast, by Country and Sub-region, 2023-2031
- Table 196: Middle East & Africa Renewable Energy Market Value (US$ Bn) Forecast, by Country and Sub-region, 2023-2031
- Table 197: GCC Renewable Energy Market Volume (GW) Forecast, by Type, 2023-2031
- Table 198: GCC Renewable Energy Market Value (US$ Bn) Forecast, by Type, 2023-2031
- Table 199: GCC Renewable Energy Market Volume (GW) Forecast, by Connectivity, 2023-2031
- Table 200: GCC Renewable Energy Market Value (US$ Bn) Forecast, by Connectivity, 2023-2031
- Table 201: GCC Renewable Energy Market Volume (GW) Forecast, by Application, 2023-2031
- Table 202: GCC Renewable Energy Market Value (US$ Bn) Forecast, by Application, 2023-2031
- Table 203: GCC Renewable Energy Market Volume (GW) Forecast, by End-use, 2023-2031
- Table 204: GCC Renewable Energy Market Value (US$ Bn) Forecast, by End-use 2023-2031
- Table 205: South Africa Renewable Energy Market Volume (GW) Forecast, by Type, 2023-2031
- Table 206: South Africa Renewable Energy Market Value (US$ Bn) Forecast, by Type, 2023-2031
- Table 207: South Africa Renewable Energy Market Volume (GW) Forecast, by Connectivity, 2023-2031
- Table 208: South Africa Renewable Energy Market Value (US$ Bn) Forecast, by Connectivity, 2023-2031
- Table 209: South Africa Renewable Energy Market Volume (GW) Forecast, by Application, 2023-2031
- Table 210: South Africa Renewable Energy Market Value (US$ Bn) Forecast, by Application, 2023-2031
- Table 211: South Africa Renewable Energy Market Volume (GW) Forecast, by End-use, 2023-2031
- Table 212: South Africa Renewable Energy Market Value (US$ Bn) Forecast, by End-use 2023-2031
- Table 213: Rest of Middle East & Africa Renewable Energy Market Volume (GW) Forecast, by Type, 2023-2031
- Table 214: Rest of Middle East & Africa Renewable Energy Market Value (US$ Bn) Forecast, by Type, 2023-2031
- Table 215: Rest of Middle East & Africa Renewable Energy Market Volume (GW) Forecast, by Connectivity, 2023-2031
- Table 216: Rest of Middle East & Africa Renewable Energy Market Value (US$ Bn) Forecast, by Connectivity, 2023-2031
- Table 217: Rest of Middle East & Africa Renewable Energy Market Volume (GW) Forecast, by Application, 2023-2031
- Table 218: Rest of Middle East & Africa Renewable Energy Market Value (US$ Bn) Forecast, by Application, 2023-2031
- Table 219: Rest of Middle East & Africa Renewable Energy Market Volume (GW) Forecast, by End-use, 2023-2031
- Table 220: Rest of Middle East & Africa Renewable Energy Market Value (US$ Bn) Forecast, by End-use 2023-2031
List of Figures
- Figure 1: Global Renewable Energy Market Volume Share Analysis, by Type, 2022, 2027, and 2031
- Figure 2: Global Renewable Energy Market Attractiveness, by Type
- Figure 3: Global Renewable Energy Market Volume Share Analysis, by Connectivity, 2022, 2027, and 2031
- Figure 4: Global Renewable Energy Market Attractiveness, by Connectivity
- Figure 5: Global Renewable Energy Market Volume Share Analysis, by Application, 2022, 2027, and 2031
- Figure 6: Global Renewable Energy Market Attractiveness, by Application
- Figure 7: Global Renewable Energy Market Volume Share Analysis, by End-use, 2022, 2027, and 2031
- Figure 8: Global Renewable Energy Market Attractiveness, by End-use
- Figure 9: Global Renewable Energy Market Volume Share Analysis, by Region, 2022, 2027, and 2031
- Figure 10: Global Renewable Energy Market Attractiveness, by Region
- Figure 11: North America Renewable Energy Market Volume Share Analysis, by Type, 2022, 2027, and 2031
- Figure 12: North America Renewable Energy Market Attractiveness, by Type
- Figure 13: North America Renewable Energy Market Attractiveness, by Type
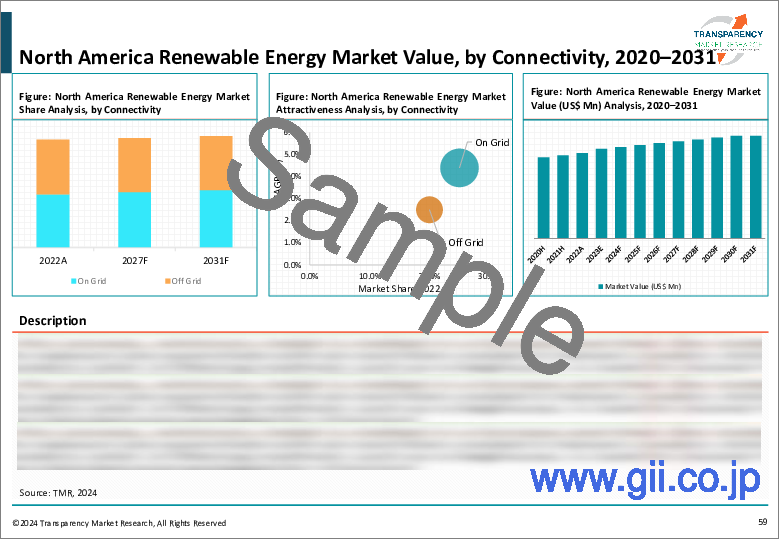
- Figure 14: North America Renewable Energy Market Volume Share Analysis, by Connectivity, 2022, 2027, and 2031
- Figure 15: North America Renewable Energy Market Attractiveness, by Connectivity
- Figure 16: North America Renewable Energy Market Volume Share Analysis, by Application, 2022, 2027, and 2031
- Figure 17: North America Renewable Energy Market Attractiveness, by Application
- Figure 18: North America Renewable Energy Market Volume Share Analysis, by End-use, 2022, 2027, and 2031
- Figure 19: North America Renewable Energy Market Attractiveness, by End-use
- Figure 20: North America Renewable Energy Market Attractiveness, by Country and Sub-region
- Figure 21: Europe Renewable Energy Market Volume Share Analysis, by Type, 2022, 2027, and 2031
- Figure 22: Europe Renewable Energy Market Attractiveness, by Type
- Figure 23: Europe Renewable Energy Market Volume Share Analysis, by Connectivity, 2022, 2027, and 2031
- Figure 24: Europe Renewable Energy Market Attractiveness, by Connectivity
- Figure 25: Europe Renewable Energy Market Volume Share Analysis, by Application, 2022, 2027, and 2031
- Figure 26: Europe Renewable Energy Market Attractiveness, by Application
- Figure 27: Europe Renewable Energy Market Volume Share Analysis, by End-use, 2022, 2027, and 2031
- Figure 28: Europe Renewable Energy Market Attractiveness, by End-use
- Figure 29: Europe Renewable Energy Market Volume Share Analysis, by Country and Sub-region, 2022, 2027, and 2031
- Figure 30: Europe Renewable Energy Market Attractiveness, by Country and Sub-region
- Figure 31: Asia Pacific Renewable Energy Market Volume Share Analysis, by Type, 2022, 2027, and 2031
- Figure 32: Asia Pacific Renewable Energy Market Attractiveness, by Type
- Figure 33: Asia Pacific Renewable Energy Market Volume Share Analysis, by Connectivity, 2022, 2027, and 2031
- Figure 34: Asia Pacific Renewable Energy Market Attractiveness, by Connectivity
- Figure 35: Asia Pacific Renewable Energy Market Volume Share Analysis, by Application, 2022, 2027, and 2031
- Figure 36: Asia Pacific Renewable Energy Market Attractiveness, by Application
- Figure 33: Asia Pacific Renewable Energy Market Volume Share Analysis, by End-use, 2022, 2027, and 2031
- Figure 34: Asia Pacific Renewable Energy Market Attractiveness, by End-use
- Figure 35: Asia Pacific Renewable Energy Market Volume Share Analysis, by Country and Sub-region, 2022, 2027, and 2031
- Figure 36: Asia Pacific Renewable Energy Market Attractiveness, by Country and Sub-region
- Figure 33: Latin America Renewable Energy Market Volume Share Analysis, by Type, 2022, 2027, and 2031
- Figure 34: Latin America Renewable Energy Market Attractiveness, by Type
- Figure 35: Latin America Renewable Energy Market Volume Share Analysis, by Connectivity, 2022, 2027, and 2031
- Figure 36: Latin America Renewable Energy Market Attractiveness, by Connectivity
- Figure 33: Latin America Renewable Energy Market Volume Share Analysis, by Application, 2022, 2027, and 2031
- Figure 34: Latin America Renewable Energy Market Attractiveness, by Application
- Figure 35: Latin America Renewable Energy Market Volume Share Analysis, by End-use, 2022, 2027, and 2031
- Figure 36: Latin America Renewable Energy Market Attractiveness, by End-use
- Figure 36: Latin America Renewable Energy Market Volume Share Analysis, by Country and Sub-region, 2022, 2027, and 2031
- Figure 37: Latin America Renewable Energy Market Attractiveness, by Country and Sub-region
- Figure 38: Middle East & Africa Renewable Energy Market Volume Share Analysis, by Type, 2022, 2027, and 2031
- Figure 39: Middle East & Africa Renewable Energy Market Attractiveness, by Type
- Figure 40: Middle East & Africa Renewable Energy Market Volume Share Analysis, by Connectivity, 2022, 2027, and 2031
- Figure 41: Middle East & Africa Renewable Energy Market Attractiveness, by Connectivity
- Figure 42: Middle East & Africa Renewable Energy Market Volume Share Analysis, by Application, 2022, 2027, and 2031
- Figure 43: Middle East & Africa Renewable Energy Market Attractiveness, by Application
- Figure 44: Middle East & Africa Renewable Energy Market Volume Share Analysis, by End-use, 2022, 2027, and 2031
- Figure 45: Middle East & Africa Renewable Energy Market Attractiveness, by End-use
- Figure 46: Middle East & Africa Renewable Energy Market Volume Share Analysis, by Country and Sub-region, 2022, 2027, and 2031
- Figure 47: Middle East & Africa Renewable Energy Market Attractiveness, by Country and Sub-region
Renewable Energy Market - Scope of Report
TMR's report on the global renewable energy market studies the past as well as the current growth trends and opportunities to gain valuable insights of the indicators of the market during the forecast period from 2023 to 2031. The report provides revenue of the global renewable energy market for the period 2017-2031, considering 2023 as the base year and 2031 as the forecast year. The report also provides the compound annual growth rate (CAGR %) of the global renewable energy market from 2023 to 2031.
The report has been prepared after an extensive research. Primary research involved bulk of the research efforts, wherein analysts carried out interviews with key opinion leaders, industry leaders, and opinion makers. Secondary research involved referring to key players' product literature, annual reports, press releases, and relevant documents to understand the renewable energy market.
| Market Snapshot | |
|---|---|
| Market Value in 2023 | US$ 14.3 Bn |
| Market Value in 2031 | US$ 30.1 Bn |
| CAGR | 8.6% |
Secondary research also included Internet sources, statistical data from government agencies, websites, and trade associations. Analysts employed a combination of top-down and bottom-up approaches to study various attributes of the global renewable energy market.
The report includes an elaborate executive summary, along with a snapshot of the growth behavior of various segments included in the scope of the study. Moreover, the report throws light on the changing competitive dynamics in the global renewable energy market. These serve as valuable tools for existing market players as well as for entities interested in participating in the global renewable energy market.
The report delves into the competitive landscape of the global renewable energy market. Key players operating in the global renewable energy market have been identified and each one of these has been profiled in terms of various attributes. Company overview, financial standings, recent developments, and SWOT are the attributes of players in the global renewable energy market profiled in this report.
Key Questions Answered in Global Renewable Energy Market Report:
- What is the sales/revenue generated by renewable energy across all regions during the forecast period?
- What are the opportunities in the global renewable energy market?
- What are the major drivers, restraints, opportunities, and threats in the market?
- Which regional market is set to expand at the fastest CAGR during the forecast period?
- Which segment is expected to generate the highest revenue globally in 2031?
- Which segment is projected to expand at the highest CAGR during the forecast period?
- What are the market positions of different companies operating in the global market?
Renewable Energy Market - Research Objectives and Research Approach
The comprehensive report on the global renewable energy market begins with an overview, followed by the scope and objectives of the study. The report provides detailed explanation of the objectives behind this study and key vendors and distributors operating in the market and regulatory scenario for approval of products.
For reading comprehensibility, the report has been compiled in a chapter-wise layout, with each section divided into smaller ones. The report comprises an exhaustive collection of graphs and tables that are appropriately interspersed. Pictorial representation of actual and projected values of key segments is visually appealing to readers. This also allows comparison of the market shares of key segments in the past and at the end of the forecast period.
The report analyzes the global renewable energy market in terms of product, end-user, and region. Key segments under each criterion have been studied at length, and the market share for each of these at the end of 2031 has been provided. Such valuable insights enable market stakeholders in making informed business decisions for investment in the global renewable energy market.
Table of Contents
1. Executive Summary
- 1.1. Global Market Outlook
- 1.2. Demand Side Trends
- 1.3. Key Facts and Figures
- 1.4. Trends Impacting Market
- 1.5. TMR's Growth Opportunity Wheel
2. Market Overview
- 2.1. Market Segmentation
- 2.2. Key Developments
- 2.3. Market Definitions
- 2.4. Key Market Trends
- 2.5. Market Dynamics
- 2.5.1. Drivers
- 2.5.2. Restraints
- 2.5.3. Opportunities
- 2.6. Global Renewable Energy Market Analysis and Forecasts, 2023-2031
- 2.6.1. Global Renewable Energy Market Volume (GW)
- 2.6.2. Global Renewable Energy Market Revenue (US$ Bn)
- 2.7. Porter's Five Forces Analysis
- 2.8. Regulatory Landscape
- 2.9. Value Chain Analysis
- 2.9.1. List of Equipment Suppliers
- 2.9.2. List of Manufacturers
- 2.9.3. List of EPC Companies
- 2.9.4. List of Dealers/Distributors
- 2.9.5. List of Potential Customers
- 2.10. Product Specification Analysis
- 2.11. Production Overview
- 2.12. Cost Structure Analysis
- 2.13. Economic Recovery Post COVID-19
- 2.13.1. Impact on the Supply Chain of Renewable Energy Market
- 2.13.2. Recovery in the Demand for Renewable Energy-Post Crisis
3. Impact of Current Geopolitical Scenario on Market
4. Production Output Analysis (GW)
- 4.1. North America
- 4.2. Europe
- 4.3. Asia Pacific
- 4.4. Latin America
- 4.5. Middle East & Africa
5. Price Trend Analysis and Forecast (US$/Ton), 2023-2031
- 5.1. Price Comparison Analysis by Type
- 5.2. Price Comparison Analysis by Region
6. Global Renewable Energy Market Analysis and Forecast, by Type, 2023-2031
- 6.1. Introduction and Definitions
- 6.2. Global Renewable Energy Market Volume (GW) and Value (US$ Bn) Forecast, by Type, 2023-2031
- 6.2.1. Solar Energy
- 6.2.1.1. Active Energy
- 6.2.1.2. Passive Energy
- 6.2.2. Wind Energy
- 6.2.2.1. Offshore
- 6.2.2.2. Onshore
- 6.2.3. Hydroelectric Energy
- 6.2.4. Ocean Energy
- 6.2.5. Geothermal Energy
- 6.2.6. Biomass Energy
- 6.2.6.1. Biowaste
- 6.2.6.2. Biofuel
- 6.2.6.3. Wood
- 6.2.7. Others (Algae Fuel)
- 6.2.1. Solar Energy
- 6.3. Global Renewable Energy Market Attractiveness, by Type
7. Global Renewable Energy Market Analysis and Forecast, by Connectivity, 2023-2031
- 7.1. Introduction and Definitions
- 7.2. Global Renewable Energy Market Volume (GW) and Value (US$ Bn) Forecast, by Connectivity, 2023-2031
- 7.2.1. On-grid
- 7.2.2. Off-grid
- 7.3. Global Renewable Energy Market Attractiveness, by Connectivity
8. Global Renewable Energy Market Analysis and Forecast, Application, 2023-2031
- 8.1. Introduction and Definitions
- 8.2. Global Renewable Energy Market Volume (GW) and Value (US$ Bn) Forecast, by Application, 2023-2031
- 8.2.1. Heating and Cooling
- 8.2.2. Electricity generation
- 8.2.3. Others
- 8.3. Global Renewable Energy Market Attractiveness, by Application
9. Global Renewable Energy Market Analysis and Forecast, End-use, 2023-2031
- 9.1. Introduction and Definitions
- 9.2. Global Renewable Energy Market Volume (GW) and Value (US$ Bn) Forecast, by End-use, 2023-2031
- 9.2.1. Residential
- 9.2.2. Commercial
- 9.2.3. Industrial
- 9.2.4. Others
- 9.3. Global Renewable Energy Market Attractiveness, by End-use
10. Global Renewable Energy Market Analysis and Forecast, by Region, 2023-2031
- 10.1. Key Findings
- 10.2. Global Renewable Energy Market Volume (GW) and Value (US$ Bn) Forecast, by Region, 2023-2031
- 10.2.1. North America
- 10.2.2. Europe
- 10.2.3. Asia Pacific
- 10.2.4. Latin America
- 10.2.5. Middle East & Africa
- 10.3. Global Renewable Energy Market Attractiveness, by Region
11. North America Renewable Energy Market Analysis and Forecast, 2023-2031
- 11.1. Key Findings
- 11.2. North America Renewable Energy Market Volume (GW) and Value (US$ Bn) Forecast, by Type, 2023-2031
- 11.3. North America Renewable Energy Market Volume (GW) and Value (US$ Bn) Forecast, by Connectivity, 2023-2031
- 11.4. North America Renewable Energy Market Volume (GW) and Value (US$ Bn) Forecast, by Application, 2023-2031
- 11.5. North America Renewable Energy Market Volume (GW) and Value (US$ Bn) Forecast, by End-use, 2023-2031
- 11.6. North America Renewable Energy Market Volume (GW) and Value (US$ Bn) Forecast, by Country, 2023-2031
- 11.6.1. U.S. Renewable Energy Market Volume (GW) and Value (US$ Bn) Forecast, by Type, 2023-2031
- 11.6.2. U.S. Renewable Energy Market Volume (GW) and Value (US$ Bn) Forecast, by Connectivity, 2023-2031
- 11.6.3. U.S. Renewable Energy Market Volume (GW) and Value (US$ Bn) Forecast, by Application, 2023-2031
- 11.6.4. U.S. Renewable Energy Market Volume (GW) and Value (US$ Bn) Forecast, End-use, 2023-2031
- 11.6.5. Canada Renewable Energy Market Volume (GW) and Value (US$ Bn) Forecast, by Type Connectivity, 2023-2031
- 11.6.6. Canada Renewable Energy Market Volume (GW) and Value (US$ Bn) Forecast, by Connectivity, 2023-2031
- 11.6.7. Canada Renewable Energy Market Volume (GW) and Value (US$ Bn) Forecast, by Application, 2023-2031
- 11.6.8. Canada Renewable Energy Market Volume (GW) and Value (US$ Bn) Forecast, End-use, 2023-2031
- 11.7. North America Renewable Energy Market Attractiveness Analysis
12. Europe Renewable Energy Market Analysis and Forecast, 2023-2031
- 12.1. Key Findings
- 12.2. Europe Renewable Energy Market Volume (GW) and Value (US$ Bn) Forecast, by Type, 2023-2031
- 12.3. Europe Renewable Energy Market Volume (GW) and Value (US$ Bn) Forecast, by Connectivity, 2023-2031
- 12.4. Europe Renewable Energy Market Volume (GW) and Value (US$ Bn) Forecast, by Application, 2023-2031
- 12.5. Europe Renewable Energy Market Volume (GW) and Value (US$ Bn) Forecast, by End-use, 2023-2031
- 12.6. Europe Renewable Energy Market Volume (GW) and Value (US$ Bn) Forecast, by Country and Sub-region, 2023-2031
- 12.6.1. Germany Renewable Energy Market Volume (GW) and Value (US$ Bn) Forecast, by Type, 2023-2031
- 12.6.2. Germany Renewable Energy Market Volume (GW) and Value (US$ Bn) Forecast, by Connectivity, 2023-2031
- 12.6.3. Germany Renewable Energy Market Volume (GW) and Value (US$ Bn) Forecast, by Application, 2023-2031
- 12.6.4. Germany Renewable Energy Market Volume (GW) and Value (US$ Bn) Forecast, End-use, 2023-2031
- 12.6.5. France Renewable Energy Market Volume (GW) and Value (US$ Bn) Forecast, by Type, 2023-2031
- 12.6.6. France Renewable Energy Market Volume (GW) and Value (US$ Bn) Forecast, by Connectivity, 2023-2031
- 12.6.7. France Renewable Energy Market Volume (GW) and Value (US$ Bn) Forecast, by Application, 2023-2031
- 12.6.8. France Renewable Energy Market Volume (GW) and Value (US$ Bn) Forecast, End-use, 2023-2031
- 12.6.9. U.K. Renewable Energy Market Volume (GW) and Value (US$ Bn) Forecast, by Type, 2023-2031
- 12.6.10. U.K. Renewable Energy Market Volume (GW) and Value (US$ Bn) Forecast, by Connectivity, 2023-2031
- 12.6.11. U.K. Renewable Energy Market Volume (GW) and Value (US$ Bn) Forecast, by Application, 2023-2031
- 12.6.12. U.K. Renewable Energy Market Volume (GW) and Value (US$ Bn) Forecast, End-use, 2023-2031
- 12.6.13. Italy Renewable Energy Market Volume (GW) and Value (US$ Bn) Forecast, by Type, 2023-2031
- 12.6.14. Italy. Renewable Energy Market Volume (GW) and Value (US$ Bn) Forecast, by Connectivity, 2023-2031
- 12.6.15. Italy Renewable Energy Market Volume (GW) and Value (US$ Bn) Forecast, by Application, 2023-2031
- 12.6.16. Italy Renewable Energy Market Volume (GW) and Value (US$ Bn) Forecast, End-use, 2023-2031
- 12.6.17. Russia & CIS Renewable Energy Market Volume (GW) and Value (US$ Bn) Forecast, by Type, 2023-2031
- 12.6.18. Russia & CIS Renewable Energy Market Volume (GW) and Value (US$ Bn) Forecast, by Connectivity, 2023-2031
- 12.6.19. Russia & CIS Renewable Energy Market Volume (GW) and Value (US$ Bn) Forecast, by Application, 2023-2031
- 12.6.20. Russia & CIS Renewable Energy Market Volume (GW) and Value (US$ Bn) Forecast, End-use, 2023-2031
- 12.6.21. Rest of Europe Renewable Energy Market Volume (GW) and Value (US$ Bn) Forecast, by Type, 2023-2031
- 12.6.22. Rest of Europe Renewable Energy Market Volume (GW) and Value (US$ Bn) Forecast, by Connectivity, 2023-2031
- 12.6.23. Rest of Europe Renewable Energy Market Volume (GW) and Value (US$ Bn) Forecast, by Application, 2023-2031
- 12.6.24. Rest of Europe Renewable Energy Market Volume (GW) and Value (US$ Bn) Forecast, End-use, 2023-2031
- 12.7. Europe Renewable Energy Market Attractiveness Analysis
13. Asia Pacific Renewable Energy Market Analysis and Forecast, 2023-2031
- 13.1. Key Findings
- 13.2. Asia Pacific Renewable Energy Market Volume (GW) and Value (US$ Bn) Forecast, by Type
- 13.3. Asia Pacific Renewable Energy Market Volume (GW) and Value (US$ Bn) Forecast, by Connectivity, 2023-2031
- 13.4. Asia Pacific Renewable Energy Market Volume (GW) and Value (US$ Bn) Forecast, by Application, 2023-2031
- 13.5. Asia Pacific Renewable Energy Market Volume (GW) and Value (US$ Bn) Forecast, by End-use, 2023-2031
- 13.6. Asia Pacific Renewable Energy Market Volume (GW) and Value (US$ Bn) Forecast, by Country and Sub-region, 2023-2031
- 13.6.1. China Renewable Energy Market Volume (GW) and Value (US$ Bn) Forecast, by Type, 2023-2031
- 13.6.2. China Renewable Energy Market Volume (GW) and Value (US$ Bn) Forecast, by Connectivity, 2023-2031
- 13.6.3. China Renewable Energy Market Volume (GW) and Value (US$ Bn) Forecast, by Application, 2023-2031
- 13.6.4. China Renewable Energy Market Volume (GW) and Value (US$ Bn) Forecast, End-use, 2023-2031
- 13.6.5. Japan Renewable Energy Market Volume (GW) and Value (US$ Bn) Forecast, by Type, 2023-2031
- 13.6.6. Japan Renewable Energy Market Volume (GW) and Value (US$ Bn) Forecast, by Connectivity, 2023-2031
- 13.6.7. Japan Renewable Energy Market Volume (GW) and Value (US$ Bn) Forecast, by Application, 2023-2031
- 13.6.8. Japan Renewable Energy Market Volume (GW) and Value (US$ Bn) Forecast, End-use, 2023-2031
- 13.6.9. India Renewable Energy Market Volume (GW) and Value (US$ Bn) Forecast, by Type, 2023-2031
- 13.6.10. India Renewable Energy Market Volume (GW) and Value (US$ Bn) Forecast, by Connectivity, 2023-2031
- 13.6.11. India Renewable Energy Market Volume (GW) and Value (US$ Bn) Forecast, by Application, 2023-2031
- 13.6.12. India Renewable Energy Market Volume (GW) and Value (US$ Bn) Forecast, End-use, 2023-2031
- 13.6.13. ASEAN Renewable Energy Market Volume (GW) and Value (US$ Bn) Forecast, by Type, 2023-2031
- 13.6.14. ASEAN Renewable Energy Market Volume (GW) and Value (US$ Bn) Forecast, by Connectivity, 2023-2031
- 13.6.15. ASEAN Renewable Energy Market Volume (GW) and Value (US$ Bn) Forecast, by Application, 2023-2031
- 13.6.16. ASEAN Renewable Energy Market Volume (GW) and Value (US$ Bn) Forecast, End-use, 2023-2031
- 13.6.17. Rest of Asia Pacific Renewable Energy Market Volume (GW) and Value (US$ Bn) Forecast, by Type, 2023-2031
- 13.6.18. Rest of Asia Pacific Renewable Energy Market Volume (GW) and Value (US$ Bn) Forecast, by Connectivity, 2023-2031
- 13.6.19. Rest of Asia Pacific Renewable Energy Market Volume (GW) and Value (US$ Bn) Forecast, by Application, 2023-2031
- 13.6.20. Rest of Asia Pacific Renewable Energy Market Volume (GW) and Value (US$ Bn) Forecast, End-use, 2023-2031
- 13.7. Asia Pacific Renewable Energy Market Attractiveness Analysis
14. Latin America Renewable Energy Market Analysis and Forecast, 2023-2031
- 14.1. Key Findings
- 14.2. Latin America Renewable Energy Market Volume (GW) and Value (US$ Bn) Forecast, by Type Connectivity, 2023-2031
- 14.3. Latin America Renewable Energy Market Volume (GW) and Value (US$ Bn) Forecast, by Connectivity, 2023-2031
- 14.4. Latin America Renewable Energy Market Volume (GW) and Value (US$ Bn) Forecast, by Application, 2023-2031
- 14.5. Latin America Renewable Energy Market Volume (GW) and Value (US$ Bn) Forecast, by End-use, 2023-2031
- 14.6. Latin America Renewable Energy Market Volume (GW) and Value (US$ Bn) Forecast, by Country and Sub-region, 2023-2031
- 14.6.1. Brazil Renewable Energy Market Volume (GW) and Value (US$ Bn) Forecast, by Type, 2023-2031
- 14.6.2. Brazil Renewable Energy Market Volume (GW) and Value (US$ Bn) Forecast, by Connectivity, 2023-2031
- 14.6.3. Brazil Renewable Energy Market Volume (GW) and Value (US$ Bn) Forecast, by Application, 2023-2031
- 14.6.4. Brazil Renewable Energy Market Volume (GW) and Value (US$ Bn) Forecast, End-use, 2023-2031
- 14.6.5. Mexico Renewable Energy Market Volume (GW) and Value (US$ Bn) Forecast, by Type, 2023-2031
- 14.6.6. Mexico Renewable Energy Market Volume (GW) and Value (US$ Bn) Forecast, by Connectivity, 2023-2031
- 14.6.7. Mexico Renewable Energy Market Volume (GW) and Value (US$ Bn) Forecast, by Application, 2023-2031
- 14.6.8. Mexico Renewable Energy Market Volume (GW) and Value (US$ Bn) Forecast, End-use, 2023-2031
- 14.6.9. Rest of Latin America Renewable Energy Market Volume (GW) and Value (US$ Bn) Forecast, by Type, 2023-2031
- 14.6.10. Rest of Latin America Renewable Energy Market Volume (GW) and Value (US$ Bn) Forecast, by Connectivity, 2023-2031
- 14.6.11. Rest of Latin America Renewable Energy Market Volume (GW) and Value (US$ Bn) Forecast, by Application, 2023-2031
- 14.6.12. Rest of Latin America Renewable Energy Market Volume (GW) and Value (US$ Bn) Forecast, End-use, 2023-2031
- 14.7. Latin America Renewable Energy Market Attractiveness Analysis
15. Middle East & Africa Renewable Energy Market Analysis and Forecast, 2023-2031
- 15.1. Key Findings
- 15.2. Middle East & Africa Renewable Energy Market Volume (GW) and Value (US$ Bn) Forecast, by Type, 2023-2031
- 15.3. Middle East & Africa Renewable Energy Market Volume (GW) and Value (US$ Bn) Forecast, by Connectivity, 2023-2031
- 15.4. Middle East & Africa Renewable Energy Market Volume (GW) and Value (US$ Bn) Forecast, by Application, 2023-2031
- 15.5. Middle East & Africa Renewable Energy Market Volume (GW) and Value (US$ Bn) Forecast, by End-use, 2023-2031
- 15.6. Middle East & Africa Renewable Energy Market Volume (GW) and Value (US$ Bn) Forecast, by Country and Sub-region, 2023-2031
- 15.6.1. GCC Renewable Energy Market Volume (GW) and Value (US$ Bn) Forecast, by Type, 2023-2031
- 15.6.2. GCC Renewable Energy Market Volume (GW) and Value (US$ Bn) Forecast, by Connectivity, 2023-2031
- 15.6.3. GCC Renewable Energy Market Volume (GW) and Value (US$ Bn) Forecast, by Application, 2023-2031
- 15.6.4. GCC Renewable Energy Market Volume (GW) and Value (US$ Bn) Forecast, End-use, 2023-2031
- 15.6.5. South Africa Renewable Energy Market Volume (GW) and Value (US$ Bn) Forecast, by Type, 2023-2031
- 15.6.6. South Africa Renewable Energy Market Volume (GW) and Value (US$ Bn) Forecast, by Connectivity, 2023-2031
- 15.6.7. South Africa Renewable Energy Market Volume (GW) and Value (US$ Bn) Forecast, by Application, 2023-2031
- 15.6.8. South Africa Renewable Energy Market Volume (GW) and Value (US$ Bn) Forecast, End-use, 2023-2031
- 15.6.9. Rest of Middle East & Africa Renewable Energy Market Volume (GW) and Value (US$ Bn) Forecast, by Type, 2023-2031
- 15.6.10. Rest of Middle East & Africa Renewable Energy Market Volume (GW) and Value (US$ Bn) Forecast, by Connectivity, 2023-2031
- 15.6.11. Rest of Middle East & Africa Renewable Energy Market Volume (GW) and Value (US$ Bn) Forecast, by Application, 2023-2031
- 15.6.12. Rest of Middle East & Africa Renewable Energy Market Volume (GW) and Value (US$ Bn) Forecast, End-use, 2023-2031
- 15.7. Middle East & Africa Renewable Energy Market Attractiveness Analysis
16. Competition Landscape
- 16.1. Market Players - Competition Matrix (by Tier and Size of Companies)
- 16.2. Market Share Analysis, 2022
- 16.3. Market Footprint Analysis
- 16.3.1. By Type
- 16.3.2. By End-use
- 16.4. Company Profiles
- 16.4.1. ABB
- 16.4.1.1. Company Revenue
- 16.4.1.2. Business Overview
- 16.4.1.3. Product Segments
- 16.4.1.4. Geographic Footprint
- 16.4.1.5. Production Connectivity/Plant Details, etc. (*As Applicable)
- 16.4.1.6. Strategic Partnership, Connectivity Expansion, New Product Innovation etc.
- 16.4.2. Xcel Energy Inc.
- 16.4.2.1. Company Revenue
- 16.4.2.2. Business Overview
- 16.4.2.3. Product Segments
- 16.4.2.4. Geographic Footprint
- 16.4.2.5. Production Connectivity/Plant Details, etc. (*As Applicable)
- 16.4.2.6. Strategic Partnership, Connectivity Expansion, New Product Innovation etc.
- 16.4.3. EDF
- 16.4.3.1. Company Revenue
- 16.4.3.2. Business Overview
- 16.4.3.3. Product Segments
- 16.4.3.4. Geographic Footprint
- 16.4.3.5. Production Connectivity/Plant Details, etc. (*As Applicable)
- 16.4.3.6. Strategic Partnership, Connectivity Expansion, New Product Innovation etc.
- 16.4.4. National Grid Renewables
- 16.4.4.1. Company Revenue
- 16.4.4.2. Business Overview
- 16.4.4.3. Product Segments
- 16.4.4.4. Geographic Footprint
- 16.4.4.5. Production Connectivity/Plant Details, etc. (*As Applicable)
- 16.4.4.6. Strategic Partnership, Connectivity Expansion, New Product Innovation etc.
- 16.4.5. Acciona
- 16.4.5.1. Company Revenue
- 16.4.5.2. Business Overview
- 16.4.5.3. Product Segments
- 16.4.5.4. Geographic Footprint
- 16.4.5.5. Production Connectivity/Plant Details, etc. (*As Applicable)
- 16.4.5.6. Strategic Partnership, Connectivity Expansion, New Product Innovation etc.
- 16.4.6. Enel Spa
- 16.4.6.1. Company Revenue
- 16.4.6.2. Business Overview
- 16.4.6.3. Product Segments
- 16.4.6.4. Geographic Footprint
- 16.4.6.5. Production Connectivity/Plant Details, etc. (*As Applicable)
- 16.4.6.6. Strategic Partnership, Connectivity Expansion, New Product Innovation etc.
- 16.4.7. Innergex
- 16.4.7.1. Company Revenue
- 16.4.7.2. Business Overview
- 16.4.7.3. Product Segments
- 16.4.7.4. Geographic Footprint
- 16.4.7.5. Production Connectivity/Plant Details, etc. (*As Applicable)
- 16.4.7.6. Strategic Partnership, Connectivity Expansion, New Product Innovation etc.
- 16.4.8. Tata Power Company Limited
- 16.4.8.1. Company Revenue
- 16.4.8.2. Business Overview
- 16.4.8.3. Product Segments
- 16.4.8.4. Geographic Footprint
- 16.4.8.5. Production Connectivity/Plant Details, etc. (*As Applicable)
- 16.4.8.6. Strategic Partnership, Connectivity Expansion, New Product Innovation etc.
- 16.4.9. General Electric
- 16.4.9.1. Company Revenue
- 16.4.9.2. Business Overview
- 16.4.9.3. Product Segments
- 16.4.9.4. Geographic Footprint
- 16.4.9.5. Production Connectivity/Plant Details, etc. (*As Applicable)
- 16.4.9.6. Strategic Partnership, Connectivity Expansion, New Product Innovation etc.
- 16.4.10. Invenergy
- 16.4.10.1. Company Revenue
- 16.4.10.2. Business Overview
- 16.4.10.3. Product Segments
- 16.4.10.4. Geographic Footprint
- 16.4.10.5. Production Connectivity/Plant Details, etc. (*As Applicable)
- 16.4.10.6. Strategic Partnership, Connectivity Expansion, New Product Innovation etc.
- 16.4.1. ABB