|
|
市場調査レポート
商品コード
1349287
リサイクル銅市場:世界の業界分析、規模、シェア、成長、動向、予測、2023~2031年Recycled Copper Market - Global Industry Analysis, Size, Share, Growth, Trends, and Forecast, 2023-2031 |
||||||
|
|
|||||||
カスタマイズ可能
|
|||||||


| リサイクル銅市場:世界の業界分析、規模、シェア、成長、動向、予測、2023~2031年 |
|
出版日: 2023年07月24日
発行: Transparency Market Research
ページ情報: 英文 310 Pages
納期: 2~10営業日
|

- 全表示
- 概要
- 図表
- 目次
リサイクル銅市場- レポートの範囲
世界のリサイクル銅市場に関するTMRのレポートは、過去と現在の成長動向、および2023年から2031年の予測期間中に市場の指標の貴重な洞察を得る機会を研究しています。レポートは、世界のリサイクル銅市場の収益を提供します。 2017年から2031年の期間、2023年を基準年、2031年を予測年とみなします。レポートは、2023年から2031年までの世界のリサイクル銅市場の年間複合成長率(CAGR %)も提供します。
このレポートは広範な調査を経て作成されました。1次調査では、調査活動の大部分が行われ、アナリストが主要なオピニオンリーダー、業界リーダー、オピニオンメーカーにインタビューを実施しました。2次調査には、リサイクル銅市場を理解するために、主要企業の製品文献、年次報告書、プレスリリース、および関連文書を参照することが含まれていました。
| 市場スナップショット | |
|---|---|
| 2023年の市場価値 | 270億米ドル |
| 2031年の市場価値 | 430億米ドル |
| CAGR | 5.3% |
このレポートは、世界のリサイクル銅市場の競合情勢を詳しく掘り下げています。世界のリサイクル銅市場で活動する主要企業が特定され、それぞれの企業がさまざまな属性の観点からプロファイルされています。会社概要、財務状況、最近の動向、 SWOTは、このレポートで紹介されている世界のリサイクル銅市場のプレーヤーの属性です。
目次
第1章 エグゼクティブサマリー
第2章 市場概要
- 市場セグメンテーション
- 主な発展
- 市場の定義
- 主要な市場動向
- 市場力学
- 世界市場の分析と予測、2023~2031年
- ポーターのファイブフォース分析
- 規制状況
- バリューチェーン分析
- 生産概要
- 製品仕様の分析
第3章 COVID-19の影響後の経済回復
- サプライチェーンへの影響
- 需要への影響- 危機前後
第4章 現在の地政学的シナリオの影響
第5章 生産高分析(トン):地域別、2023年
- 北米
- 欧州
- アジア太平洋地域
- ラテンアメリカ
- 中東・アフリカ
第6章 価格動向分析と予測、2023~2031年
- 価格比較分析:スクラップグレード別
- 価格比較分析:地域別
第7章 世界市場の分析と予測:スクラップグレード別、2023~2031年
- イントロダクションと定義
- 世界市場の数量(トン)と金額予測:スクラップグレード別、2023-2031
- No.1(Cu含有率99%)
- No.2(Cu含有率94%-98%)
- 軽銅スクラップ(銅含有量88%~92%)
- レッドブラススクラップ(Cu含有量75%~85%)
- その他
- 世界市場の魅力:スクラップグレード別
第8章 世界市場の分析と予測:ソース別、2023~2031年
- イントロダクションと定義
- 世界市場の数量(トン)と金額予測:ソース別、2023-2031
- 半製品
- 非合金線
- 銅精錬スラグ
- 電子スクラップ
- 機械部品
- 自動車部品
- 太陽光発電システム
- その他
- 世界市場の魅力:ソース別
第9章 世界市場の分析と予測:最終用途別、2023-2031年
- イントロダクションと定義
- 世界市場の数量(トン)と金額予測:最終用途別、2023-2031
- 建築と建設
- 電気・電子
- 産業用
- 自動車
- エネルギー
- その他
- 世界市場の魅力:最終用途別
第10章 世界市場分析と予測:地域別、2023-2031年
- 主な調査結果
- 世界市場の数量(トン)と金額予測:地域別、2023-2031
- 北米
- 欧州
- アジア太平洋地域
- 中東・アフリカ
- ラテンアメリカ
- 世界市場の魅力:地域別
第11章 北米市場の分析と予測、2023~2031年
第12章 欧州市場の分析と予測、2023~2031年
第13章 アジア太平洋市場の分析と予測、2023~2031年
第14章 ラテンアメリカ市場の分析と予測、2023~2031年
第15章 中東およびアフリカ市場の分析と予測、2023~2031年
第16章 競合情勢
- 市場参入企業-競合マトリックス(企業の階層および規模別)
- 市場シェア分析、2023年
- 市場フットプリント分析
- ソース別
- 最終用途別
- 企業プロファイル(詳細- 概要、財務、最近の展開、戦略)
- Glencore
- Aurubis AG
- Commercial Metals Company
- Schnitzer Steel Industries, Inc
- Umicore NV
- Kuusakoski Group Oy
- Sims Metal Management Ltd
- OmniSource, LLC
- Elgin Recycling
- Pacific Metal Pty Ltd
- Aaron Metals
- Universal Recycling
- Wilton Recycling
- SA Recycling LLC
- European Recycled Metal
- LKM Recycling
第17章 1次調査:主要な洞察
第18章 付録
List of Tables
- Table 1: Global Recycled Copper Market Volume (Tons) Forecast, by Scrap Grade, 2023-2031
- Table 2: Global Recycled Copper Market Value (US$ Bn) Forecast, by Scrap Grade, 2023-2031
- Table 3: Global Recycled Copper Market Volume (Tons) Forecast, by Source, 2023-2031
- Table 4: Global Recycled Copper Market Value (US$ Bn) Forecast, by Source, 2023-2031
- Table 5: Global Recycled Copper Market Volume (Tons) Forecast, by End-use, 2023-2031
- Table 6: Global Recycled Copper Market Value (US$ Bn) Forecast, by End-use, 2023-2031
- Table 7: Global Recycled Copper Market Volume (Tons) Forecast, by Region, 2023-2031
- Table 8: Global Recycled Copper Market Value (US$ Bn) Forecast, by Region, 2023-2031
- Table 9: North America Recycled Copper Market Volume (Tons) Forecast, by Scrap Grade, 2023-2031
- Table 10: North America Recycled Copper Market Value (US$ Bn) Forecast, by Scrap Grade, 2023-2031
- Table 11: North America Recycled Copper Market Volume (Tons) Forecast, by Source, 2023-2031
- Table 12: North America Recycled Copper Market Value (US$ Bn) Forecast, by Source, 2023-2031
- Table 13: North America Recycled Copper Market Volume (Tons) Forecast, by End-use, 2023-2031
- Table 14: North America Recycled Copper Market Value (US$ Bn) Forecast, by End-use, 2023-2031
- Table 15: North America Recycled Copper Market Volume (Tons) Forecast, by Country, 2023-2031
- Table 16: North America Recycled Copper Market Value (US$ Bn) Forecast, by Country, 2023-2031
- Table 17: U.S. Recycled Copper Market Volume (Tons) Forecast, by Scrap Grade, 2023-2031
- Table 18: U.S. Recycled Copper Market Value (US$ Bn) Forecast, by Scrap Grade, 2023-2031
- Table 19: U.S. Recycled Copper Market Volume (Tons) Forecast, by Source, 2023-2031
- Table 20: U.S. Recycled Copper Market Value (US$ Bn) Forecast, by Source, 2023-2031
- Table 21: U.S. Recycled Copper Market Volume (Tons) Forecast, by End-use, 2023-2031
- Table 22: U.S. Recycled Copper Market Value (US$ Bn) Forecast, by End-use, 2023-2031
- Table 23: Canada Recycled Copper Market Volume (Tons) Forecast, by Scrap Grade, 2023-2031
- Table 24: Canada Recycled Copper Market Value (US$ Bn) Forecast, by Scrap Grade, 2023-2031
- Table 25: Canada Recycled Copper Market Volume (Tons) Forecast, by Source, 2023-2031
- Table 26: Canada Recycled Copper Market Value (US$ Bn) Forecast, by Source, 2023-2031
- Table 27: Canada Recycled Copper Market Volume (Tons) Forecast, by End-use, 2023-2031
- Table 28: Canada Recycled Copper Market Value (US$ Bn) Forecast, by End-use, 2023-2031
- Table 29: Europe Recycled Copper Market Volume (Tons) Forecast, by Scrap Grade, 2023-2031
- Table 30: Europe Recycled Copper Market Value (US$ Bn) Forecast, by Scrap Grade, 2023-2031
- Table 31: Europe Recycled Copper Market Volume (Tons) Forecast, by Source, 2023-2031
- Table 32: Europe Recycled Copper Market Value (US$ Bn) Forecast, by Source, 2023-2031
- Table 33: Europe Recycled Copper Market Volume (Tons) Forecast, by End-use, 2023-2031
- Table 34: Europe Recycled Copper Market Value (US$ Bn) Forecast, by End-use, 2023-2031
- Table 35: Europe Recycled Copper Market Volume (Tons) Forecast, by Country and Sub-region, 2023-2031
- Table 36: Europe Recycled Copper Market Value (US$ Bn) Forecast, by Country and Sub-region, 2023-2031
- Table 37: Germany Recycled Copper Market Volume (Tons) Forecast, by Scrap Grade, 2023-2031
- Table 38: Germany Recycled Copper Market Value (US$ Bn) Forecast, by Scrap Grade, 2023-2031
- Table 39: Germany Recycled Copper Market Volume (Tons) Forecast, by Source, 2023-2031
- Table 40: Germany Recycled Copper Market Value (US$ Bn) Forecast, by Source, 2023-2031
- Table 41: Germany Recycled Copper Market Volume (Tons) Forecast, by End-use, 2023-2031
- Table 42: Germany Recycled Copper Market Value (US$ Bn) Forecast, by End-use, 2023-2031
- Table 43: France Recycled Copper Market Volume (Tons) Forecast, by Scrap Grade, 2023-2031
- Table 44: France Recycled Copper Market Value (US$ Bn) Forecast, by Scrap Grade, 2023-2031
- Table 45: France Recycled Copper Market Volume (Tons) Forecast, by Source, 2023-2031
- Table 46: France Recycled Copper Market Value (US$ Bn) Forecast, by Source, 2023-2031
- Table 47: France Recycled Copper Market Volume (Tons) Forecast, by End-use, 2023-2031
- Table 48: France Recycled Copper Market Value (US$ Bn) Forecast, by End-use, 2023-2031
- Table 49: U.K. Recycled Copper Market Volume (Tons) Forecast, by Scrap Grade, 2023-2031
- Table 50: U.K. Recycled Copper Market Value (US$ Bn) Forecast, by Scrap Grade, 2023-2031
- Table 51: U.K. Recycled Copper Market Volume (Tons) Forecast, by Source, 2023-2031
- Table 52: U.K. Recycled Copper Market Value (US$ Bn) Forecast, by Source, 2023-2031
- Table 53: U.K. Recycled Copper Market Volume (Tons) Forecast, by End-use, 2023-2031
- Table 54: U.K. Recycled Copper Market Value (US$ Bn) Forecast, by End-use, 2023-2031
- Table 55: Italy Recycled Copper Market Volume (Tons) Forecast, by Scrap Grade, 2023-2031
- Table 56: Italy Recycled Copper Market Value (US$ Bn) Forecast, by Scrap Grade, 2023-2031
- Table 57: Italy Recycled Copper Market Volume (Tons) Forecast, by Source, 2023-2031
- Table 58: Italy Recycled Copper Market Value (US$ Bn) Forecast, by Source, 2023-2031
- Table 59: Italy Recycled Copper Market Volume (Tons) Forecast, by End-use, 2023-2031
- Table 60: Italy Recycled Copper Market Value (US$ Bn) Forecast, by End-use, 2023-2031
- Table 61: Spain Recycled Copper Market Volume (Tons) Forecast, by Scrap Grade, 2023-2031
- Table 62: Spain Recycled Copper Market Value (US$ Bn) Forecast, by Scrap Grade, 2023-2031
- Table 63: Spain Recycled Copper Market Volume (Tons) Forecast, by Source, 2023-2031
- Table 64: Spain Recycled Copper Market Value (US$ Bn) Forecast, by Source, 2023-2031
- Table 65: Spain Recycled Copper Market Volume (Tons) Forecast, by End-use, 2023-2031
- Table 66: Spain Recycled Copper Market Value (US$ Bn) Forecast, by End-use, 2023-2031
- Table 67: Russia & CIS Recycled Copper Market Volume (Tons) Forecast, by Scrap Grade, 2023-2031
- Table 68: Russia & CIS Recycled Copper Market Value (US$ Bn) Forecast, by Scrap Grade, 2023-2031
- Table 69: Russia & CIS Recycled Copper Market Volume (Tons) Forecast, by Source, 2023-2031
- Table 70: Russia & CIS Recycled Copper Market Value (US$ Bn) Forecast, by Source, 2023-2031
- Table 71: Russia & CIS Recycled Copper Market Volume (Tons) Forecast, by End-use, 2023-2031
- Table 72: Russia & CIS Recycled Copper Market Value (US$ Bn) Forecast, by End-use, 2023-2031
- Table 73: Rest of Europe Recycled Copper Market Volume (Tons) Forecast, by Scrap Grade, 2023-2031
- Table 74: Rest of Europe Recycled Copper Market Value (US$ Bn) Forecast, by Scrap Grade, 2023-2031
- Table 75: Rest of Europe Recycled Copper Market Volume (Tons) Forecast, by Source, 2023-2031
- Table 76: Rest of Europe Recycled Copper Market Value (US$ Bn) Forecast, by Source, 2023-2031
- Table 77: Rest of Europe Recycled Copper Market Volume (Tons) Forecast, by End-use, 2023-2031
- Table 78: Rest of Europe Recycled Copper Market Value (US$ Bn) Forecast, by End-use, 2023-2031
- Table 79: Asia Pacific Recycled Copper Market Volume (Tons) Forecast, by Scrap Grade, 2023-2031
- Table 80: Asia Pacific Recycled Copper Market Value (US$ Bn) Forecast, by Scrap Grade, 2023-2031
- Table 81: Asia Pacific Recycled Copper Market Volume (Tons) Forecast, by Source, 2023-2031
- Table 82: Asia Pacific Recycled Copper Market Value (US$ Bn) Forecast, by Source, 2023-2031
- Table 83: Asia Pacific Recycled Copper Market Volume (Tons) Forecast, by End-use, 2023-2031
- Table 84: Asia Pacific Recycled Copper Market Value (US$ Bn) Forecast, by End-use, 2023-2031
- Table 85: Asia Pacific Recycled Copper Market Volume (Tons) Forecast, by Country and Sub-region, 2023-2031
- Table 86: Asia Pacific Recycled Copper Market Value (US$ Bn) Forecast, by Country and Sub-region, 2023-2031
- Table 87: China Recycled Copper Market Volume (Tons) Forecast, by Scrap Grade, 2023-2031
- Table 88: China Recycled Copper Market Value (US$ Bn) Forecast, by Scrap Grade 2023-2031
- Table 89: China Recycled Copper Market Volume (Tons) Forecast, by Source, 2023-2031
- Table 90: China Recycled Copper Market Value (US$ Bn) Forecast, by Source, 2023-2031
- Table 91: China Recycled Copper Market Volume (Tons) Forecast, by End-use, 2023-2031
- Table 92: China Recycled Copper Market Value (US$ Bn) Forecast, by End-use, 2023-2031
- Table 93: Japan Recycled Copper Market Volume (Tons) Forecast, by Scrap Grade, 2023-2031
- Table 94: Japan Recycled Copper Market Value (US$ Bn) Forecast, by Scrap Grade, 2023-2031
- Table 95: Japan Recycled Copper Market Volume (Tons) Forecast, by Source, 2023-2031
- Table 96: Japan Recycled Copper Market Value (US$ Bn) Forecast, by Source, 2023-2031
- Table 97: Japan Recycled Copper Market Volume (Tons) Forecast, by End-use, 2023-2031
- Table 98: Japan Recycled Copper Market Value (US$ Bn) Forecast, by End-use, 2023-2031
- Table 99: India Recycled Copper Market Volume (Tons) Forecast, by Scrap Grade, 2023-2031
- Table 100: India Recycled Copper Market Value (US$ Bn) Forecast, by Scrap Grade, 2023-2031
- Table 101: India Recycled Copper Market Volume (Tons) Forecast, by Source, 2023-2031
- Table 102: India Recycled Copper Market Value (US$ Bn) Forecast, by Source, 2023-2031
- Table 103: India Recycled Copper Market Volume (Tons) Forecast, by End-use, 2023-2031
- Table 104: India Recycled Copper Market Value (US$ Bn) Forecast, by End-use, 2023-2031
- Table 105: India Recycled Copper Market Volume (Tons) Forecast, by End-use, 2023-2031
- Table 106: India Recycled Copper Market Value (US$ Bn) Forecast, by End-use 2023-2031
- Table 107: ASEAN Recycled Copper Market Volume (Tons) Forecast, by Scrap Grade, 2023-2031
- Table 108: ASEAN Recycled Copper Market Value (US$ Bn) Forecast, by Scrap Grade, 2023-2031
- Table 109: ASEAN Recycled Copper Market Volume (Tons) Forecast, by Source, 2023-2031
- Table 110: ASEAN Recycled Copper Market Value (US$ Bn) Forecast, by Source, 2023-2031
- Table 111: ASEAN Recycled Copper Market Volume (Tons) Forecast, by End-use, 2023-2031
- Table 112: ASEAN Recycled Copper Market Value (US$ Bn) Forecast, by End-use, 2023-2031
- Table 113: Rest of Asia Pacific Recycled Copper Market Volume (Tons) Forecast, by Scrap Grade, 2023-2031
- Table 114: Rest of Asia Pacific Recycled Copper Market Value (US$ Bn) Forecast, by Scrap Grade, 2023-2031
- Table 115: Rest of Asia Pacific Recycled Copper Market Volume (Tons) Forecast, by Source, 2023-2031
- Table 116: Rest of Asia Pacific Recycled Copper Market Value (US$ Bn) Forecast, by Source, 2023-2031
- Table 117: Rest of Asia Pacific Recycled Copper Market Volume (Tons) Forecast, by End-use, 2023-2031
- Table 118: Rest of Asia Pacific Recycled Copper Market Value (US$ Bn) Forecast, by End-use, 2023-2031
- Table 119: Latin America Recycled Copper Market Volume (Tons) Forecast, by Scrap Grade, 2023-2031
- Table 120: Latin America Recycled Copper Market Value (US$ Bn) Forecast, by Scrap Grade, 2023-2031
- Table 121: Latin America Recycled Copper Market Volume (Tons) Forecast, by Source, 2023-2031
- Table 122: Latin America Recycled Copper Market Value (US$ Bn) Forecast, by Source, 2023-2031
- Table 123: Latin America Recycled Copper Market Volume (Tons) Forecast, by End-use, 2023-2031
- Table 124: Latin America Recycled Copper Market Value (US$ Bn) Forecast, by End-use, 2023-2031
- Table 125: Latin America Recycled Copper Market Volume (Tons) Forecast, by Country and Sub-region, 2023-2031
- Table 126: Latin America Recycled Copper Market Value (US$ Bn) Forecast, by Country and Sub-region, 2023-2031
- Table 127: Brazil Recycled Copper Market Volume (Tons) Forecast, by Scrap Grade, 2023-2031
- Table 128: Brazil Recycled Copper Market Value (US$ Bn) Forecast, by Scrap Grade, 2023-2031
- Table 129: Brazil Recycled Copper Market Volume (Tons) Forecast, by Source, 2023-2031
- Table 130: Brazil Recycled Copper Market Value (US$ Bn) Forecast, by Source, 2023-2031
- Table 131: Brazil Recycled Copper Market Volume (Tons) Forecast, by End-use, 2023-2031
- Table 132: Brazil Recycled Copper Market Value (US$ Bn) Forecast, by End-use, 2023-2031
- Table 133: Mexico Recycled Copper Market Volume (Tons) Forecast, by Scrap Grade, 2023-2031
- Table 134: Mexico Recycled Copper Market Value (US$ Bn) Forecast, by Scrap Grade, 2023-2031
- Table 135: Mexico Recycled Copper Market Volume (Tons) Forecast, by Source, 2023-2031
- Table 136: Mexico Recycled Copper Market Value (US$ Bn) Forecast, by Source, 2023-2031
- Table 137: Mexico Recycled Copper Market Volume (Tons) Forecast, by End-use, 2023-2031
- Table 138: Mexico Recycled Copper Market Value (US$ Bn) Forecast, by End-use, 2023-2031
- Table 139: Rest of Latin America Recycled Copper Market Volume (Tons) Forecast, by Scrap Grade, 2023-2031
- Table 140: Rest of Latin America Recycled Copper Market Value (US$ Bn) Forecast, by Scrap Grade, 2023-2031
- Table 141: Rest of Latin America Recycled Copper Market Volume (Tons) Forecast, by Source, 2023-2031
- Table 142: Rest of Latin America Recycled Copper Market Value (US$ Bn) Forecast, by Source, 2023-2031
- Table 143: Rest of Latin America Recycled Copper Market Volume (Tons) Forecast, by End-use, 2023-2031
- Table 144: Rest of Latin America Recycled Copper Market Value (US$ Bn) Forecast, by End-use, 2023-2031
- Table 145: Middle East & Africa Recycled Copper Market Volume (Tons) Forecast, by Scrap Grade, 2023-2031
- Table 146: Middle East & Africa Recycled Copper Market Value (US$ Bn) Forecast, by Scrap Grade, 2023-2031
- Table 147: Middle East & Africa Recycled Copper Market Volume (Tons) Forecast, by Source, 2023-2031
- Table 148: Middle East & Africa Recycled Copper Market Value (US$ Bn) Forecast, by Source, 2023-2031
- Table 149: Middle East & Africa Recycled Copper Market Volume (Tons) Forecast, by End-use, 2023-2031
- Table 150: Middle East & Africa Recycled Copper Market Value (US$ Bn) Forecast, by End-use, 2023-2031
- Table 151: Middle East & Africa Recycled Copper Market Volume (Tons) Forecast, by Country and Sub-region, 2023-2031
- Table 152: Middle East & Africa Recycled Copper Market Value (US$ Bn) Forecast, by Country and Sub-region, 2023-2031
- Table 153: GCC Recycled Copper Market Volume (Tons) Forecast, by Scrap Grade, 2023-2031
- Table 154: GCC Recycled Copper Market Value (US$ Bn) Forecast, by Scrap Grade, 2023-2031
- Table 155: GCC Recycled Copper Market Volume (Tons) Forecast, by Source, 2023-2031
- Table 156: GCC Recycled Copper Market Value (US$ Bn) Forecast, by Source, 2023-2031
- Table 157: GCC Recycled Copper Market Volume (Tons) Forecast, by End-use, 2023-2031
- Table 158: GCC Recycled Copper Market Value (US$ Bn) Forecast, by End-use, 2023-2031
- Table 159: South Africa Recycled Copper Market Volume (Tons) Forecast, by Scrap Grade, 2023-2031
- Table 160: South Africa Recycled Copper Market Value (US$ Bn) Forecast, by Scrap Grade, 2023-2031
- Table 161: South Africa Recycled Copper Market Volume (Tons) Forecast, by Source, 2023-2031
- Table 162: South Africa Recycled Copper Market Value (US$ Bn) Forecast, by Source, 2023-2031
- Table 163: South Africa Recycled Copper Market Volume (Tons) Forecast, by End-use, 2023-2031
- Table 164: South Africa Recycled Copper Market Value (US$ Bn) Forecast, by End-use, 2023-2031
- Table 165: Rest of Middle East & Africa Recycled Copper Market Volume (Tons) Forecast, by Scrap Grade, 2023-2031
- Table 166: Rest of Middle East & Africa Recycled Copper Market Value (US$ Bn) Forecast, by Scrap Grade, 2023-2031
- Table 167: Rest of Middle East & Africa Recycled Copper Market Volume (Tons) Forecast, by Source, 2023-2031
- Table 168: Rest of Middle East & Africa Recycled Copper Market Value (US$ Bn) Forecast, by Source, 2023-2031
- Table 169: Rest of Middle East & Africa Recycled Copper Market Volume (Tons) Forecast, by End-use, 2023-2031
- Table 170: Rest of Middle East & Africa Recycled Copper Market Value (US$ Bn) Forecast, by End-use, 2023-2031
List of Figures
- Figure 1: Global Recycled Copper Market Value Share Analysis, by Scrap Grade, 2022, 2027, and 2031
- Figure 2: Global Recycled Copper Market Attractiveness, by Scrap Grade
- Figure 3: Global Recycled Copper Market Value Share Analysis, by Source, 2022, 2027, and 2031
- Figure 4: Global Recycled Copper Market Attractiveness, by Source
- Figure 5: Global Recycled Copper Market Value Share Analysis, by End-use, 2022, 2027, and 2031
- Figure 6: Global Recycled Copper Market Attractiveness, by End-use
- Figure 7: Global Recycled Copper Market Value Share Analysis, by Region, 2022, 2027, and 2031
- Figure 8: Global Recycled Copper Market Attractiveness, by Region
- Figure 9: North America Recycled Copper Market Value Share Analysis, by Scrap Grade, 2022, 2027, and 2031
- Figure 10: North America Recycled Copper Market Attractiveness, by Scrap Grade
- Figure 11: North America Recycled Copper Market Attractiveness, by Scrap Grade
- Figure 12: North America Recycled Copper Market Value Share Analysis, by Source, 2022, 2027, and 2031
- Figure 13: North America Recycled Copper Market Attractiveness, by Source
- Figure 14: North America Recycled Copper Market Value Share Analysis, by End-use, 2022, 2027, and 2031
- Figure 15: North America Recycled Copper Market Attractiveness, by End-use
- Figure 16: North America Recycled Copper Market Attractiveness, by Country
- Figure 17: Europe Recycled Copper Market Value Share Analysis, by Scrap Grade, 2022, 2027, and 2031
- Figure 18: Europe Recycled Copper Market Attractiveness, by Scrap Grade
- Figure 19: Europe Recycled Copper Market Value Share Analysis, by Source, 2022, 2027, and 2031
- Figure 20: Europe Recycled Copper Market Attractiveness, by Source
- Figure 21: Europe Recycled Copper Market Value Share Analysis, by End-use, 2022, 2027, and 2031
- Figure 22: Europe Recycled Copper Market Attractiveness, by End-use
- Figure 23: Europe Recycled Copper Market Value Share Analysis, by Country and Sub-region, 2022, 2027, and 2031
- Figure 24: Europe Recycled Copper Market Attractiveness, by Country and Sub-region
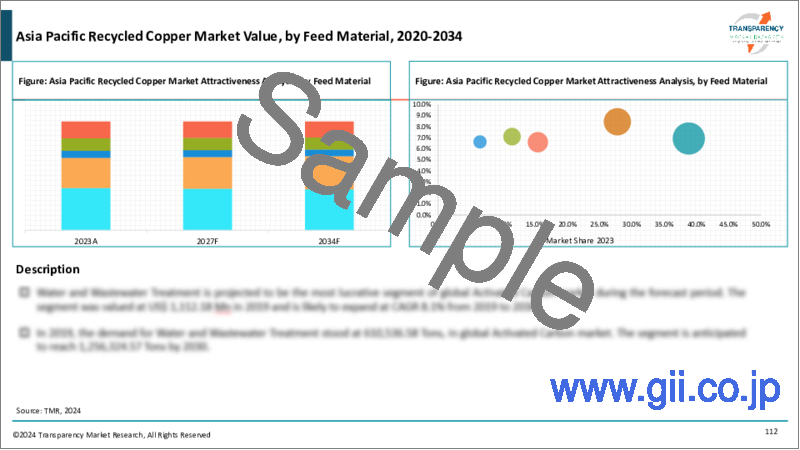
- Figure 25: Asia Pacific Recycled Copper Market Value Share Analysis, by Scrap Grade, 2022, 2027, and 2031
- Figure 26: Asia Pacific Recycled Copper Market Attractiveness, by Scrap Grade
- Figure 27: Asia Pacific Recycled Copper Market Value Share Analysis, by Source, 2022, 2027, and 2031
- Figure 28: Asia Pacific Recycled Copper Market Attractiveness, by Source
- Figure 29: Asia Pacific Recycled Copper Market Value Share Analysis, by End-use, 2022, 2027, and 2031
- Figure 30: Asia Pacific Recycled Copper Market Attractiveness, by End-use
- Figure 31: Asia Pacific Recycled Copper Market Value Share Analysis, by Country and Sub-region, 2022, 2027, and 2031
- Figure 32: Asia Pacific Recycled Copper Market Attractiveness, by Country and Sub-region
- Figure 33: Latin America Recycled Copper Market Value Share Analysis, by Scrap Grade, 2022, 2027, and 2031
- Figure 34: Latin America Recycled Copper Market Attractiveness, by Scrap Grade
- Figure 35: Latin America Recycled Copper Market Value Share Analysis, by Source, 2022, 2027, and 2031
- Figure 36: Latin America Recycled Copper Market Attractiveness, by Source
- Figure 37: Latin America Recycled Copper Market Value Share Analysis, by End-use, 2022, 2027, and 2031
- Figure 38: Latin America Recycled Copper Market Attractiveness, by End-use
- Figure 39: Latin America Recycled Copper Market Value Share Analysis, by Country and Sub-region, 2022, 2027, and 2031
- Figure 40: Latin America Recycled Copper Market Attractiveness, by Country and Sub-region
- Figure 41: Middle East & Africa Recycled Copper Market Value Share Analysis, by Scrap Grade, 2022, 2027, and 2031
- Figure 42: Middle East & Africa Recycled Copper Market Attractiveness, by Scrap Grade
- Figure 43: Middle East & Africa Recycled Copper Market Value Share Analysis, by Source, 2022, 2027, and 2031
- Figure 44: Middle East & Africa Recycled Copper Market Attractiveness, by Source
- Figure 45: Middle East & Africa Recycled Copper Market Value Share Analysis, by End-use, 2022, 2027, and 2031
- Figure 46: Middle East & Africa Recycled Copper Market Attractiveness, by End-use
- Figure 47: Middle East & Africa Recycled Copper Market Value Share Analysis, by Country and Sub-region, 2022, 2027, and 2031
- Figure 48: Middle East & Africa Recycled Copper Market Attractiveness, by Country and Sub-region
Recycled Copper Market - Scope of Report
TMR's report on the global recycled copper market studies the past as well as the current growth trends and opportunities to gain valuable insights of the indicators of the market during the forecast period from 2023 to 2031. The report provides revenue of the global recycled copper market for the period 2017-2031, considering 2023 as the base year and 2031 as the forecast year. The report also provides the compound annual growth rate (CAGR %) of the global recycled copper market from 2023 to 2031.
The report has been prepared after an extensive research. Primary research involved bulk of the research efforts, wherein analysts carried out interviews with key opinion leaders, industry leaders, and opinion makers. Secondary research involved referring to key players' product literature, annual reports, press releases, and relevant documents to understand the recycled copper market.
| Market Snapshot | |
|---|---|
| Market Value in 2023 | US$ 27 Bn |
| Market Value in 2031 | US$ 43 Bn |
| CAGR | 5.3% |
Secondary research also included Internet sources, statistical data from government agencies, websites, and trade associations. Analysts employed a combination of top-down and bottom-up approaches to study various attributes of the global recycled copper market.
The report includes an elaborate executive summary, along with a snapshot of the growth behavior of various segments included in the scope of the study. Moreover, the report throws light on the changing competitive dynamics in the global recycled copper market. These serve as valuable tools for existing market players as well as for entities interested in participating in the global recycled copper market.
The report delves into the competitive landscape of the global recycled copper market. Key players operating in the global recycled copper market have been identified and each one of these has been profiled in terms of various attributes. Company overview, financial standings, recent developments, and SWOT are the attributes of players in the global recycled copper market profiled in this report.
Key Questions Answered in Global Recycled Copper Market Report:
- What is the sales/revenue generated by recycled copper across all regions during the forecast period?
- What are the opportunities in the global recycled copper market?
- What are the major drivers, restraints, opportunities, and threats in the market?
- Which regional market is set to expand at the fastest CAGR during the forecast period?
- Which segment is expected to generate the highest revenue globally in 2031?
- Which segment is projected to expand at the highest CAGR during the forecast period?
- What are the market positions of different companies operating in the global market?
Recycled Copper Market - Research Objectives and Research Approach
The comprehensive report on the global recycled copper market begins with an overview, followed by the scope and objectives of the study. The report provides detailed explanation of the objectives behind this study and key vendors and distributors operating in the market and regulatory scenario for approval of products.
For reading comprehensibility, the report has been compiled in a chapter-wise layout, with each section divided into smaller ones. The report comprises an exhaustive collection of graphs and tables that are appropriately interspersed. Pictorial representation of actual and projected values of key segments is visually appealing to readers. This also allows comparison of the market shares of key segments in the past and at the end of the forecast period.
The report analyzes the global recycled copper market in terms of product, end-user, and region. Key segments under each criterion have been studied at length, and the market share for each of these at the end of 2031 has been provided. Such valuable insights enable market stakeholders in making informed business decisions for investment in the global recycled copper market.
Table of Contents
1. Executive Summary
- 1.1. Global Market Outlook
- 1.2. Demand Side Trends
- 1.3. Key Facts and Figures
- 1.4. Trends Impacting Market
- 1.5. TMR's Growth Opportunity Wheel
2. Market Overview
- 2.1. Market Segmentation
- 2.2. Key Developments
- 2.3. Market Definitions
- 2.4. Key Market Trends
- 2.5. Market Dynamics
- 2.5.1. Drivers
- 2.5.2. Restraints
- 2.5.3. Opportunities
- 2.6. Global Recycled Copper Market Analysis and Forecast, 2023-2031
- 2.6.1. Global Recycled Copper Market Volume (Tons)
- 2.6.2. Global Recycled Copper Market Value (US$ Bn)
- 2.7. Porter's Five Forces Analysis
- 2.8. Regulatory Landscape
- 2.9. Value Chain Analysis
- 2.9.1. List of Raw Scrap Grade Providers
- 2.9.2. List of Manufacturers
- 2.9.3. List of Dealers/Distributors
- 2.9.4. List of Potential Customers
- 2.10. Production Overview
- 2.11. Product Specification Analysis
- 2.11.1. Cost Structure Analysis
3. Economic Recovery Post COVID-19 Impact
- 3.1. Impact on the Supply Chain of the Recycled Copper
- 3.2. Impact on the Demand of Recycled Copper- Pre & Post Crisis
4. Impact of Current Geopolitical Scenario
5. Production Output Analysis (Tons), by Region, 2023
- 5.1. North America
- 5.2. Europe
- 5.3. Asia Pacific
- 5.4. Latin America
- 5.5. Middle East & Africa
6. Price Trend Analysis and Forecast (US$/Ton), 2023-2031
- 6.1. Price Comparison Analysis, by Scrap Grade
- 6.2. Price Comparison Analysis, by Region
7. Global Recycled Copper Market Analysis and Forecast, by Scrap Grade, 2023-2031
- 7.1. Introduction and Definitions
- 7.2. Global Recycled Copper Market Volume (Tons) and Value (US$ Bn) Forecast, by Scrap Grade, 2023-2031
- 7.2.1. No. 1 (99% Cu Content)
- 7.2.2. No. 2 (94%-98% Cu Content)
- 7.2.3. Light copper scrap (88%-92% Cu Content)
- 7.2.4. Red brass scrap (75%-85% Cu Content)
- 7.2.5. Others
- 7.3. Global Recycled Copper Market Attractiveness, by Scrap Grade
8. Global Recycled Copper Market Analysis and Forecast, by Source, 2023-2031
- 8.1. Introduction and Definitions
- 8.2. Global Recycled Copper Market Volume (Tons) and Value (US$ Bn) Forecast, by Source, 2023-2031
- 8.2.1. Semi-Finished Products
- 8.2.2. Unalloyed Wires
- 8.2.3. Copper Smelter Slag
- 8.2.4. Electronic Scrap
- 8.2.5. Machinery Parts
- 8.2.6. Automotive Components
- 8.2.7. Solar Power Systems
- 8.2.8. Others
- 8.3. Global Recycled Copper Market Attractiveness, by Source
9. Global Recycled Copper Market Analysis and Forecast, by End-use, 2023-2031
- 9.1. Introduction and Definitions
- 9.2. Global Recycled Copper Market Volume (Tons) and Value (US$ Bn) Forecast, by End-use, 2023-2031
- 9.2.1. Building & Construction
- 9.2.2. Electrical & Electronics
- 9.2.3. Industrial
- 9.2.4. Automotive
- 9.2.5. Energy
- 9.2.6. Others
- 9.3. Global Recycled Copper Market Attractiveness, by End-use
10. Global Recycled Copper Market Analysis and Forecast, by Region, 2023-2031
- 10.1. Key Findings
- 10.2. Global Recycled Copper Market Volume (Tons) and Value (US$ Bn) Forecast, by Region, 2023-2031
- 10.2.1. North America
- 10.2.2. Europe
- 10.2.3. Asia Pacific
- 10.2.4. Middle East & Africa
- 10.2.5. Latin America
- 10.3. Global Recycled Copper Market Attractiveness, by Region
11. North America Recycled Copper Market Analysis and Forecast, 2023-2031
- 11.1. Key Findings
- 11.2. North America Recycled Copper Market Volume (Tons) and Value (US$ Bn) Forecast, by Scrap Grade, 2023-2031
- 11.3. North America Recycled Copper Market Volume (Tons) and Value (US$ Bn) Forecast, by Source, 2023-2031
- 11.4. North America Recycled Copper Market Volume (Tons) and Value (US$ Bn) Forecast, by End-use, 2023-2031
- 11.5. North America Recycled Copper Market Volume (Tons) and Value (US$ Bn) Forecast, by Country, 2023-2031
- 11.5.1. U.S. Recycled Copper Market Volume (Tons) and Value (US$ Bn) Forecast, by Scrap Grade, 2023-2031
- 11.5.2. U.S. Recycled Copper Market Volume (Tons) and Value (US$ Bn) Forecast, by Source, 2023-2031
- 11.5.3. U.S. Recycled Copper Market Volume (Tons) and Value (US$ Bn) Forecast, by End-use, 2023-2031
- 11.5.4. Canada Recycled Copper Market Volume (Tons) and Value (US$ Bn) Forecast, by Scrap Grade, 2023-2031
- 11.5.5. Canada Recycled Copper Market Volume (Tons) and Value (US$ Bn) Forecast, by Source, 2023-2031
- 11.5.6. Canada Recycled Copper Market Volume (Tons) and Value (US$ Bn) Forecast, by End-use, 2023-2031
- 11.6. North America Recycled Copper Market Attractiveness Analysis
12. Europe Recycled Copper Market Analysis and Forecast, 2023-2031
- 12.1. Key Findings
- 12.2. Europe Recycled Copper Market Volume (Tons) and Value (US$ Bn) Forecast, by Scrap Grade, 2023-2031
- 12.3. Europe Recycled Copper Market Volume (Tons) and Value (US$ Bn) Forecast, by Source, 2023-2031
- 12.4. Europe Recycled Copper Market Volume (Tons) and Value (US$ Bn) Forecast, by End-use, 2023-2031
- 12.5. Europe Recycled Copper Market Volume (Tons) and Value (US$ Bn) Forecast, by Country and Sub-region, 2023-2031
- 12.5.1. Germany Recycled Copper Market Volume (Tons) and Value (US$ Bn) Forecast, by Scrap Grade, 2023-2031
- 12.5.2. Germany Recycled Copper Market Volume (Tons) and Value (US$ Bn) Forecast, by Source, 2023-2031
- 12.5.3. Germany Recycled Copper Market Volume (Tons) and Value (US$ Bn) Forecast, by End-use, 2023-2031
- 12.5.4. France Recycled Copper Market Volume (Tons) and Value (US$ Bn) Forecast, by Scrap Grade, 2023-2031
- 12.5.5. France Recycled Copper Market Volume (Tons) and Value (US$ Bn) Forecast, by Source, 2023-2031
- 12.5.6. France Recycled Copper Market Volume (Tons) and Value (US$ Bn) Forecast, by End-use, 2023-2031
- 12.5.7. U.K. Recycled Copper Market Volume (Tons) and Value (US$ Bn) Forecast, by Scrap Grade, 2023-2031
- 12.5.8. U.K. Recycled Copper Market Volume (Tons) and Value (US$ Bn) Forecast, by Source, 2023-2031
- 12.5.9. U.K. Recycled Copper Market Volume (Tons) and Value (US$ Bn) Forecast, by End-use, 2023-2031
- 12.5.10. Italy Recycled Copper Market Volume (Tons) and Value (US$ Bn) Forecast, by Scrap Grade, 2023-2031
- 12.5.11. Italy. Recycled Copper Market Volume (Tons) and Value (US$ Bn) Forecast, by Source, 2023-2031
- 12.5.12. Italy Recycled Copper Market Volume (Tons) and Value (US$ Bn) Forecast, by End-use, 2023-2031
- 12.5.13. Russia & CIS Recycled Copper Market Volume (Tons) and Value (US$ Bn) Forecast, by Scrap Grade, 2023-2031
- 12.5.14. Russia & CIS Recycled Copper Market Volume (Tons) and Value (US$ Bn) Forecast, by Source, 2023-2031
- 12.5.15. Russia & CIS Recycled Copper Market Volume (Tons) and Value (US$ Bn) Forecast, by End-use, 2023-2031
- 12.5.16. Rest of Europe Recycled Copper Market Volume (Tons) and Value (US$ Bn) Forecast, by Scrap Grade, 2023-2031
- 12.5.17. Rest of Europe Recycled Copper Market Volume (Tons) and Value (US$ Bn) Forecast, by Source, 2023-2031
- 12.5.18. Rest of Europe Recycled Copper Market Volume (Tons) and Value (US$ Bn) Forecast, by End-use, 2023-2031
- 12.6. Europe Recycled Copper Market Attractiveness Analysis
13. Asia Pacific Recycled Copper Market Analysis and Forecast, 2023-2031
- 13.1. Key Findings
- 13.2. Asia Pacific Recycled Copper Market Volume (Tons) and Value (US$ Bn) Forecast, by Scrap Grade
- 13.3. Asia Pacific Recycled Copper Market Volume (Tons) and Value (US$ Bn) Forecast, by Source, 2023-2031
- 13.4. Asia Pacific Recycled Copper Market Volume (Tons) and Value (US$ Bn) Forecast, by End-use, 2023-2031
- 13.5. Asia Pacific Recycled Copper Market Volume (Tons) and Value (US$ Bn) Forecast, by Country and Sub-region, 2023-2031
- 13.5.1. China Recycled Copper Market Volume (Tons) and Value (US$ Bn) Forecast, by Scrap Grade, 2023-2031
- 13.5.2. China Recycled Copper Market Volume (Tons) and Value (US$ Bn) Forecast, by Source, 2023-2031
- 13.5.3. China Recycled Copper Market Volume (Tons) and Value (US$ Bn) Forecast, by End-use, 2023-2031
- 13.5.4. Japan Recycled Copper Market Volume (Tons) and Value (US$ Bn) Forecast, by Scrap Grade, 2023-2031
- 13.5.5. Japan Recycled Copper Market Volume (Tons) and Value (US$ Bn) Forecast, by Source, 2023-2031
- 13.5.6. Japan Recycled Copper Market Volume (Tons) and Value (US$ Bn) Forecast, by End-use, 2023-2031
- 13.5.7. India Recycled Copper Market Volume (Tons) and Value (US$ Bn) Forecast, by Scrap Grade, 2023-2031
- 13.5.8. India Recycled Copper Market Volume (Tons) and Value (US$ Bn) Forecast, by Source, 2023-2031
- 13.5.9. India Recycled Copper Market Volume (Tons) and Value (US$ Bn) Forecast, by End-use, 2023-2031
- 13.5.10. ASEAN Recycled Copper Market Volume (Tons) and Value (US$ Bn) Forecast, by Scrap Grade, 2023-2031
- 13.5.11. ASEAN Recycled Copper Market Volume (Tons) and Value (US$ Bn) Forecast, by Source, 2023-2031
- 13.5.12. ASEAN Recycled Copper Market Volume (Tons) and Value (US$ Bn) Forecast, by End-use, 2023-2031
- 13.5.13. Rest of Asia Pacific Recycled Copper Market Volume (Tons) and Value (US$ Bn) Forecast, by Scrap Grade, 2023-2031
- 13.5.14. Rest of Asia Pacific Recycled Copper Market Volume (Tons) and Value (US$ Bn) Forecast, by Source, 2023-2031
- 13.5.15. Rest of Asia Pacific Recycled Copper Market Volume (Tons) and Value (US$ Bn) Forecast, by End-use, 2023-2031
- 13.6. Asia Pacific Recycled Copper Market Attractiveness Analysis
14. Latin America Recycled Copper Market Analysis and Forecast, 2023-2031
- 14.1. Key Findings
- 14.2. Latin America Recycled Copper Market Volume (Tons) and Value (US$ Bn) Forecast, by Scrap Grade, 2023-2031
- 14.3. Latin America Recycled Copper Market Volume (Tons) and Value (US$ Bn) Forecast, by Source, 2023-2031
- 14.4. Latin America Recycled Copper Market Volume (Tons) and Value (US$ Bn) Forecast, by End-use, 2023-2031
- 14.5. Latin America Recycled Copper Market Volume (Tons) and Value (US$ Bn) Forecast, by Country and Sub-region, 2023-2031
- 14.5.1. Brazil Recycled Copper Market Volume (Tons) and Value (US$ Bn) Forecast, by Scrap Grade, 2023-2031
- 14.5.2. Brazil Recycled Copper Market Volume (Tons) and Value (US$ Bn) Forecast, by Source, 2023-2031
- 14.5.3. Brazil Recycled Copper Market Volume (Tons) and Value (US$ Bn) Forecast, by End-use, 2023-2031
- 14.5.4. Mexico Recycled Copper Market Volume (Tons) and Value (US$ Bn) Forecast, by Scrap Grade, 2023-2031
- 14.5.5. Mexico Recycled Copper Market Volume (Tons) and Value (US$ Bn) Forecast, by Source, 2023-2031
- 14.5.6. Mexico Recycled Copper Market Volume (Tons) and Value (US$ Bn) Forecast, by End-use, 2023-2031
- 14.5.7. Rest of Latin America Recycled Copper Market Volume (Tons) and Value (US$ Bn) Forecast, by Scrap Grade, 2023-2031
- 14.5.8. Rest of Latin America Recycled Copper Market Volume (Tons) and Value (US$ Bn) Forecast, by Source, 2023-2031
- 14.5.9. Rest of Latin America Recycled Copper Market Volume (Tons) and Value (US$ Bn) Forecast, by End-use, 2023-2031
- 14.6. Latin America Recycled Copper Market Attractiveness Analysis
15. Middle East & Africa Recycled Copper Market Analysis and Forecast, 2023-2031
- 15.1. Key Findings
- 15.2. Middle East & Africa Recycled Copper Market Volume (Tons) and Value (US$ Bn) Forecast, by Scrap Grade, 2023-2031
- 15.3. Middle East & Africa Recycled Copper Market Volume (Tons) and Value (US$ Bn) Forecast, by Source, 2023-2031
- 15.4. Middle East & Africa Recycled Copper Market Volume (Tons) and Value (US$ Bn) Forecast, by End-use, 2023-2031
- 15.5. Middle East & Africa Recycled Copper Market Volume (Tons) and Value (US$ Bn) Forecast, by Country and Sub-region, 2023-2031
- 15.5.1. GCC Recycled Copper Market Volume (Tons) and Value (US$ Bn) Forecast, by Scrap Grade, 2023-2031
- 15.5.2. GCC Recycled Copper Market Volume (Tons) and Value (US$ Bn) Forecast, by Source, 2023-2031
- 15.5.3. GCC Recycled Copper Market Volume (Tons) and Value (US$ Bn) Forecast, by End-use, 2023-2031
- 15.5.4. South Africa Recycled Copper Market Volume (Tons) and Value (US$ Bn) Forecast, by Scrap Grade, 2023-2031
- 15.5.5. South Africa Recycled Copper Market Volume (Tons) and Value (US$ Bn) Forecast, by Source, 2023-2031
- 15.5.6. South Africa Recycled Copper Market Volume (Tons) and Value (US$ Bn) Forecast, by End-use, 2023-2031
- 15.5.7. Rest of Middle East & Africa Recycled Copper Market Volume (Tons) and Value (US$ Bn) Forecast, by Scrap Grade, 2023-2031
- 15.5.8. Rest of Middle East & Africa Recycled Copper Market Volume (Tons) and Value (US$ Bn) Forecast, by Source, 2023-2031
- 15.5.9. Rest of Middle East & Africa Recycled Copper Market Volume (Tons) and Value (US$ Bn) Forecast, by End-use, 2023-2031
- 15.6. Middle East & Africa Recycled Copper Market Attractiveness Analysis
16. Competition Landscape
- 16.1. Market Players - Competition Matrix (by Tier and Size of Companies)
- 16.2. Market Share Analysis, 2023
- 16.3. Market Footprint Analysis
- 16.3.1. By Source
- 16.3.2. By End-use
- 16.4. Company Profiles (Details - Overview, Financials, Recent Developments, and Strategy)
- 16.4.1. Glencore
- 16.4.1.1. Company Revenue
- 16.4.1.2. Business Overview
- 16.4.1.3. Product Segments
- 16.4.1.4. Geographic Footprint
- 16.4.1.5. Production Form/Plant Details, etc. (*As Applicable)
- 16.4.1.6. Strategic Partnership, Form Expansion, New Product Innovation, etc.
- 16.4.2. Aurubis AG
- 16.4.2.1. Company Revenue
- 16.4.2.2. Business Overview
- 16.4.2.3. Product Segments
- 16.4.2.4. Geographic Footprint
- 16.4.2.5. Production Form/Plant Details, etc. (*As Applicable)
- 16.4.2.6. Strategic Partnership, Form Expansion, New Product Innovation, etc.
- 16.4.3. Commercial Metals Company
- 16.4.3.1. Company Revenue
- 16.4.3.2. Business Overview
- 16.4.3.3. Product Segments
- 16.4.3.4. Geographic Footprint
- 16.4.3.5. Production Form/Plant Details, etc. (*As Applicable)
- 16.4.3.6. Strategic Partnership, Form Expansion, New Product Innovation, etc.
- 16.4.4. Schnitzer Steel Industries, Inc
- 16.4.4.1. Company Revenue
- 16.4.4.2. Business Overview
- 16.4.4.3. Product Segments
- 16.4.4.4. Geographic Footprint
- 16.4.4.5. Production Form/Plant Details, etc. (*As Applicable)
- 16.4.4.6. Strategic Partnership, Form Expansion, New Product Innovation, etc.
- 16.4.5. Umicore N.V
- 16.4.5.1. Company Revenue
- 16.4.5.2. Business Overview
- 16.4.5.3. Product Segments
- 16.4.5.4. Geographic Footprint
- 16.4.5.5. Production Form/Plant Details, etc. (*As Applicable)
- 16.4.5.6. Strategic Partnership, Form Expansion, New Product Innovation, etc.
- 16.4.6. Kuusakoski Group Oy
- 16.4.6.1. Company Revenue
- 16.4.6.2. Business Overview
- 16.4.6.3. Product Segments
- 16.4.6.4. Geographic Footprint
- 16.4.6.5. Production Form/Plant Details, etc. (*As Applicable)
- 16.4.6.6. Strategic Partnership, Form Expansion, New Product Innovation, etc.
- 16.4.7. Sims Metal Management Ltd
- 16.4.7.1. Company Revenue
- 16.4.7.2. Business Overview
- 16.4.7.3. Product Segments
- 16.4.7.4. Geographic Footprint
- 16.4.7.5. Production Form/Plant Details, etc. (*As Applicable)
- 16.4.7.6. Strategic Partnership, Form Expansion, New Product Innovation, etc.
- 16.4.8. OmniSource, LLC
- 16.4.8.1. Company Revenue
- 16.4.8.2. Business Overview
- 16.4.8.3. Product Segments
- 16.4.8.4. Geographic Footprint
- 16.4.8.5. Production Form/Plant Details, etc. (*As Applicable)
- 16.4.8.6. Strategic Partnership, Form Expansion, New Product Innovation, etc.
- 16.4.9. Elgin Recycling
- 16.4.9.1. Company Revenue
- 16.4.9.2. Business Overview
- 16.4.9.3. Product Segments
- 16.4.9.4. Geographic Footprint
- 16.4.9.5. Production Form/Plant Details, etc. (*As Applicable)
- 16.4.9.6. Strategic Partnership, Form Expansion, New Product Innovation, etc.
- 16.4.10. Pacific Metal Pty Ltd
- 16.4.10.1. Company Revenue
- 16.4.10.2. Business Overview
- 16.4.10.3. Product Segments
- 16.4.10.4. Geographic Footprint
- 16.4.10.5. Production Form/Plant Details, etc. (*As Applicable)
- 16.4.10.6. Strategic Partnership, Form Expansion, New Product Innovation, etc.
- 16.4.11. Aaron Metals
- 16.4.11.1. Company Revenue
- 16.4.11.2. Business Overview
- 16.4.11.3. Product Segments
- 16.4.11.4. Geographic Footprint
- 16.4.11.5. Production Form/Plant Details, etc. (*As Applicable)
- 16.4.11.6. Strategic Partnership, Form Expansion, New Product Innovation, etc.
- 16.4.12. Universal Recycling
- 16.4.12.1. Company Revenue
- 16.4.12.2. Business Overview
- 16.4.12.3. Product Segments
- 16.4.12.4. Geographic Footprint
- 16.4.12.5. Production Form/Plant Details, etc. (*As Applicable)
- 16.4.12.6. Strategic Partnership, Form Expansion, New Product Innovation, etc.
- 16.4.13. Wilton Recycling
- 16.4.13.1. Company Revenue
- 16.4.13.2. Business Overview
- 16.4.13.3. Product Segments
- 16.4.13.4. Geographic Footprint
- 16.4.13.5. Production Form/Plant Details, etc. (*As Applicable)
- 16.4.13.6. Strategic Partnership, Form Expansion, New Product Innovation, etc.
- 16.4.14. SA Recycling LLC
- 16.4.14.1. Company Revenue
- 16.4.14.2. Business Overview
- 16.4.14.3. Product Segments
- 16.4.14.4. Geographic Footprint
- 16.4.14.5. Production Form/Plant Details, etc. (*As Applicable)
- 16.4.14.6. Strategic Partnership, Form Expansion, New Product Innovation, etc.
- 16.4.15. European Recycled Metal
- 16.4.15.1. Company Revenue
- 16.4.15.2. Business Overview
- 16.4.15.3. Product Segments
- 16.4.15.4. Geographic Footprint
- 16.4.15.5. Production Form/Plant Details, etc. (*As Applicable)
- 16.4.15.6. Strategic Partnership, Form Expansion, New Product Innovation, etc.
- 16.4.16. LKM Recycling
- 16.4.16.1. Company Revenue
- 16.4.16.2. Business Overview
- 16.4.16.3. Product Segments
- 16.4.16.4. Geographic Footprint
- 16.4.16.5. Production Form/Plant Details, etc. (*As Applicable)
- 16.4.16.6. Strategic Partnership, Form Expansion, New Product Innovation, etc.
- 16.4.1. Glencore
17. Primary Research: Key Insights
18. Appendix
