|
|
市場調査レポート
商品コード
1269305
回収カーボンブラック市場(タイプ:補強用、準補強用、特殊ブラック、用途:プラスチック、タイヤ、コーティング、非タイヤゴム、その他)-世界の産業分析、規模、シェア、成長、動向、および予測、2023-2031年Recovered Carbon Black Market (Type: Reinforcing, Semi-reinforcing, Specialty Blacks; Application: Plastics, Tire, Coatings, Non-tire Rubber, and Others) - Global Industry Analysis, Size, Share, Growth, Trends, and Forecast, 2023-2031 |
||||||
|
|
|||||||
|
● お客様のご希望に応じて、既存データの加工や未掲載情報(例:国別セグメント)の追加などの対応が可能です。 詳細はお問い合わせください。 |
|||||||


| 回収カーボンブラック市場(タイプ:補強用、準補強用、特殊ブラック、用途:プラスチック、タイヤ、コーティング、非タイヤゴム、その他)-世界の産業分析、規模、シェア、成長、動向、および予測、2023-2031年 |
|
出版日: 2023年03月29日
発行: Transparency Market Research
ページ情報: 英文 380 Pages
納期: 2~10営業日
|
- 全表示
- 概要
- 図表
- 目次
回収カーボンブラック市場- 調査範囲:
TMRの調査レポート「世界の回収カーボンブラック市場」は、2023年から2031年までの予測期間における市場の指標について貴重な知見を得るために、過去だけでなく現在の成長動向と機会も調査しています。本レポートでは、2023年を基準年、2031年を予測年として、2017年から2031年の期間における世界の回収カーボンブラック市場の収益を提供します。また、2023年から2031年までの世界の回収カーボンブラック市場の複合年間成長率(CAGR %)を掲載しています。
本レポートは、広範な調査を経て作成されました。1次調査では、アナリストが主要オピニオンリーダー、業界リーダー、オピニオンメーカーへのインタビューを実施し、調査作業の大部分を行いました。2次調査では、主要企業の製品資料、年次報告書、プレスリリース、関連文書などを参照し、回収カーボンブラック市場を把握しました。
本レポートは、世界の回収カーボンブラック市場の競合情勢を掘り下げています。世界の回収カーボンブラック市場で活動する主要企業が特定され、それぞれの企業が様々な属性でプロファイリングされています。企業概要、財務状況、最近の市場開拓、SWOTは、本レポートで紹介されている世界の回収カーボンブラック市場のプレイヤーの属性です。
目次
第1章 エグゼクティブサマリー
- 世界市場の展望
- 需要サイドの動向
- 主要な事実と数字
- 市場に影響を与える動向
- TMRの成長機会ホイール
第2章 市場の概要
- 市場セグメンテーション
- 主な発展状況
- 市場の定義
- 主要な市場動向
- 市場力学
- 促進要因
- 抑制要因
- 機会
- 世界市場の分析と予測、2023-2031年
- 世界市場数量
- 世界市場売上高
- ポーターのファイブフォース分析
- 規制状況
- バリューチェーン分析
- 原材料供給元一覧
- 主要メーカー一覧
- 主要サプライヤーのリスト
- 潜在顧客リスト
- 製品仕様の分析
- 生産概要
- コスト構造分析
第3章 COVID-19の影響分析
- サプライチェーンへの影響
- 需要への影響- 危機以前と危機以後
第4章 生産量分析(トン)、2021年
- 北米
- 欧州
- アジア太平洋
- ラテンアメリカ
- 中東・アフリカ地域
第5章 現在の地政学的シナリオが市場に与える影響
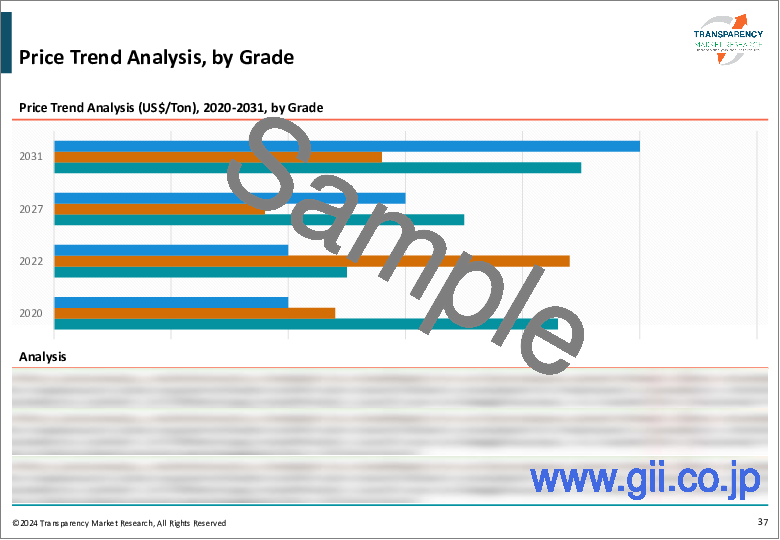
第6章 価格動向分析と予測、2023-2031年
- タイプ別価格動向分析
- 地域別価格動向分析
第7章 市場分析・予測:タイプ別、2023-2031年市場分析・予測:タイプ別、2023-2031年
- イントロダクションと定義
- 世界市場の数量・金額予測:タイプ別、2023年~2031年
- リインフォースメント
- セミリインフォースメント
- スペシャルティブラック
- 世界市場魅力度:タイプ別
第8章 世界市場分析・予測:用途別、2023-2031年
- イントロダクションと定義
- 世界市場の数量・金額予測:用途別、2023年~2031年
- プラスチック
- タイヤ
- コーティング
- 非タイヤゴム
- その他
- 世界市場魅力度:用途別
第9章 世界市場分析・予測:地域別、2023-2031年
- 主な調査結果
- 世界市場の数量・金額予測:地域別、2023年~2031年
- 北米
- 欧州
- アジア太平洋
- ラテンアメリカ
- 中東・アフリカ地域
- 世界市場魅力度:地域別
第10章 北米市場の分析と予測、2023-2031年
- 主な調査結果
- 北米市場の数量・金額予測:タイプ別、2023年~2031年
- 北米市場の数量・金額予測:用途別、2023年~2031年
- 北米市場の数量・金額予測:国別、2023年~2031年
- 米国の市場の数量・金額予測:タイプ別、2023-2031年
- 米国の市場の数量・金額予測:用途別、2023年-2031年
- カナダの市場の数量・金額予測:タイプ別、2023年-2031年
- カナダ市場数量・金額予測:用途別、2023-2031年
- 北米市場魅力度分析
第11章 欧州市場の分析と予測、2023-2031年
- 主な調査結果
- 欧州市場の数量・金額予測:タイプ別、2023-2031年
- 欧州市場の数量・金額予測:用途別、2023-2031年
- 欧州市場の数量・金額予測:国・地域別、2021-2031年
- ドイツ市場数量・金額予測:タイプ別、2023-2031年
- ドイツ市場の数量・金額予測:用途別、2023-2031年
- フランスの市場の数量・金額予測:タイプ別、2023-2031年
- フランス市場数量・金額予測:用途別、2023-2031年
- 英国の市場の数量・金額予測:タイプ別、2023-2031年
- 英国の市場の数量・金額予測:用途別、2023-2031年
- イタリアの市場の数量・金額予測:タイプ別、2023-2031年
- イタリアの市場の数量・金額予測:用途別、2023-2031年
- ロシア・CISの市場の数量・金額予測:タイプ別、2023-2031年
- ロシア・CISの市場の数量・金額予測:用途別、2023年~2031年
- その他欧州の市場の数量・金額予測:タイプ別、2023年~2031年
- その他欧州の市場の数量・金額予測:用途別、2023年~2031年
- 欧州市場の魅力度分析
第12章 アジア太平洋市場の分析と予測、2023-2031年
- 主な調査結果
- アジア太平洋地域の市場の数量および金額予測:タイプ別
- アジア太平洋地域の市場の数量・金額予測:用途別、2023年~2031年
- アジア太平洋地域の市場の数量・金額予測:国・地域別、2021-2031年
- 中国市場の数量・金額予測:タイプ別、2023年-2031年
- 中国市場の数量・金額予測:用途別、2023-2031年
- 日本の市場の数量・金額予測:タイプ別、2023-2031年
- 日本の市場の数量・金額予測:用途別、2023-2031年
- インドの市場の数量・金額予測:タイプ別、2023-2031年
- インドの市場の数量・金額予測:用途別、2023-2031年
- ASEANの市場の数量・金額予測:タイプ別、2023-2031年
- ASEAN市場の数量・金額予測:用途別、2023-2031年
- その他アジア太平洋地域の市場の数量・金額予測:タイプ別、2023年-2031年
- その他アジア太平洋地域の市場の数量・金額予測:用途別、2023-2031年
- アジア太平洋地域の市場魅力度分析
第13章 ラテンアメリカの市場分析と予測、2023-2031年
- 主な調査結果
- ラテンアメリカの市場の数量・金額予測:タイプ別、2023年-2031年
- ラテンアメリカの市場の数量・金額予測:用途別、2023年~2031年
- ラテンアメリカの市場の数量・金額予測:国・地域別、2021-2031年
- ブラジルの市場の数量・金額予測:タイプ別、2023年-2031年
- ブラジルの市場の数量・金額予測:用途別、2023年-2031年
- メキシコの市場の数量・金額予測:タイプ別、2023-2031年
- メキシコの市場の数量・金額予測:用途別、2023-2031年
- その他ラテンアメリカの市場の数量・金額予測:タイプ別、2023年-2031年
- その他ラテンアメリカの市場の数量・金額予測:用途別、2023-2031年
- ラテンアメリカの市場魅力度分析
第14章 中東・アフリカ市場の分析と予測、2023-2031年
- 主な調査結果
- 中東・アフリカ市場の数量・金額予測:タイプ別、2023年~2031年
- 中東・アフリカ市場の数量・金額予測:用途別、2023年~2031年
- 中東・アフリカ市場の数量・金額予測:国・地域別、2021-2031年
- GCCの市場の数量・金額予測:タイプ別、2023-2031年
- GCCの市場の数量・金額予測:用途別、2023年-2031年
- 南アフリカの市場の数量・金額予測:タイプ別、2023-2031年
- 南アフリカの市場の数量・金額予測:用途別、2023-2031年
- その他中東・アフリカの市場の数量・金額予測:タイプ別、2023年-2031年
- その他中東・アフリカの市場の数量・金額予測:用途別、2023年~2031年
- 中東・アフリカ市場の魅力度分析
第15章 競合情勢
- 世界企業の市場シェア分析、2021年
- 企業プロファイル(詳細-概要、財務、最近の動向、戦略)
- Pyrolyx AG
- SR2O Holdings
- Alpha Carbone.
- Scandinavian Enviro System AB
- Integrated Resource Recovery
- Delta-Energy Group
- Bolder Industries
- Black Bear Carbon B.V
- DVA Renewable Energy JSC
第16章 1次調査:主要な洞察
第17章 付録
List of Tables
- Table 1: Global Recovered Carbon Black Market Volume (Tons) Forecast, by Type, 2023-2031
- Table 2: Global Recovered Carbon Black Market Value (US$ Mn) Forecast, by Type, 2023-2031
- Table 3: Global Recovered Carbon Black Market Volume (Tons) Forecast, by Application, 2023-2031
- Table 4: Global Recovered Carbon Black Market Value (US$ Mn) Forecast, by Application, 2023-2031
- Table 5: Global Recovered Carbon Black Market Volume (Tons) Forecast, by Region, 2023-2031
- Table 6: Global Recovered Carbon Black Market Value (US$ Mn) Forecast, by Region, 2023-2031
- Table 7: North America Recovered Carbon Black Market Volume (Tons) Forecast, by Type, 2023-2031
- Table 8: North America Recovered Carbon Black Market Value (US$ Mn) Forecast, by Type, 2023-2031
- Table 9: North America Recovered Carbon Black Market Volume (Tons) Forecast, by Application, 2023-2031
- Table 10: North America Recovered Carbon Black Market Value (US$ Mn) Forecast, by Application, 2023-2031
- Table 11: North America Recovered Carbon Black Market Volume (Tons) Forecast, by Country, 2023-2031
- Table 12: North America Recovered Carbon Black Market Value (US$ Mn) Forecast, by Country, 2023-2031
- Table 13: U.S. Recovered Carbon Black Market Volume (Tons) Forecast, by Type, 2023-2031
- Table 14: U.S. Recovered Carbon Black Market Value (US$ Mn) Forecast, by Type, 2023-2031
- Table 15: U.S. Recovered Carbon Black Market Volume (Tons) Forecast, by Application, 2023-2031
- Table 16: U.S. Recovered Carbon Black Market Value (US$ Mn) Forecast, by Application, 2023-2031
- Table 17: Canada Recovered Carbon Black Market Volume (Tons) Forecast, by Type, 2023-2031
- Table 18: Canada Recovered Carbon Black Market Value (US$ Mn) Forecast, by Type, 2023-2031
- Table 19: Canada Recovered Carbon Black Market Volume (Tons) Forecast, by Application, 2023-2031
- Table 20: Canada Recovered Carbon Black Market Value (US$ Mn) Forecast, by Application 2023-2031
- Table 21: Europe Recovered Carbon Black Market Volume (Tons) Forecast, by Type, 2023-2031
- Table 22: Europe Recovered Carbon Black Market Value (US$ Mn) Forecast, by Type, 2023-2031
- Table 23: Europe Recovered Carbon Black Market Volume (Tons) Forecast, by Application, 2023-2031
- Table 24: Europe Recovered Carbon Black Market Value (US$ Mn) Forecast, by Application 2023-2031
- Table 25: Europe Recovered Carbon Black Market Volume (Tons) Forecast, by Country and Sub-region, 2023-2031
- Table 26: Europe Recovered Carbon Black Market Value (US$ Mn) Forecast, by Country and Sub-region, 2023-2031
- Table 27: Germany Recovered Carbon Black Market Volume (Tons) Forecast, by Type, 2023-2031
- Table 28: Germany Recovered Carbon Black Market Value (US$ Mn) Forecast, by Type, 2023-2031
- Table 29: Germany Recovered Carbon Black Market Volume (Tons) Forecast, by Application, 2023-2031
- Table 30: Germany Recovered Carbon Black Market Value (US$ Mn) Forecast, by Application 2023-2031
- Table 31: France Recovered Carbon Black Market Volume (Tons) Forecast, by Type, 2023-2031
- Table 32: France Recovered Carbon Black Market Value (US$ Mn) Forecast, by Type, 2023-2031
- Table 33: France Recovered Carbon Black Market Volume (Tons) Forecast, by Application, 2023-2031
- Table 34: France Recovered Carbon Black Market Value (US$ Mn) Forecast, by Application 2023-2031
- Table 35: U.K. Recovered Carbon Black Market Volume (Tons) Forecast, by Type, 2023-2031
- Table 36: U.K. Recovered Carbon Black Market Value (US$ Mn) Forecast, by Type, 2023-2031
- Table 37: U.K. Recovered Carbon Black Market Volume (Tons) Forecast, by Application, 2023-2031
- Table 38: U.K. Recovered Carbon Black Market Value (US$ Mn) Forecast, by Application 2023-2031
- Table 39: Italy Recovered Carbon Black Market Volume (Tons) Forecast, by Type, 2023-2031
- Table 40: Italy Recovered Carbon Black Market Value (US$ Mn) Forecast, by Type, 2023-2031
- Table 41: Italy Recovered Carbon Black Market Volume (Tons) Forecast, by Application, 2023-2031
- Table 42: Italy Recovered Carbon Black Market Value (US$ Mn) Forecast, by Application 2023-2031
- Table 43: Spain Recovered Carbon Black Market Volume (Tons) Forecast, by Type, 2023-2031
- Table 44: Spain Recovered Carbon Black Market Value (US$ Mn) Forecast, by Type, 2023-2031
- Table 45: Spain Recovered Carbon Black Market Volume (Tons) Forecast, by Application, 2023-2031
- Table 46: Spain Recovered Carbon Black Market Value (US$ Mn) Forecast, by Application 2023-2031
- Table 47: Russia & CIS Recovered Carbon Black Market Volume (Tons) Forecast, by Type, 2023-2031
- Table 48: Russia & CIS Recovered Carbon Black Market Value (US$ Mn) Forecast, by Type, 2023-2031
- Table 49: Russia & CIS Recovered Carbon Black Market Volume (Tons) Forecast, by Application, 2023-2031
- Table 50: Russia & CIS Recovered Carbon Black Market Value (US$ Mn) Forecast, by Application 2023-2031
- Table 51: Rest of Europe Recovered Carbon Black Market Volume (Tons) Forecast, by Type, 2023-2031
- Table 52: Rest of Europe Recovered Carbon Black Market Value (US$ Mn) Forecast, by Type, 2023-2031
- Table 53: Rest of Europe Recovered Carbon Black Market Volume (Tons) Forecast, by Application, 2023-2031
- Table 54: Rest of Europe Recovered Carbon Black Market Value (US$ Mn) Forecast, by Application 2023-2031
- Table 55: Asia Pacific Recovered Carbon Black Market Volume (Tons) Forecast, by Type, 2023-2031
- Table 56: Asia Pacific Recovered Carbon Black Market Value (US$ Mn) Forecast, by Type, 2023-2031
- Table 57: Asia Pacific Recovered Carbon Black Market Volume (Tons) Forecast, by Application, 2023-2031
- Table 58: Asia Pacific Recovered Carbon Black Market Value (US$ Mn) Forecast, by Application 2023-2031
- Table 59: Asia Pacific Recovered Carbon Black Market Volume (Tons) Forecast, by Country and Sub-region, 2023-2031
- Table 60: Asia Pacific Recovered Carbon Black Market Value (US$ Mn) Forecast, by Country and Sub-region, 2023-2031
- Table 61: China Recovered Carbon Black Market Volume (Tons) Forecast, by Type, 2023-2031
- Table 62: China Recovered Carbon Black Market Value (US$ Mn) Forecast, by Type 2023-2031
- Table 63: China Recovered Carbon Black Market Volume (Tons) Forecast, by Application, 2023-2031
- Table 64: China Recovered Carbon Black Market Value (US$ Mn) Forecast, by Application 2023-2031
- Table 65: Japan Recovered Carbon Black Market Volume (Tons) Forecast, by Type, 2023-2031
- Table 66: Japan Recovered Carbon Black Market Value (US$ Mn) Forecast, by Type, 2023-2031
- Table 67: Japan Recovered Carbon Black Market Volume (Tons) Forecast, by Application, 2023-2031
- Table 68: Japan Recovered Carbon Black Market Value (US$ Mn) Forecast, by Application 2023-2031
- Table 69: India Recovered Carbon Black Market Volume (Tons) Forecast, by Type, 2023-2031
- Table 70: India Recovered Carbon Black Market Value (US$ Mn) Forecast, by Type, 2023-2031
- Table 71: India Recovered Carbon Black Market Volume (Tons) Forecast, by Application, 2023-2031
- Table 72: India Recovered Carbon Black Market Value (US$ Mn) Forecast, by Application 2023-2031
- Table 73: ASEAN Recovered Carbon Black Market Volume (Tons) Forecast, by Type, 2023-2031
- Table 74: ASEAN Recovered Carbon Black Market Value (US$ Mn) Forecast, by Type, 2023-2031
- Table 75: ASEAN Recovered Carbon Black Market Volume (Tons) Forecast, by Application, 2023-2031
- Table 76: ASEAN Recovered Carbon Black Market Value (US$ Mn) Forecast, by Application 2023-2031
- Table 77: Rest of Asia Pacific Recovered Carbon Black Market Volume (Tons) Forecast, by Type, 2023-2031
- Table 78: Rest of Asia Pacific Recovered Carbon Black Market Value (US$ Mn) Forecast, by Type, 2023-2031
- Table 79: Rest of Asia Pacific Recovered Carbon Black Market Volume (Tons) Forecast, by Application, 2023-2031
- Table 80: Rest of Asia Pacific Recovered Carbon Black Market Value (US$ Mn) Forecast, by Application 2023-2031
- Table 81: Latin America Recovered Carbon Black Market Volume (Tons) Forecast, by Type, 2023-2031
- Table 82: Latin America Recovered Carbon Black Market Value (US$ Mn) Forecast, by Type, 2023-2031
- Table 83: Latin America Recovered Carbon Black Market Volume (Tons) Forecast, by Application, 2023-2031
- Table 84: Latin America Recovered Carbon Black Market Value (US$ Mn) Forecast, by Application 2023-2031
- Table 85: Latin America Recovered Carbon Black Market Volume (Tons) Forecast, by Country and Sub-region, 2023-2031
- Table 86: Latin America Recovered Carbon Black Market Value (US$ Mn) Forecast, by Country and Sub-region, 2023-2031
- Table 87: Brazil Recovered Carbon Black Market Volume (Tons) Forecast, by Type, 2023-2031
- Table 88: Brazil Recovered Carbon Black Market Value (US$ Mn) Forecast, by Type, 2023-2031
- Table 89: Brazil Recovered Carbon Black Market Volume (Tons) Forecast, by Application, 2023-2031
- Table 90: Brazil Recovered Carbon Black Market Value (US$ Mn) Forecast, by Application 2023-2031
- Table 91: Mexico Recovered Carbon Black Market Volume (Tons) Forecast, by Type, 2023-2031
- Table 92: Mexico Recovered Carbon Black Market Value (US$ Mn) Forecast, by Type, 2023-2031
- Table 93: Mexico Recovered Carbon Black Market Volume (Tons) Forecast, by Application, 2023-2031
- Table 94: Mexico Recovered Carbon Black Market Value (US$ Mn) Forecast, by Application 2023-2031
- Table 95: Rest of Latin America Recovered Carbon Black Market Volume (Tons) Forecast, by Type, 2023-2031
- Table 96: Rest of Latin America Recovered Carbon Black Market Value (US$ Mn) Forecast, by Type, 2023-2031
- Table 97: Rest of Latin America Recovered Carbon Black Market Volume (Tons) Forecast, by Application, 2023-2031
- Table 98: Rest of Latin America Recovered Carbon Black Market Value (US$ Mn) Forecast, by Application 2023-2031
- Table 99: Middle East & Africa Recovered Carbon Black Market Volume (Tons) Forecast, by Type, 2023-2031
- Table 100: Middle East & Africa Recovered Carbon Black Market Value (US$ Mn) Forecast, by Type, 2023-2031
- Table 101: Middle East & Africa Recovered Carbon Black Market Volume (Tons) Forecast, by Application, 2023-2031
- Table 102: Middle East & Africa Recovered Carbon Black Market Value (US$ Mn) Forecast, by Application 2023-2031
- Table 103: Middle East & Africa Recovered Carbon Black Market Volume (Tons) Forecast, by Country and Sub-region, 2023-2031
- Table 104: Middle East & Africa Recovered Carbon Black Market Value (US$ Mn) Forecast, by Country and Sub-region, 2023-2031
- Table 105: GCC Recovered Carbon Black Market Volume (Tons) Forecast, by Type, 2023-2031
- Table 106: GCC Recovered Carbon Black Market Value (US$ Mn) Forecast, by Type, 2023-2031
- Table 107: GCC Recovered Carbon Black Market Volume (Tons) Forecast, by Application, 2023-2031
- Table 108: GCC Recovered Carbon Black Market Value (US$ Mn) Forecast, by Application 2023-2031
- Table 109: South Africa Recovered Carbon Black Market Volume (Tons) Forecast, by Type, 2023-2031
- Table 110: South Africa Recovered Carbon Black Market Value (US$ Mn) Forecast, by Type, 2023-2031
- Table 111: South Africa Recovered Carbon Black Market Volume (Tons) Forecast, by Application, 2023-2031
- Table 112: South Africa Recovered Carbon Black Market Value (US$ Mn) Forecast, by Application 2023-2031
- Table 113: Rest of Middle East & Africa Recovered Carbon Black Market Volume (Tons) Forecast, by Type, 2023-2031
- Table 114: Rest of Middle East & Africa Recovered Carbon Black Market Value (US$ Mn) Forecast, by Type, 2023-2031
- Table 115: Rest of Middle East & Africa Recovered Carbon Black Market Volume (Tons) Forecast, by Application, 2023-2031
- Table 116: Rest of Middle East & Africa Recovered Carbon Black Market Value (US$ Mn) Forecast, by Application 2023-2031
List of Figures
- Figure 1: Global Recovered Carbon Black Market Volume Share Analysis, by Type, 2021, 2027, and 2031
- Figure 2: Global Recovered Carbon Black Market Attractiveness, by Type
- Figure 3: Global Recovered Carbon Black Market Volume Share Analysis, by Application, 2021, 2027, and 2031
- Figure 4: Global Recovered Carbon Black Market Attractiveness, by Application
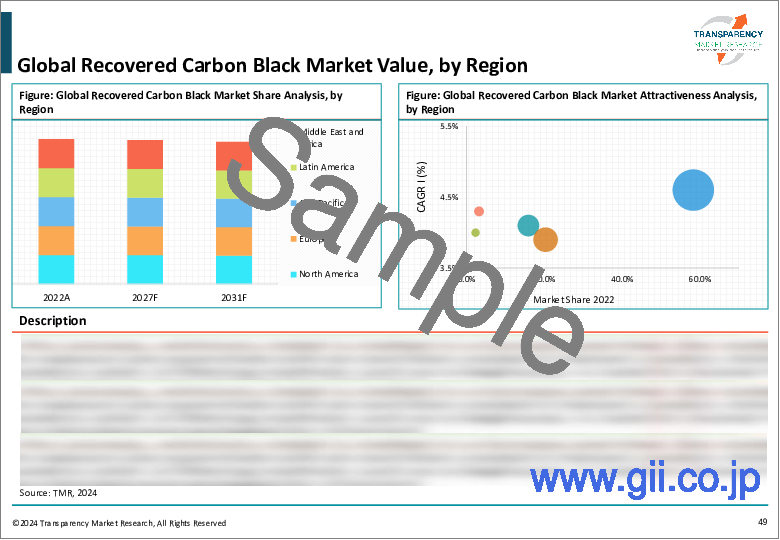
- Figure 5: Global Recovered Carbon Black Market Volume Share Analysis, by Region, 2021, 2027, and 2031
- Figure 6: Global Recovered Carbon Black Market Attractiveness, by Region
- Figure 7: North America Recovered Carbon Black Market Volume Share Analysis, by Type, 2021, 2027, and 2031
- Figure 8: North America Recovered Carbon Black Market Attractiveness, by Type
- Figure 9: North America Recovered Carbon Black Market Attractiveness, by Type
- Figure 10: North America Recovered Carbon Black Market Volume Share Analysis, by Application, 2021, 2027, and 2031
- Figure 11: North America Recovered Carbon Black Market Attractiveness, by Application
- Figure 12: North America Recovered Carbon Black Market Attractiveness, by Country and Sub-region
- Figure 13: Europe Recovered Carbon Black Market Volume Share Analysis, by Type, 2021, 2027, and 2031
- Figure 14: Europe Recovered Carbon Black Market Attractiveness, by Type
- Figure 15: Europe Recovered Carbon Black Market Volume Share Analysis, by Application, 2021, 2027, and 2031
- Figure 16: Europe Recovered Carbon Black Market Attractiveness, by Application
- Figure 17: Europe Recovered Carbon Black Market Volume Share Analysis, by Country and Sub-region, 2021, 2027, and 2031
- Figure 18: Europe Recovered Carbon Black Market Attractiveness, by Country and Sub-region
- Figure 19: Asia Pacific Recovered Carbon Black Market Volume Share Analysis, by Type, 2021, 2027, and 2031
- Figure 20: Asia Pacific Recovered Carbon Black Market Attractiveness, by Type
- Figure 21: Asia Pacific Recovered Carbon Black Market Volume Share Analysis, by Application, 2021, 2027, and 2031
- Figure 22: Asia Pacific Recovered Carbon Black Market Attractiveness, by Application
- Figure 23: Asia Pacific Recovered Carbon Black Market Volume Share Analysis, by Country and Sub-region, 2021, 2027, and 2031
- Figure 24: Asia Pacific Recovered Carbon Black Market Attractiveness, by Country and Sub-region
- Figure 25: Latin America Recovered Carbon Black Market Volume Share Analysis, by Type, 2021, 2027, and 2031
- Figure 26: Latin America Recovered Carbon Black Market Attractiveness, by Type
- Figure 27: Latin America Recovered Carbon Black Market Volume Share Analysis, by Application, 2021, 2027, and 2031
- Figure 28: Latin America Recovered Carbon Black Market Attractiveness, by Application
- Figure 29: Latin America Recovered Carbon Black Market Volume Share Analysis, by Country and Sub-region, 2021, 2027, and 2031
- Figure 30: Latin America Recovered Carbon Black Market Attractiveness, by Country and Sub-region
- Figure 31: Middle East & Africa Recovered Carbon Black Market Volume Share Analysis, by Type, 2021, 2027, and 2031
- Figure 32: Middle East & Africa Recovered Carbon Black Market Attractiveness, by Type
- Figure 33: Middle East & Africa Recovered Carbon Black Market Volume Share Analysis, by Application, 2021, 2027, and 2031
- Figure 34: Middle East & Africa Recovered Carbon Black Market Attractiveness, by Application
- Figure 35: Middle East & Africa Recovered Carbon Black Market Volume Share Analysis, by Country and Sub-region, 2021, 2027, and 2031
- Figure 36: Middle East & Africa Recovered Carbon Black Market Attractiveness, by Country and Sub-region
Recovered Carbon Black Market - Scope of Report:
TMR's report on the global recovered carbon black market studies the past as well as the current growth trends and opportunities to gain valuable insights of the indicators of the market during the forecast period from 2023 to 2031. The report provides revenue of the global recovered carbon black market for the period 2017-2031, considering 2023 as the base year and 2031 as the forecast year. The report also provides the compound annual growth rate (CAGR %) of the global recovered carbon black market from 2023 to 2031.
The report has been prepared after an extensive research. Primary research involved bulk of the research efforts, wherein analysts carried out interviews with key opinion leaders, industry leaders, and opinion makers. Secondary research involved referring to key players' product literature, annual reports, press releases, and relevant documents to understand the recovered carbon black market.
Secondary research also included Internet sources, statistical data from government agencies, websites, and trade associations. Analysts employed a combination of top-down and bottom-up approaches to study various attributes of the global recovered carbon black market.
The report includes an elaborate executive summary, along with a snapshot of the growth behavior of various segments included in the scope of the study. Moreover, the report throws light on the changing competitive dynamics in the global recovered carbon black market. These serve as valuable tools for existing market players as well as for entities interested in participating in the global recovered carbon black market.
The report delves into the competitive landscape of the global recovered carbon black market. Key players operating in the global recovered carbon black market have been identified and each one of these has been profiled in terms of various attributes. Company overview, financial standings, recent developments, and SWOT are the attributes of players in the global recovered carbon black market profiled in this report.
Key Questions Answered in Global Recovered Carbon Black Market Report:
- What is the sales/revenue generated by recovered carbon black across all regions during the forecast period?
- What are the opportunities in the global recovered carbon black market?
- What are the major drivers, restraints, opportunities, and threats in the market?
- Which regional market is set to expand at the fastest CAGR during the forecast period?
- Which segment is expected to generate the highest revenue globally in 2031?
- Which segment is projected to expand at the highest CAGR during the forecast period?
- What are the market positions of different companies operating in the global market?
Recovered Carbon Black Market - Research Objectives and Research Approach:
The comprehensive report on the global recovered carbon black market begins with an overview, followed by the scope and objectives of the study. The report provides detailed explanation of the objectives behind this study and key vendors and distributors operating in the market and regulatory scenario for approval of products.
For reading comprehensibility, the report has been compiled in a chapter-wise layout, with each section divided into smaller ones. The report comprises an exhaustive collection of graphs and tables that are appropriately interspersed. Pictorial representation of actual and projected values of key segments is visually appealing to readers. This also allows comparison of the market shares of key segments in the past and at the end of the forecast period.
The report analyzes the global recovered carbon black market in terms of product, end-user, and region. Key segments under each criterion have been studied at length, and the market share for each of these at the end of 2031 has been provided. Such valuable insights enable market stakeholders in making informed business decisions for investment in the global recovered carbon black market.
Table of Contents
1. Executive Summary
- 1.1. Global Market Outlook
- 1.2. Demand Side Trends
- 1.3. Key Facts and Figures
- 1.4. Trends Impacting Market
- 1.5. TMR's Growth Opportunity Wheel
2. Market Overview
- 2.1. Market Segmentation
- 2.2. Key Developments
- 2.3. Market Definitions
- 2.4. Key Market Trends
- 2.5. Market Dynamics
- 2.5.1. Drivers
- 2.5.2. Restraints
- 2.5.3. Opportunities
- 2.6. Global Recovered Carbon Black Market Analysis and Forecasts, 2023-2031
- 2.6.1. Global Recovered Carbon Black Market Volume (Tons)
- 2.6.2. Global Recovered Carbon Black Market Revenue (US$ Mn)
- 2.7. Porter's Five Forces Analysis
- 2.8. Regulatory Landscape
- 2.9. Value Chain Analysis
- 2.9.1. List of Raw Material Suppliers
- 2.9.2. List of Key Manufacturers
- 2.9.3. List of Key Suppliers
- 2.9.4. List of Potential Customers
- 2.10. Product Specification Analysis
- 2.11. Production Overview
- 2.12. Cost Structure Analysis
3. COVID-19 Impact Analysis
- 3.1. Impact on the Supply Chain of the Recovered Carbon Black
- 3.2. Impact on the Demand of Recovered Carbon Black- Pre & Post Crisis
4. Production Output Analysis (Tons), 2021
- 4.1. North America
- 4.2. Europe
- 4.3. Asia Pacific
- 4.4. Latin America
- 4.5. Middle East and Africa
5. Impact of Current Geopolitical Scenario on Market
6. Price Trend Analysis and Forecast (US$/Ton), 2023-2031
- 6.1. Price Trend Analysis by Type
- 6.2. Price Trend Analysis by Region
7. Recovered Carbon Black Market Analysis and Forecast, by Type, 2023-2031
- 7.1. Introduction and Definitions
- 7.2. Global Recovered Carbon Black Market Volume (Tons) and Value (US$ Mn) Forecast, by Type, 2023-2031
- 7.2.1. Reinforcing
- 7.2.2. Semi-reinforcing
- 7.2.3. Specialty Blacks
- 7.3. Global Recovered Carbon Black Market Attractiveness, by Type
8. Global Recovered Carbon Black Market Analysis and Forecast, Application, 2023-2031
- 8.1. Introduction and Definitions
- 8.2. Global Recovered Carbon Black Market Volume (Tons) and Value (US$ Mn) Forecast, Application, 2023-2031
- 8.2.1. Plastics
- 8.2.2. Tire
- 8.2.3. Coatings
- 8.2.4. Non-tire Rubber
- 8.2.5. Others
- 8.3. Global Recovered Carbon Black Market Attractiveness, by Application
9. Global Recovered Carbon Black Market Analysis and Forecast, by Region, 2023-2031
- 9.1. Key Findings
- 9.2. Global Recovered Carbon Black Market Volume (Tons) and Value (US$ Mn) Forecast, by Region, 2023-2031
- 9.2.1. North America
- 9.2.2. Europe
- 9.2.3. Asia Pacific
- 9.2.4. Latin America
- 9.2.5. Middle East & Africa
- 9.3. Global Recovered Carbon Black Market Attractiveness, by Region
10. North America Recovered Carbon Black Market Analysis and Forecast, 2023-2031
- 10.1. Key Findings
- 10.2. North America Recovered Carbon Black Market Volume (Tons) and Value (US$ Mn) Forecast, by Type, 2023-2031
- 10.3. North America Recovered Carbon Black Market Volume (Tons) and Value (US$ Mn) Forecast, by Application, 2023-2031
- 10.4. North America Recovered Carbon Black Market Volume (Tons) and Value (US$ Mn) Forecast, by Country, 2023-2031
- 10.4.1. U.S. Recovered Carbon Black Market Volume (Tons) and Value (US$ Mn) Forecast, by Type, 2023-2031
- 10.4.2. U.S. Recovered Carbon Black Market Volume (Tons) and Value (US$ Mn) Forecast, Application, 2023-2031
- 10.4.3. Canada Recovered Carbon Black Market Volume (Tons) and Value (US$ Mn) Forecast, by Type, 2023-2031
- 10.4.4. Canada Recovered Carbon Black Market Volume (Tons) and Value (US$ Mn) Forecast, Application, 2023-2031
- 10.5. North America Recovered Carbon Black Market Attractiveness Analysis
11. Europe Recovered Carbon Black Market Analysis and Forecast, 2023-2031
- 11.1. Key Findings
- 11.2. Europe Recovered Carbon Black Market Volume (Tons) and Value (US$ Mn) Forecast, by Type, 2023-2031
- 11.3. Europe Recovered Carbon Black Market Volume (Tons) and Value (US$ Mn) Forecast, by Application, 2023-2031
- 11.4. Europe Recovered Carbon Black Market Volume (Tons) and Value (US$ Mn) Forecast, by Country and Sub-region, 2021-2031
- 11.4.1. Germany Recovered Carbon Black Market Volume (Tons) and Value (US$ Mn) Forecast, by Type, 2023-2031
- 11.4.2. Germany. Recovered Carbon Black Market Volume (Tons) and Value (US$ Mn) Forecast, Application, 2023-2031
- 11.4.3. France Recovered Carbon Black Market Volume (Tons) and Value (US$ Mn) Forecast, by Type, 2023-2031
- 11.4.4. France. Recovered Carbon Black Market Volume (Tons) and Value (US$ Mn) Forecast, Application, 2023-2031
- 11.4.5. U.K. Recovered Carbon Black Market Volume (Tons) and Value (US$ Mn) Forecast, by Type, 2023-2031
- 11.4.6. U.K. Recovered Carbon Black Market Volume (Tons) and Value (US$ Mn) Forecast, Application, 2023-2031
- 11.4.7. Italy Recovered Carbon Black Market Volume (Tons) and Value (US$ Mn) Forecast, by Type, 2023-2031
- 11.4.8. Italy Recovered Carbon Black Market Volume (Tons) and Value (US$ Mn) Forecast, Application, 2023-2031
- 11.4.9. Russia & CIS Recovered Carbon Black Market Volume (Tons) and Value (US$ Mn) Forecast, by Type, 2023-2031
- 11.4.10. Russia & CIS Recovered Carbon Black Market Volume (Tons) and Value (US$ Mn) Forecast, Application, 2023-2031
- 11.4.11. Rest of Europe Recovered Carbon Black Market Volume (Tons) and Value (US$ Mn) Forecast, by Type, 2023-2031
- 11.4.12. Rest of Europe Recovered Carbon Black Market Volume (Tons) and Value (US$ Mn) Forecast, Application, 2023-2031
- 11.5. Europe Recovered Carbon Black Market Attractiveness Analysis
12. Asia Pacific Recovered Carbon Black Market Analysis and Forecast, 2023-2031
- 12.1. Key Findings
- 12.2. Asia Pacific Recovered Carbon Black Market Volume (Tons) and Value (US$ Mn) Forecast, by Type
- 12.3. Asia Pacific Recovered Carbon Black Market Volume (Tons) and Value (US$ Mn) Forecast, by Application, 2023-2031
- 12.4. Asia Pacific Recovered Carbon Black Market Volume (Tons) and Value (US$ Mn) Forecast, by Country and Sub-region, 2021-2031
- 12.4.1. China Recovered Carbon Black Market Volume (Tons) and Value (US$ Mn) Forecast, by Type, 2023-2031
- 12.4.2. China Recovered Carbon Black Market Volume (Tons) and Value (US$ Mn) Forecast, Application, 2023-2031
- 12.4.3. Japan Recovered Carbon Black Market Volume (Tons) and Value (US$ Mn) Forecast, by Type, 2023-2031
- 12.4.4. Japan Recovered Carbon Black Market Volume (Tons) and Value (US$ Mn) Forecast, Application, 2023-2031
- 12.4.5. India Recovered Carbon Black Market Volume (Tons) and Value (US$ Mn) Forecast, by Type, 2023-2031
- 12.4.6. India Recovered Carbon Black Market Volume (Tons) and Value (US$ Mn) Forecast, Application, 2023-2031
- 12.4.7. ASEAN Recovered Carbon Black Market Volume (Tons) and Value (US$ Mn) Forecast, by Type, 2023-2031
- 12.4.8. ASEAN Recovered Carbon Black Market Volume (Tons) and Value (US$ Mn) Forecast, Application, 2023-2031
- 12.4.9. Rest of Asia Pacific Recovered Carbon Black Market Volume (Tons) and Value (US$ Mn) Forecast, by Type, 2023-2031
- 12.4.10. Rest of Asia Pacific Recovered Carbon Black Market Volume (Tons) and Value (US$ Mn) Forecast, Application, 2023-2031
- 12.5. Asia Pacific Recovered Carbon Black Market Attractiveness Analysis
13. Latin America Recovered Carbon Black Market Analysis and Forecast, 2023-2031
- 13.1. Key Findings
- 13.2. Latin America Recovered Carbon Black Market Volume (Tons) and Value (US$ Mn) Forecast, by Type, 2023-2031
- 13.3. Latin America Recovered Carbon Black Market Volume (Tons) and Value (US$ Mn) Forecast, by Application, 2023-2031
- 13.4. Latin America Recovered Carbon Black Market Volume (Tons) and Value (US$ Mn) Forecast, by Country and Sub-region, 2021-2031
- 13.4.1. Brazil Recovered Carbon Black Market Volume (Tons) and Value (US$ Mn) Forecast, by Type, 2023-2031
- 13.4.2. Brazil Recovered Carbon Black Market Volume (Tons) and Value (US$ Mn) Forecast, Application, 2023-2031
- 13.4.3. Mexico Recovered Carbon Black Market Volume (Tons) and Value (US$ Mn) Forecast, by Type, 2023-2031
- 13.4.4. Mexico Recovered Carbon Black Market Volume (Tons) and Value (US$ Mn) Forecast, Application, 2023-2031
- 13.4.5. Rest of Latin America Recovered Carbon Black Market Volume (Tons) and Value (US$ Mn) Forecast, by Type, 2023-2031
- 13.4.6. Rest of Latin America Recovered Carbon Black Market Volume (Tons) and Value (US$ Mn) Forecast, Application, 2023-2031
- 13.5. Latin America Recovered Carbon Black Market Attractiveness Analysis
14. Middle East & Africa Recovered Carbon Black Market Analysis and Forecast, 2023-2031
- 14.1. Key Findings
- 14.2. Middle East & Africa Recovered Carbon Black Market Volume (Tons) and Value (US$ Mn) Forecast, by Type, 2023-2031
- 14.3. Middle East & Africa Recovered Carbon Black Market Volume (Tons) and Value (US$ Mn) Forecast, by Application, 2023-2031
- 14.4. Middle East & Africa Recovered Carbon Black Market Volume (Tons) and Value (US$ Mn) Forecast, by Country and Sub-region, 2021-2031
- 14.4.1. GCC Recovered Carbon Black Market Volume (Tons) and Value (US$ Mn) Forecast, by Type, 2023-2031
- 14.4.2. GCC Recovered Carbon Black Market Volume (Tons) and Value (US$ Mn) Forecast, Application, 2023-2031
- 14.4.3. South Africa Recovered Carbon Black Market Volume (Tons) and Value (US$ Mn) Forecast, by Type, 2023-2031
- 14.4.4. South Africa Recovered Carbon Black Market Volume (Tons) and Value (US$ Mn) Forecast, Application, 2023-2031
- 14.4.5. Rest of Middle East & Africa Recovered Carbon Black Market Volume (Tons) and Value (US$ Mn) Forecast, by Type, 2023-2031
- 14.4.6. Rest of Middle East & Africa Recovered Carbon Black Market Volume (Tons) and Value (US$ Mn) Forecast, Application, 2023-2031
- 14.5. Middle East & Africa Recovered Carbon Black Market Attractiveness Analysis
15. Competition Landscape
- 15.1. Global Recovered Carbon Black Company Market Share Analysis, 2021
- 15.2. Company Profiles (Details - Overview, Financials, Recent Developments, and Strategy)
- 15.2.1. Pyrolyx AG
- 15.2.1.1. Company Revenue
- 15.2.1.2. Business Overview
- 15.2.1.3. Product Segments
- 15.2.1.4. Geographic Footprint
- 15.2.1.5. Production Capacity/Plant Details, etc. (*As Applicable)
- 15.2.1.6. Strategic Partnership, Capacity Expansion, New Product Innovation etc.
- 15.2.2. SR2O Holdings
- 15.2.2.1. Company Revenue
- 15.2.2.2. Business Overview
- 15.2.2.3. Product Segments
- 15.2.2.4. Geographic Footprint
- 15.2.2.5. Production Capacity/Plant Details, etc. (*As Applicable)
- 15.2.2.6. Strategic Partnership, Capacity Expansion, New Product Innovation etc.
- 15.2.3. Alpha Carbone.
- 15.2.3.1. Company Revenue
- 15.2.3.2. Business Overview
- 15.2.3.3. Product Segments
- 15.2.3.4. Geographic Footprint
- 15.2.3.5. Production Capacity/Plant Details, etc. (*As Applicable)
- 15.2.3.6. Strategic Partnership, Capacity Expansion, New Product Innovation etc.
- 15.2.4. Scandinavian Enviro System AB
- 15.2.4.1. Company Revenue
- 15.2.4.2. Business Overview
- 15.2.4.3. Product Segments
- 15.2.4.4. Geographic Footprint
- 15.2.4.5. Production Capacity/Plant Details, etc. (*As Applicable)
- 15.2.4.6. Strategic Partnership, Capacity Expansion, New Product Innovation etc.
- 15.2.5. Integrated Resource Recovery
- 15.2.5.1. Company Revenue
- 15.2.5.2. Business Overview
- 15.2.5.3. Product Segments
- 15.2.5.4. Geographic Footprint
- 15.2.5.5. Production Capacity/Plant Details, etc. (*As Applicable)
- 15.2.5.6. Strategic Partnership, Capacity Expansion, New Product Innovation etc.
- 15.2.6. Delta-Energy Group
- 15.2.6.1. Company Revenue
- 15.2.6.2. Business Overview
- 15.2.6.3. Product Segments
- 15.2.6.4. Geographic Footprint
- 15.2.6.5. Production Capacity/Plant Details, etc. (*As Applicable)
- 15.2.6.6. Strategic Partnership, Capacity Expansion, New Product Innovation etc.
- 15.2.7. Bolder Industries
- 15.2.7.1. Company Revenue
- 15.2.7.2. Business Overview
- 15.2.7.3. Product Segments
- 15.2.7.4. Geographic Footprint
- 15.2.7.5. Production Capacity/Plant Details, etc. (*As Applicable)
- 15.2.7.6. Strategic Partnership, Capacity Expansion, New Product Innovation etc.
- 15.2.8. Black Bear Carbon B.V
- 15.2.8.1. Company Revenue
- 15.2.8.2. Business Overview
- 15.2.8.3. Product Segments
- 15.2.8.4. Geographic Footprint
- 15.2.8.5. Production Capacity/Plant Details, etc. (*As Applicable)
- 15.2.8.6. Strategic Partnership, Capacity Expansion, New Product Innovation etc.
- 15.2.9. DVA Renewable Energy JSC
- 15.2.9.1. Company Revenue
- 15.2.9.2. Business Overview
- 15.2.9.3. Product Segments
- 15.2.9.4. Geographic Footprint
- 15.2.9.5. Production Capacity/Plant Details, etc. (*As Applicable)
- 15.2.9.6. Strategic Partnership, Capacity Expansion, New Product Innovation etc.
- 15.2.1. Pyrolyx AG