|
|
市場調査レポート
商品コード
1229575
睡眠ポリグラフ装置の世界市場(製品:定置型と携帯型、チャンネル:>10チャンネル、16チャンネル、32チャンネル、56チャンネル)-産業分析、サイズ、シェア、成長、動向、予測、2022-2031年Polysomnography Devices Market (Product: Stationary and Portable; and Channel: > 10 Channel, > 16 Channel, > 32 Channel, and > 56 Channel) - Global Industry Analysis, Size, Share, Growth, Trends, and Forecast, 2022-2031 |
||||||
|
|
|||||||
|
● お客様のご希望に応じて、既存データの加工や未掲載情報(例:国別セグメント)の追加などの対応が可能です。 詳細はお問い合わせください。 |
|||||||


| 睡眠ポリグラフ装置の世界市場(製品:定置型と携帯型、チャンネル:>10チャンネル、16チャンネル、32チャンネル、56チャンネル)-産業分析、サイズ、シェア、成長、動向、予測、2022-2031年 |
|
出版日: 2023年01月18日
発行: Transparency Market Research
ページ情報: 英文 152 Pages
納期: 2~10営業日
|
- 全表示
- 概要
- 図表
- 目次
本レポートでは、2022年を基準年、2031年を予測年として、2017年から2031年にかけての世界の睡眠ポリグラフ装置市場の収益を掲載しています。また、2022年から2031年までの世界の睡眠ポリグラフ装置市場の複合年間成長率(CAGR %)を掲載しています。
本レポートは、広範な調査を経て作成されました。1次調査では、アナリストが主要オピニオンリーダー、業界リーダー、オピニオンメーカーへのインタビューを実施し、調査作業の大部分を行っています。2次調査では、主要企業の製品資料、年次報告書、プレスリリース、関連文書などを参照し、睡眠ポリグラフ装置市場を把握しました。
本レポートは、世界の睡眠ポリグラフ装置市場の競合情勢を掘り下げています。世界の睡眠ポリグラフ装置市場で活動する主要企業が特定され、それぞれの企業が様々な属性の観点から、プロファイルを作成しています。企業概要、財務状況、最近の動向、SWOTは、本レポートで紹介されている世界の睡眠ポリグラフ装置市場のプレイヤーの属性です。
目次
第1章 序文
- 市場の定義と範囲
- 市場セグメンテーション
- 主な調査目的
- 調査ハイライト
第2章 前提条件と調査手法
第3章 エグゼクティブサマリー:ポリソムノグラフィー装置の世界市場
第4章 市場の概要
- イントロダクション
- セグメントの定義
- 概要
- 市場力学
- 促進要因
- 抑制要因
- 機会
- 睡眠ポリグラフ装置の世界市場の分析と予測、2017-2031年
- 市場収益予測
第5章 キーインサイト
- 技術的な進歩
- 地域別/世界別の規制シナリオ
- 睡眠障害の概要
- COVID-19パンデミック別産業への影響
第6章 睡眠ポリグラフ装置の世界市場分析・予測:製品別
- イントロダクションと定義
- 主な発見/発展
- 製品別市場価値予測、2017-2031年
- 据え置き型
- ポータブル
- 製品別市場魅力度
第7章 睡眠ポリグラフ装置の世界市場分析・予測:チャネル別
- イントロダクションと定義
- 主な発見/発展
- チャネル別市場価値予測、2017-2031
- >10チャンネル
- >16チャンネル
- >32チャンネル
- >56チャンネル
- チャネル別市場魅力度
第8章 睡眠ポリグラフ装置の世界市場分析・予測:エンドユーザー別
- イントロダクションと定義
- 主な発見/発展
- エンドユーザー別市場価値予測、2017年~2031年
- 病院
- クリニック
- その他
- エンドユーザー別の市場魅力
第9章 睡眠ポリグラフ装置の世界市場分析・予測:地域別
- 主な調査結果
- 地域別市場価値予測
- 北米
- 欧州
- アジア太平洋地域
- ラテンアメリカ
- 中東・アフリカ地域
- 国・地域別市場魅力度
第10章 北米ポリソムノグラフィデバイスの市場分析と予測
- イントロダクション
- 主な調査結果
- 製品別市場価値予測、2017-2031年
- 据え置き型
- ポータブル
- チャネル別市場価値予測、2017-2031
- >10チャンネル
- >16チャンネル
- >32チャンネル
- >56チャンネル
- エンドユーザー別市場価値予測、2017年~2031年
- 病院
- クリニック
- その他
- 国別の市場価値予測、2017-2031年
- 米国
- カナダ
- 市場の魅力度分析
- 製品別
- チャンネル別
- エンドユーザー別
- 国別
第11章 欧州睡眠ポリグラフ装置市場の分析と予測
- イントロダクション
- 主な調査結果
- 製品別市場価値予測、2017-2031年
- 据え置き型
- ポータブル
- チャネル別市場価値予測、2017-2031
- >10チャンネル
- >16チャンネル
- >32チャンネル
- >56チャンネル
- エンドユーザー別市場価値予測、2017年~2031年
- 病院
- クリニック
- その他
- 国/サブリージョン別市場価値予測、2017-2031年
- ドイツ
- U.K.
- フランス
- スペイン
- イタリア
- その他欧州
- 市場の魅力度分析
- 製品別
- チャンネル別
- エンドユーザー別
- 国・地域別
第12章 アジア太平洋地域の睡眠ポリグラフ装置市場の分析と予測
- イントロダクション
- 主な調査結果
- 製品別市場価値予測、2017-2031年
- 据え置き型
- ポータブル
- チャネル別市場価値予測、2017-2031
- >10チャンネル
- >16チャンネル
- >32チャンネル
- >56チャンネル
- エンドユーザー別市場価値予測、2017年~2031年
- 病院
- クリニック
- その他
- 国/サブリージョン別市場価値予測、2017-2031年
- 中国
- 日本
- インド
- オーストラリア・ニュージーランド
- その他アジア太平洋地域
- 市場の魅力度分析
- 製品別
- チャンネル別
- エンドユーザー別
- 国・地域別
第13章 ラテンアメリカポリソムノグラフィー装置の市場分析と予測
- イントロダクション
- 主な調査結果
- 製品別市場価値予測、2017-2031年
- 据え置き型
- ポータブル
- チャネル別市場価値予測、2017-2031
- >10チャンネル
- >16チャンネル
- >32チャンネル
- >56チャンネル
- エンドユーザー別市場価値予測、2017年~2031年
- 病院
- クリニック
- その他
- 国/サブリージョン別市場価値予測、2017-2031年
- ブラジル
- メキシコ
- その他ラテンアメリカ地域
- 市場の魅力度分析
- 製品別
- チャンネル別
- エンドユーザー別
- 国・地域別
第14章 中東・アフリカ睡眠ポリグラフ装置市場の分析と予測
- イントロダクション
- 主な調査結果
- 製品別市場価値予測、2017-2031年
- 据え置き型
- ポータブル
- チャネル別市場価値予測、2017-2031
- >10チャンネル
- >16チャンネル
- >32チャンネル
- >56チャンネル
- エンドユーザー別市場価値予測、2017年~2031年
- 病院
- クリニック
- その他
- 国/サブリージョン別市場価値予測、2017-2031年
- GCC諸国
- 南ア
- その他中東・アフリカ地域
- 市場の魅力度分析
- 製品別
- チャンネル別
- エンドユーザー別
- 国・地域別
第15章 競合情勢
- 市場競争者-競争マトリックス(階層別、企業規模別)
- 企業別シェア/ランキング分析(2021年)
- 企業プロファイル
- SOMNOmedics GmbH
- Natus Medical Incorporated
- Allengers
- Cadwell Industries Inc.
- Neurosoft
- Hiwin Corporation
- Medicom MTD Ltd.
- Compumedics Limited
- Cleveland Medical Devices Inc.
- NOVOS Labs
- Guangzhou Weili Medical Equipment Co., Ltd.
- Nomics S.A.
- Nox Medical
List of Tables
- Table 01: Global Polysomnography Devices Market Value (US$ Mn) Forecast, by Product, 2017-2031
- Table 02: Global Polysomnography Devices Market Value (US$ Mn) Forecast, by Channel, 2017-2031
- Table 03: Global Polysomnography Devices Market Value (US$ Mn) Forecast, by End-user, 2017-2031
- Table 04: Global Polysomnography Devices Market Value (US$ Mn) Forecast, by Region, 2017-2031
- Table 05: North America Polysomnography Devices Market Value (US$ Mn) Forecast, by Country, 2017-2031
- Table 06: North America Polysomnography Devices Market Value (US$ Mn) Forecast, by Product, 2017-2031
- Table 07: North America Polysomnography Devices Market Value (US$ Mn) Forecast, by Channel, 2017-2031
- Table 08: North America Polysomnography Devices Market Value (US$ Mn) Forecast, by End-user, 2017-2031
- Table 09: Europe Polysomnography Devices Market Value (US$ Mn) Forecast, by Country/Sub-Region, 2017-2031
- Table 10: Europe Polysomnography Devices Market Value (US$ Mn) Forecast, by Product, 2017-2031
- Table 11: Europe Polysomnography Devices Market Value (US$ Mn) Forecast, by Channel, 2017-2031
- Table 12: Europe Polysomnography Devices Market Value (US$ Mn) Forecast, by End-user, 2017-2031
- Table 13: Asia Pacific Polysomnography Devices Market Value (US$ Mn) Forecast, by Country/Sub-region, 2017-2031
- Table 14: Asia Pacific Polysomnography Devices Market Value (US$ Mn) Forecast, by Product, 2017-2031
- Table 15: Asia Pacific Polysomnography Devices Market Value (US$ Mn) Forecast, by Channel, 2017-2031
- Table 16: Asia Pacific Polysomnography Devices Market Value (US$ Mn) Forecast, by End-user, 2017-2031
- Table 17: Latin America Polysomnography Devices Market Value (US$ Mn) Forecast, by Country/Sub-region, 2017-2031
- Table 18: Latin America Polysomnography Devices Market Value (US$ Mn) Forecast, by Product, 2017-2031
- Table 19: Latin America Polysomnography Devices Market Value (US$ Mn) Forecast, by Channel, 2017-2031
- Table 20: Latin America Polysomnography Devices Market Value (US$ Mn) Forecast, by End-user, 2017-2031
- Table 21: Middle East & Africa Polysomnography Devices Market Value (US$ Mn) Forecast, by Country/Sub-region, 2017-2031
- Table 22: Middle East & Africa Polysomnography Devices Market Value (US$ Mn) Forecast, by Product, 2017-2031
- Table 23: Middle East & Africa Polysomnography Devices Market Value (US$ Mn) Forecast, by Channel, 2017-2031
- Table 24: Middle East & Africa Polysomnography Devices Market Value (US$ Mn) Forecast, by End-user, 2017-2031
List of Figures
- Figure 01: Global Polysomnography Devices Market Value (US$ Mn) Forecast, 2017-2031
- Figure 02: Global Polysomnography Devices Market Value Share, by Product, 2021
- Figure 03: Global Polysomnography Devices Market Value Share, by Channel, 2021
- Figure 04: Global Polysomnography Devices Market Value Share, by End-user, 2021
- Figure 05: Global Polysomnography Devices Market Value Share Analysis, by Product, 2021 and 2031
- Figure 06: Global Polysomnography Devices Market Attractiveness Analysis, by Product, 2022-2031
- Figure 09: Global Polysomnography Devices Market Value Share Analysis, by Channel, 2021 and 2031
- Figure 10: Global Polysomnography Devices Market Attractiveness Analysis, by Channel, 2022-2031
- Figure 11: Global Polysomnography Devices Market Value Share Analysis, by End-user, 2021 and 2031
- Figure 12: Global Polysomnography Devices Market Attractiveness Analysis, by End-user, 2022-2031
- Figure 13: Global Polysomnography Devices Market Value Share Analysis, by Region, 2021 and 2031
- Figure 14: Global Polysomnography Devices Market Attractiveness Analysis, by Region, 2022-2031
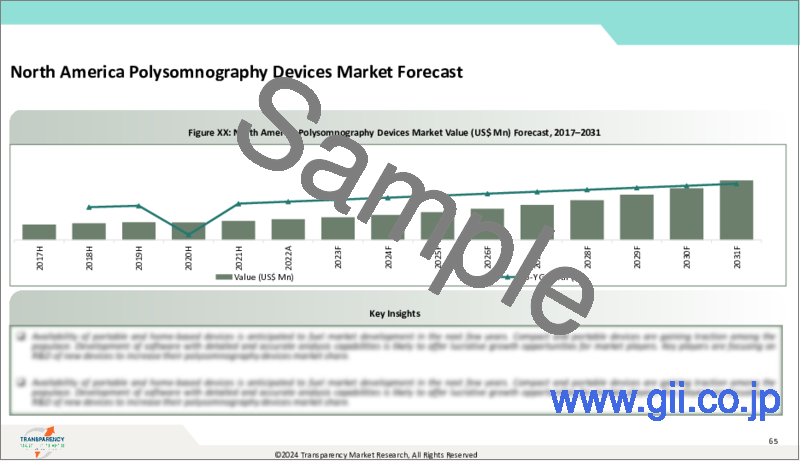
- Figure 15: North America Polysomnography Devices Market Value (US$ Mn) Forecast, 2017-2031
- Figure 16: North America Polysomnography Devices Market Value Share Analysis, by Country, 2021 and 2031
- Figure 17: North America Polysomnography Devices Market Attractiveness Analysis, by Country, 2022-2031
- Figure 18: North America Polysomnography Devices Market Value Share Analysis, by Product, 2021 and 2031
- Figure 19: North America Polysomnography Devices Market Attractiveness Analysis, by Product, 2022-2031
- Figure 20: North America Polysomnography Devices Market Value Share Analysis, by Channel, 2021 and 2031
- Figure 21: North America Polysomnography Devices Market Attractiveness Analysis, by Channel, 2022-2031
- Figure 22: North America Polysomnography Devices Market Value Share Analysis, by End-user, 2021 and 2031
- Figure 23: North America Polysomnography Devices Market Attractiveness Analysis, by End-user, 2022-2031
- Figure 24: Europe Polysomnography Devices Market Value (US$ Mn) Forecast, 2017-2031
- Figure 25: Europe Polysomnography Devices Market Value Share Analysis, by Country/Sub-region, 2021 and 2031
- Figure 26: Europe Polysomnography Devices Market Attractiveness Analysis, by Country/Sub-region, 2022-2031
- Figure 27: Europe Polysomnography Devices Market Value Share Analysis, by Product, 2021 and 2031
- Figure 28: Europe Polysomnography Devices Market Attractiveness Analysis, by Product, 2022-2031
- Figure 29: Europe Polysomnography Devices Market Value Share Analysis, by Channel, 2021 and 2031
- Figure 30: Europe Polysomnography Devices Market Attractiveness Analysis, by Channel, 2022-2031
- Figure 31: Europe Polysomnography Devices Market Value Share Analysis, by End-user, 2021 and 2031
- Figure 32: Europe Polysomnography Devices Market Attractiveness Analysis, by End-user, 2022-2031
- Figure 33: Asia Pacific Polysomnography Devices Market Value (US$ Mn) Forecast, 2017-2031
- Figure 34: Asia Pacific Polysomnography Devices Market Value Share Analysis, by Country/Sub-region, 2021 and 2031
- Figure 35: Asia Pacific Polysomnography Devices Market Attractiveness Analysis, by Country/Sub-region, 2022-2031
- Figure 36: Asia Pacific Polysomnography Devices Market Value Share Analysis, by Product, 2021 and 2031
- Figure 37: Asia Pacific Polysomnography Devices Market Attractiveness Analysis, by Product, 2022-2031
- Figure 38: Asia Pacific Polysomnography Devices Market Value Share Analysis, by Channel, 2021 and 2031
- Figure 39: Asia Pacific Polysomnography Devices Market Attractiveness Analysis, by Channel, 2022-2031
- Figure 40: Asia Pacific Polysomnography Devices Market Value Share Analysis, by End-user, 2021 and 2031
- Figure 41: Asia Pacific Polysomnography Devices Market Attractiveness Analysis, by End-user, 2022-2031
- Figure 42: Latin America Polysomnography Devices Market Value (US$ Mn) Forecast, 2017-2031
- Figure 43: Latin America Polysomnography Devices Market Value Share Analysis, by Country/Sub-Region, 2021 and 2031
- Figure 44: Latin America Polysomnography Devices Market Attractiveness Analysis, by Country/Sub-Region, 2021-2031
- Figure 45: Latin America Polysomnography Devices Market Value Share Analysis, by Product, 2021 and 2031
- Figure 46: Latin America Polysomnography Devices Market Attractiveness Analysis, by Product, 2022-2031
- Figure 47: Latin America Polysomnography Devices Market Value Share Analysis, by Channel, 2021 and 2031
- Figure 48: Latin America Polysomnography Devices Market Attractiveness Analysis, by Channel, 2022-2031
- Figure 49: Latin America Polysomnography Devices Market Value Share Analysis, by End-user, 2021 and 2031
- Figure 50: Latin America Polysomnography Devices Market Attractiveness Analysis, by End-user, 2022-2031
- Figure 51: Middle East & Africa Polysomnography Devices Market Value (US$ Mn) Forecast, 2017-2031
- Figure 52: Middle East & Africa Polysomnography Devices Market Value Share Analysis, by Country/Sub-Region, 2021 and 2031
- Figure 53: Middle East & Africa Polysomnography Devices Market Attractiveness Analysis, by Country/Sub-Region, 2021-2031
- Figure 54: Middle East & Africa Polysomnography Devices Market Value Share Analysis, by Product, 2021 and 2031
- Figure 55: Middle East & Africa Polysomnography Devices Market Attractiveness Analysis, by Product, 2022-2031
- Figure 56: Middle East & Africa Polysomnography Devices Market Value Share Analysis, by Channel, 2021 and 2031
- Figure 57: Middle East & Africa Polysomnography Devices Market Attractiveness Analysis, by Channel, 2022-2031
- Figure 58: Middle East & Africa Polysomnography Devices Market Value Share Analysis, by End-user, 2021 and 2031
- Figure 59: Middle East & Africa Polysomnography Devices Market Attractiveness Analysis, by End-user, 2022-2031
- Figure 60: Company Share Analysis, 2021
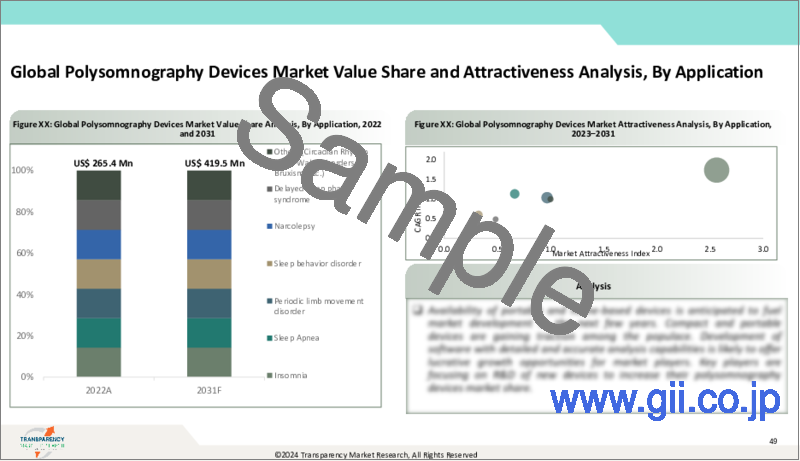
The report provides revenue of the global polysomnography devices market for the period 2017-2031, considering 2022 as the base year and 2031 as the forecast year. The report also provides the compound annual growth rate (CAGR %) of the global polysomnography devices market from 2022 to 2031.
The report has been prepared after an extensive research. Primary research involved bulk of the research efforts, wherein analysts carried out interviews with key opinion leaders, industry leaders, and opinion makers. Secondary research involved referring to key players' product literature, annual reports, press releases, and relevant documents to understand the polysomnography devices market.
The report delves into the competitive landscape of the global polysomnography devices market. Key players operating in the global polysomnography devices market have been identified and each one of these has been profiled, in terms of various attributes. Company overview, financial standings, recent developments, and SWOT are attributes of players in the global polysomnography devices market profiled in this report.
Table of Contents
1. Preface
- 1.1. Market Definition and Scope
- 1.2. Market Segmentation
- 1.3. Key Research Objectives
- 1.4. Research Highlights
2. Assumptions and Research Methodology
3. Executive Summary: Global Polysomnography Devices Market
4. Market Overview
- 4.1. Introduction
- 4.1.1. Segment Definition
- 4.2. Overview
- 4.3. Market Dynamics
- 4.3.1. Drivers
- 4.3.2. Restraints
- 4.3.3. Opportunities
- 4.4. Global Polysomnography Devices Market Analysis and Forecast, 2017-2031
- 4.4.1. Market Revenue Projection (US$ Mn)
5. Key Insights
- 5.1. Technological Advancements
- 5.2. Regulatory Scenario by Region/Globally
- 5.3. Overview of Sleep Disorders
- 5.4. COVID-19 Pandemic Impact on Industry
6. Global Polysomnography Devices Market Analysis and Forecast, By Product
- 6.1. Introduction & Definition
- 6.2. Key Findings/Developments
- 6.3. Market Value Forecast By Product, 2017-2031
- 6.3.1. Stationary
- 6.3.2. Portable
- 6.4. Market Attractiveness By Product
7. Global Polysomnography Devices Market Analysis and Forecast, By Channel
- 7.1. Introduction & Definition
- 7.2. Key Findings/Developments
- 7.3. Market Value Forecast By Channel, 2017-2031
- 7.3.1. > 10 Channel
- 7.3.2. > 16 Channel
- 7.3.3. > 32 Channel
- 7.3.4. > 56 Channel
- 7.4. Market Attractiveness By Channel
8. Global Polysomnography Devices Market Analysis and Forecast, By End-user
- 8.1. Introduction & Definition
- 8.2. Key Findings/Developments
- 8.3. Market Value Forecast By End-user, 2017-2031
- 8.3.1. Hospitals
- 8.3.2. Clinics
- 8.3.3. Others
- 8.4. Market Attractiveness By End-user
9. Global Polysomnography Devices Market Analysis and Forecast, By Region
- 9.1. Key Findings
- 9.2. Market Value Forecast By Region
- 9.2.1. North America
- 9.2.2. Europe
- 9.2.3. Asia Pacific
- 9.2.4. Latin America
- 9.2.5. Middle East & Africa
- 9.3. Market Attractiveness By Country/Region
10. North America Polysomnography Devices Market Analysis and Forecast
- 10.1. Introduction
- 10.1.1. Key Findings
- 10.2. Market Value Forecast By Product, 2017-2031
- 10.2.1. Stationary
- 10.2.2. Portable
- 10.3. Market Value Forecast By Channel, 2017-2031
- 10.3.1. > 10 Channel
- 10.3.2. > 16 Channel
- 10.3.3. > 32 Channel
- 10.3.4. > 56 Channel
- 10.4. Market Value Forecast By End-user, 2017-2031
- 10.4.1. Hospitals
- 10.4.2. Clinics
- 10.4.3. Others
- 10.5. Market Value Forecast By Country, 2017-2031
- 10.5.1. U.S.
- 10.5.2. Canada
- 10.6. Market Attractiveness Analysis
- 10.6.1. By Product
- 10.6.2. By Channel
- 10.6.3. By End-user
- 10.6.4. By Country
11. Europe Polysomnography Devices Market Analysis and Forecast
- 11.1. Introduction
- 11.1.1. Key Findings
- 11.2. Market Value Forecast By Product, 2017-2031
- 11.2.1. Stationary
- 11.2.2. Portable
- 11.3. Market Value Forecast By Channel, 2017-2031
- 11.3.1. > 10 Channel
- 11.3.2. > 16 Channel
- 11.3.3. > 32 Channel
- 11.3.4. > 56 Channel
- 11.4. Market Value Forecast By End-user, 2017-2031
- 11.4.1. Hospitals
- 11.4.2. Clinics
- 11.4.3. Others
- 11.5. Market Value Forecast By Country/Sub-region, 2017-2031
- 11.5.1. Germany
- 11.5.2. U.K.
- 11.5.3. France
- 11.5.4. Spain
- 11.5.5. Italy
- 11.5.6. Rest of Europe
- 11.6. Market Attractiveness Analysis
- 11.6.1. By Product
- 11.6.2. By Channel
- 11.6.3. By End-user
- 11.6.4. By Country/Sub-region
12. Asia Pacific Polysomnography Devices Market Analysis and Forecast
- 12.1. Introduction
- 12.1.1. Key Findings
- 12.2. Market Value Forecast By Product, 2017-2031
- 12.2.1. Stationary
- 12.2.2. Portable
- 12.3. Market Value Forecast By Channel, 2017-2031
- 12.3.1. > 10 Channel
- 12.3.2. > 16 Channel
- 12.3.3. > 32 Channel
- 12.3.4. > 56 Channel
- 12.4. Market Value Forecast By End-user, 2017-2031
- 12.4.1. Hospitals
- 12.4.2. Clinics
- 12.4.3. Others
- 12.5. Market Value Forecast By Country/Sub-region, 2017-2031
- 12.5.1. China
- 12.5.2. Japan
- 12.5.3. India
- 12.5.4. Australia & New Zealand
- 12.5.5. Rest of Asia Pacific
- 12.6. Market Attractiveness Analysis
- 12.6.1. By Product
- 12.6.2. By Channel
- 12.6.3. By End-user
- 12.6.4. By Country/Sub-region
13. Latin America Polysomnography Devices Market Analysis and Forecast
- 13.1. Introduction
- 13.1.1. Key Findings
- 13.2. Market Value Forecast By Product, 2017-2031
- 13.2.1. Stationary
- 13.2.2. Portable
- 13.3. Market Value Forecast By Channel, 2017-2031
- 13.3.1. > 10 Channel
- 13.3.2. > 16 Channel
- 13.3.3. > 32 Channel
- 13.3.4. > 56 Channel
- 13.4. Market Value Forecast By End-user, 2017-2031
- 13.4.1. Hospitals
- 13.4.2. Clinics
- 13.4.3. Others
- 13.5. Market Value Forecast By Country/Sub-region, 2017-2031
- 13.5.1. Brazil
- 13.5.2. Mexico
- 13.5.3. Rest of Latin America
- 13.6. Market Attractiveness Analysis
- 13.6.1. By Product
- 13.6.2. By Channel
- 13.6.3. By End-user
- 13.6.4. By Country/Sub-region
14. Middle East & Africa Polysomnography Devices Market Analysis and Forecast
- 14.1. Introduction
- 14.1.1. Key Findings
- 14.2. Market Value Forecast By Product, 2017-2031
- 14.2.1. Stationary
- 14.2.2. Portable
- 14.3. Market Value Forecast By Channel, 2017-2031
- 14.3.1. > 10 Channel
- 14.3.2. > 16 Channel
- 14.3.3. > 32 Channel
- 14.3.4. > 56 Channel
- 14.4. Market Value Forecast By End-user, 2017-2031
- 14.4.1. Hospitals
- 14.4.2. Clinics
- 14.4.3. Others
- 14.5. Market Value Forecast By Country/Sub-region, 2017-2031
- 14.5.1. GCC Countries
- 14.5.2. South Africa
- 14.5.3. Rest of Middle East & Africa
- 14.6. Market Attractiveness Analysis
- 14.6.1. By Product
- 14.6.2. By Channel
- 14.6.3. By End-user
- 14.6.4. By Country/Sub-region
15. Competition Landscape
- 15.1. Market Player - Competition Matrix (By Tier and Size of Companies)
- 15.2. Market Share/Ranking Analysis By Company (2021)
- 15.3. Company Profiles
- 15.3.1. SOMNOmedics GmbH
- 15.3.1.1. Company Overview
- 15.3.1.2. Product Portfolio
- 15.3.1.3. SWOT Analysis
- 15.3.1.4. Strategic Overview
- 15.3.2. Natus Medical Incorporated
- 15.3.2.1. Company Overview
- 15.3.2.2. Product Portfolio
- 15.3.2.3. SWOT Analysis
- 15.3.2.4. Strategic Overview
- 15.3.3. Allengers
- 15.3.3.1. Company Overview
- 15.3.3.2. Product Portfolio
- 15.3.3.3. SWOT Analysis
- 15.3.3.4. Strategic Overview
- 15.3.4. Cadwell Industries Inc.
- 15.3.4.1. Company Overview
- 15.3.4.2. Product Portfolio
- 15.3.4.3. SWOT Analysis
- 15.3.4.4. Strategic Overview
- 15.3.5. Neurosoft
- 15.3.5.1. Company Overview
- 15.3.5.2. Product Portfolio
- 15.3.5.3. SWOT Analysis
- 15.3.5.4. Strategic Overview
- 15.3.6. Hiwin Corporation
- 15.3.6.1. Company Overview
- 15.3.6.2. Product Portfolio
- 15.3.6.3. SWOT Analysis
- 15.3.6.4. Strategic Overview
- 15.3.7. Medicom MTD Ltd.
- 15.3.7.1. Company Overview
- 15.3.7.2. Product Portfolio
- 15.3.7.3. SWOT Analysis
- 15.3.7.4. Strategic Overview
- 15.3.8. Compumedics Limited
- 15.3.8.1. Company Overview
- 15.3.8.2. Product Portfolio
- 15.3.8.3. SWOT Analysis
- 15.3.8.4. Strategic Overview
- 15.3.9. Cleveland Medical Devices Inc.
- 15.3.9.1. Company Overview
- 15.3.9.2. Product Portfolio
- 15.3.9.3. SWOT Analysis
- 15.3.9.4. Strategic Overview
- 15.3.10. NOVOS Labs
- 15.3.10.1. Company Overview
- 15.3.10.2. Product Portfolio
- 15.3.10.3. SWOT Analysis
- 15.3.10.4. Strategic Overview
- 15.3.11. Guangzhou Weili Medical Equipment Co., Ltd.
- 15.3.11.1. Company Overview
- 15.3.11.2. Product Portfolio
- 15.3.11.3. SWOT Analysis
- 15.3.11.4. Strategic Overview
- 15.3.12. Nomics S.A.
- 15.3.12.1. Company Overview
- 15.3.12.2. Product Portfolio
- 15.3.12.3. SWOT Analysis
- 15.3.12.4. Strategic Overview
- 15.3.13. Nox Medical
- 15.3.13.1. Company Overview
- 15.3.13.2. Product Portfolio
- 15.3.13.3. SWOT Analysis
- 15.3.13.4. Strategic Overview
- 15.3.1. SOMNOmedics GmbH