|
|
市場調査レポート
商品コード
1765023
北米のプロダクトスチュワードシップ市場の2031年までの予測-地域別分析-コンポーネント、展開、組織規模別North America Product Stewardship Market Forecast to 2031 - Regional Analysis - by Component (Services and Software), Deployment (Cloud and On Premises), and Organization Size (Large Enterprises and SMEs) |
||||||
|
|||||||
| 北米のプロダクトスチュワードシップ市場の2031年までの予測-地域別分析-コンポーネント、展開、組織規模別 |
|
出版日: 2025年04月14日
発行: The Insight Partners
ページ情報: 英文 167 Pages
納期: 即納可能
|
全表示
- 概要
- 図表
- 目次
北米のプロダクトスチュワードシップ市場は、2023年に2億9,840万米ドルと評価され、2031年には5億3,930万米ドルに達すると予測され、2023~2031年のCAGRは7.7%と推定されます。
エコフレンドリー製品に対する消費者需要の増加が北米のプロダクトスチュワードシップ市場を後押し
エコフレンドリー製品への消費者行動の大幅な変化が見られます。調査によると、消費者の大多数が購買決定において徐々に持続可能性を優先するようになっています。例えば、Shopifyによると、2024年には消費者の89%がサステイナブル製品を好むように購買行動を変えており、30%近くが購買習慣の大幅な変化を示しています。Z世代は、この消費者動向の最も顕著な採用者として浮上しており、この層は買い物の意思決定において持続可能性を主要な考慮事項として挙げています。WWFの委託を受けたエコノミストインテリジェンスユニットの報告書によると、サステイナブル商品に関連するGoogle検索の人気は、2016年からの過去5年間で世界全体で71%増加しました。環境問題に対する意識の高まりや、自分の価値観に合ったブランドを支持したいという願望に後押しされ、サステイナブル商品に対する消費者の志向が高まっています。消費者、特にZ世代などの若い世代が購買決定において持続可能性を優先する中、プロダクトスチュワードシップを採用する企業は、ブランドイメージと評判を大幅に向上させることができます。このような連携は、消費者の期待に応えるだけでなく、市場における競合優位性にもつながります。その結果、サステイナブルプラクティスを積極的に取り入れる企業は、道徳的義務を果たすと同時に、市場シェアを拡大し、環境意識が高まる経済状況下で収益性を高め、顧客ロイヤルティを育むことができます。これらすべての要因がプロダクトスチュワードシップの実践を後押しし、プロダクトスチュワードシップ市場の成長をさらに促進しています。
北米のプロダクトスチュワードシップ市場概要
北米のプロダクトスチュワードシップ市場は、規制による圧力、持続可能性に対する消費者の要求、責任ある製品ライフサイクル管理に取り組む組織の積極的な取り組みによって、大幅な成長を遂げようとしています。例えば、PSIはプロダクトスチュワードシップの全国的権威であり、組織がスチュワードシップイニシアチブを実施するためのリソースと調査を提供しています。PSIは、米国全土でプロダクトスチュワードシップの概念を広めることに貢献してきました。さらに、PaintCareは10年以上にわたり、全国の様々な州でメーカー主導の塗料スチュワードシッププログラムを成功させており、便利な塗料リサイクルソリューションを促進しています。塗料産業が米国塗料協会(ACA)を通じて設立したPaintCareは、塗料スチュワードシップ法を制定した州において、建築用塗料製品の使用済み段階を管理することを目的とする非営利団体です。
サステイナブル投資フォーラム北米の2024は、国連環境計画(UNEP FI)との公式パートナーシップのもと、3兆米ドルを超える運用資産を持つ資産家を結束させ、プロダクトスチュワードシップを推進する上で極めて重要な役割を果たしています。気候変動ウィーク(Climate Week NYC)期間中に開催される第9回年次総会に向けて、フォーラムは500人の有資格機関投資家と金融界のリーダーを集め、サステイナブル投資プラクティスの促進を目的とした対話と協力を促進します。この集まりは、プロダクトスチュワードシップの原則と密接に一致する責任ある投資を形成し、加速させるために極めて重要です。サステイナブルプラクティスを採用するよう金融界のリーダーを奨励することで、フォーラムは商品のライフサイクル管理を優先するイニシアチブを支援し、環境への配慮が投資決定に組み込まれることを保証します。このような連携は、企業の責任を高めるだけでなく、金融と環境スチュワードシップの相互関連性の認識の高まりを反映し、よりサステイナブル経済への移行を推進します。これらすべての要因が、プロダクトスチュワードシップ市場の成長を後押しすると予想されます。
北米のプロダクトスチュワードシップ市場の収益と2031年までの予測(金額)
北米のプロダクトスチュワードシップ市場のセグメンテーション
北米のプロダクトスチュワードシップ市場は、コンポーネント、展開、組織規模、国に分類されます。
コンポーネントに基づいて、北米のプロダクトスチュワードシップ市場はサービスとソフトウェアに二分されます。2023年の市場シェアはサービスセグメントが大きいです。
展開では、北米のプロダクトスチュワードシップ市場はクラウドとオンプレミスに二分されます。2023年の市場シェアはクラウドセグメントが大きいです。
組織規模別では、北米のプロダクトスチュワードシップ市場は大企業と中小企業に二分されます。2023年には大企業セグメントがより大きな市場シェアを占めています。
国別では、北米のプロダクトスチュワードシップ市場は米国、カナダ、メキシコに区分されます。2023年の北米のプロダクトスチュワードシップ市場シェアは米国が独占しました。
Eaton Corp Plc、Anthesis Group Ltd、CGI Inc、ERM Group, Inc、Wolters Kluwer NV、Intelex Technologies ULC、SAP SE、Sphera Solutions, Inc、Covestro AG、Linde Plc、Arcadis NV、3E、Benchmark Digital Partners LLC、UL LLC、Pace Analytical Services、Dupont de Nemours Inc、knoell、Young & Global Partners、Yordas Limited、Phylmar Groupなどが北米のプロダクトスチュワードシップ市場で事業を展開する主要企業です。
目次
第1章 イントロダクション
第2章 エグゼクティブサマリー
- 主要な洞察
- 市場の魅力
第3章 調査手法
- 二次調査
- 一次調査
- 仮説の策定
- マクロ経済要因分析
- ファンデーション数値の開発
- データの三角測量
- 国レベルのデータ
第4章 北米のプロダクトスチュワードシップ市場情勢
- イントロダクション
- エコシステム分析
- ソフトウェアプロバイダ
- サービスプロバイダ
- 規制機関
- エンドユーザー
- バリューチェーンのベンダー一覧
- 重要考察
- 拡大生産者責任-世界と地域の展望
- 北米
- 拡大生産者責任の各段階における平均コスト
- 廃棄物管理費
- 北米
- 廃棄物カテゴリー別TAM
- プラスチック
- 電池
- 電子廃棄物
- 拡大生産者責任-世界と地域の展望
第5章 北米のプロダクトスチュワードシップ市場:主要市場力学
- 市場促進要因
- エコフレンドリー製品に対する消費者の需要の増加
- 企業の社会的責任への取り組みの増加
- 厳しい政府規制
- 市場抑制要因
- 組織内の変化への抵抗
- 市場機会
- リサイクルインフラへの投資
- リサイクルと廃棄物管理ソリューションに対する需要の高まり
- 動向
- AIを活用した製品管理
- 促進要因と抑制要因の影響
第6章 プロダクトスチュワードシップ市場:北米の分析
- 北米のプロダクトスチュワードシップ市場概要
- プロダクトスチュワードシップ市場の収益(2021年~2031年)
- プロダクトスチュワードシップ市場の予測分析
第7章 北米のプロダクトスチュワードシップ市場分析-コンポーネント別
- サービス
- ソフトウェア
第8章 北米のプロダクトスチュワードシップ市場分析-組織規模別
- 大企業
- 中小企業
第9章 北米のプロダクトスチュワードシップ市場:国別分析
- 北米
- 米国
- カナダ
- メキシコ
第10章 競合情勢
- 主要参入企業によるヒートマップ分析
- 企業のポジショニングと集中度
第11章 産業情勢
- イントロダクション
- 市場イニシアティブ
- 合併と買収
- 新製品開発
第12章 企業プロファイル
- Eaton Corp Plc
- Anthesis Group Ltd
- CGI Inc
- ERM Group, Inc.
- Wolters Kluwer NV
- Intelex Technologies ULC
- SAP SE
- Sphera Solutions, Inc.
- Covestro AG
- Linde Plc
- Arcadis NV
- 3E
- Benchmark Digital Partners LLC
- UL LLC
- Pace Analytical Services
- DuPont de Nemours Inc
- knoell
- Young & Global Partners
- Yordas Limited
- Phylmar Group
第13章 付録
List Of Tables
- Table 1. North America Product Stewardship Market Segmentation
- Table 2. List of Vendors
- Table 3. EPR Registration Fees For Importer (Govt):
- Table 4. EPR Fee Structure For Registration:
- Table 5. EPR for Packaging Base Fees Rates:
- Table 6. Average Packaging EPR Fees to Producers:
- Table 7. Global EPR Fee Structure, by Product Type (Plastic, Battery, E-Waste)
- Table 8. Tipping Fees for Solid Waste and Recyclables
- Table 9. Product Stewardship Market - Revenue and Forecast to 2031 (US$ Million)
- Table 10. Product Stewardship Market - Revenue and Forecast to 2031 (US$ Million) - by Component
- Table 11. Product Stewardship Market - Revenue and Forecast to 2031 (US$ Million) - by Deployment
- Table 12. Product Stewardship Market - Revenue and Forecast to 2031 (US$ Million) - by Organization Size
- Table 13. North America: Product Stewardship Market - Revenue and Forecast to 2031 (US$ Million) - by Country
- Table 14. United States: Product Stewardship Market - Revenue and Forecast to 2031 (US$ Million) - by Component
- Table 15. United States: Product Stewardship Market - Revenue and Forecast to 2031 (US$ Million) - by Deployment
- Table 16. United States: Product Stewardship Market - Revenue and Forecast to 2031 (US$ Million) - by Organization Size
- Table 17. Canada: Product Stewardship Market - Revenue and Forecast to 2031 (US$ Million) - by Component
- Table 18. Canada: Product Stewardship Market - Revenue and Forecast to 2031 (US$ Million) - by Deployment
- Table 19. Canada: Product Stewardship Market - Revenue and Forecast to 2031 (US$ Million) - by Organization Size
- Table 20. Mexico: Product Stewardship Market - Revenue and Forecast to 2031 (US$ Million) - by Component
- Table 21. Mexico: Product Stewardship Market - Revenue and Forecast to 2031 (US$ Million) - by Deployment
- Table 22. Mexico: Product Stewardship Market - Revenue and Forecast to 2031 (US$ Million) - by Organization Size
- Table 23. Company Positioning & Concentration
- Table 24. List of Abbreviation
List Of Figures
- Figure 1. North America Product Stewardship Market Segmentation, by Country
- Figure 2. Basic Fee & Advanced Fee
- Figure 3. Waste Hierarchy And Eco-modulation of EPR Fees
- Figure 4. Product Stewardship Market - Key Market Dynamics
- Figure 5. Impact Analysis of Drivers and Restraints
- Figure 6. Product Stewardship Market Revenue (US$ Million), 2021-2031
- Figure 7. Product Stewardship Market Share (%) - by Component (2023 and 2031)
- Figure 8. Services: Product Stewardship Market - Revenue and Forecast to 2031 (US$ Million)
- Figure 9. Software: Product Stewardship Market - Revenue and Forecast to 2031 (US$ Million)
- Figure 10. Cloud: Product Stewardship Market - Revenue and Forecast to 2031 (US$ Million)
- Figure 11. On Premises: Product Stewardship Market - Revenue and Forecast to 2031 (US$ Million)
- Figure 12. Product Stewardship Market Share (%) - by Organization Size (2023 and 2031)
- Figure 13. Large Enterprises: Product Stewardship Market - Revenue and Forecast to 2031 (US$ Million)
- Figure 14. SMEs: Product Stewardship Market - Revenue and Forecast to 2031 (US$ Million)
- Figure 15. North America Product Stewardship Market, by Key Countries - Revenue (2023) (US$ Million)
- Figure 16. North America: Product Stewardship Market Breakdown, by Key Countries, 2023 and 2031 (%)
- Figure 17. United States: Product Stewardship Market - Revenue and Forecast to 2031 (US$ Million)
- Figure 18. Canada: Product Stewardship Market - Revenue and Forecast to 2031 (US$ Million)
- Figure 19. Mexico: Product Stewardship Market - Revenue and Forecast to 2031 (US$ Million)
- Figure 20. Heat Map Analysis by Key Players
The North America product stewardship market was valued at US$ 298.40 million in 2023 and is expected to reach US$ 539.30 million by 2031; it is estimated to register a CAGR of 7.7% from 2023 to 2031.
Increase in Consumer Demand for Eco-friendly Products Fuels North America Product Stewardship Market
There has been a substantial shift in consumer behavior toward eco-friendly products. Surveys indicate that a large majority of consumers are gradually prioritizing sustainability in their purchasing decisions. For instance, in 2024, according to Shopify, 89% of consumers have changed their shopping behavior to favor sustainable products, with nearly 30% indicating a significant change in their purchasing habits. Generation Z emerges as the most prominent adopter of this consumer trend, with this demographic citing sustainability as a primary consideration in their shopping decisions. According to a report by The Economist Intelligence Unit, commissioned by WWF, the popularity of Google searches relating to sustainable goods has increased by 71% over the past five years globally since 2016. There is a growing consumer inclination for sustainable products, driven by an increasing awareness of environmental issues and a desire to support brands that align with their values. As consumers, particularly younger generations such as Gen Z, prioritize sustainability in their purchasing decisions, companies that adopt product stewardship practices can significantly enhance their brand image and reputation. This alignment not only meets consumer expectations but also translates into a competitive advantage in the marketplace. Consequently, businesses that proactively embrace sustainable practices are fulfilling a moral obligation and are also positioning themselves to capture a larger share of the market, thereby driving profitability and fostering customer loyalty in an increasingly eco-conscious economy. All these factors boost the adoption of product stewardship practices, which is further driving the product stewardship market growth.
North America Product Stewardship Market Overview
The product stewardship market in North America is poised for substantial growth, driven by regulatory pressures, consumer demand for sustainability, and the proactive efforts of organizations dedicated to responsible product lifecycle management. For instance, PSI is a national authority on product stewardship, providing resources and research to help organizations implement stewardship initiatives. It has been instrumental in promoting product stewardship concepts across the US. Moreover, for over a decade, PaintCare has successfully implemented manufacturer-led paint stewardship programs in various states nationwide, facilitating convenient paint recycling solutions. Established by the paint industry through the American Coatings Association (ACA), PaintCare is a nonprofit organization dedicated to managing the end-of-life phase of architectural paint products in states that have enacted paint stewardship legislation.
The Sustainable Investment Forum North America 2024, in official partnership with UNEP FI, plays a pivotal role in advancing product stewardship by uniting asset owners with over US$ 3 trillion in assets under management. As it prepares for its 9th annual edition during Climate Week NYC, the Forum will gather 500 qualified institutional investors and financial leaders to foster dialogue and collaboration aimed at promoting sustainable investment practices. This gathering is crucial for shaping and accelerating responsible investment, which aligns closely with the principles of product stewardship. By encouraging financial leaders to adopt sustainable practices, the Forum supports initiatives that prioritize the lifecycle management of products, ensuring that environmental considerations are integrated into investment decisions. This alignment not only enhances corporate responsibility but also drives the transition toward a more sustainable economy, reflecting the growing recognition of the interconnectedness between finance and environmental stewardship. All of these factors are expected to boost the product stewardship market growth.
North America Product Stewardship Market Revenue and Forecast to 2031 (US$ Million)
North America Product Stewardship Market Segmentation
The North America product stewardship market is categorized into component, deployment, organization size, and country.
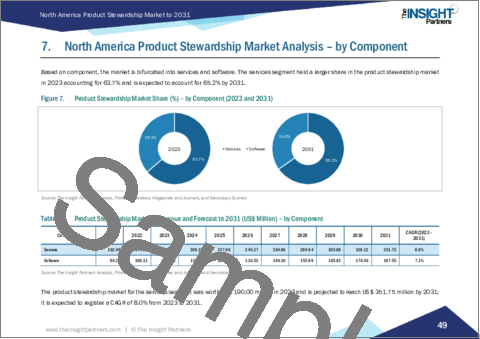
Based on component, the North America product stewardship market is bifurcated into services and software. The services segment held a larger market share in 2023.
In terms of deployment, the North America product stewardship market is bifurcated into cloud and on-premises. The cloud segment held a larger market share in 2023.
By organization size, the North America product stewardship market is bifurcated into large enterprises and SMEs. The large enterprises segment held a larger market share in 2023.
By country, the North America product stewardship market is segmented into the US, Canada, and Mexico. The US dominated the North America product stewardship market share in 2023.
Eaton Corp Plc, Anthesis Group Ltd, CGI Inc, ERM Group, Inc., Wolters Kluwer NV, Intelex Technologies ULC, SAP SE, Sphera Solutions, Inc., Covestro AG, Linde Plc, Arcadis NV, 3E, Benchmark Digital Partners LLC, UL LLC, Pace Analytical Services, Dupont de Nemours Inc, knoell, Young & Global Partners, Yordas Limited, and Phylmar Group, are among the leading companies operating in the North America product stewardship market.
Table Of Contents
1. Introduction
- 1.1 The Insight Partners Research Report Guidance
- 1.2 Market Segmentation
2. Executive Summary
- 2.1 Key Insights
- 2.2 Market Attractiveness
3. Research Methodology
- 3.1 Secondary Research
- 3.2 Primary Research
- 3.2.1 Hypothesis formulation:
- 3.2.2 Macro-economic factor analysis:
- 3.2.3 Developing base number:
- 3.2.4 Data Triangulation:
- 3.2.5 Country level data:
4. North America Product Stewardship Market Landscape
- 4.1 Overview
- 4.2 Ecosystem Analysis
- 4.2.1 Software Providers:
- 4.2.2 Services Providers:
- 4.2.3 Regulatory Bodies:
- 4.2.4 End-Users:
- 4.2.5 List of Vendors in the Value Chain
- 4.3 Premium Insights
- 4.3.1 Extended Producer Responsibility - Global and Regional Outlook
- 4.3.1.1 North America
- 4.3.2 Average Cost at Individual Step in Extended Producer Responsibility
- 4.3.3 Waste Management Fees
- 4.3.3.1 North America
- 4.3.4 TAM by Waste Category
- 4.3.4.1 Plastic
- 4.3.4.2 Battery
- 4.3.4.3 E-Waste
- 4.3.1 Extended Producer Responsibility - Global and Regional Outlook
5. North America Product Stewardship Market - Key Market Dynamics
- 5.1 Market Drivers
- 5.1.1 Increase in Consumer Demand for Eco-friendly Products
- 5.1.2 Rise In Corporate Social Responsibility Initiatives
- 5.1.3 Strict Government Regulations
- 5.2 Market Restraints
- 5.2.1 Resistance to Change within the Organization
- 5.3 Market Opportunities
- 5.3.1 Investment in Recycling Infrastructure
- 5.3.2 Rising Demand for Recycling and Waste Management Solutions
- 5.4 Trends
- 5.4.1 AI-Powered Product Stewardship
- 5.5 Impact of Drivers and Restraints:
6. Product Stewardship Market - North America Analysis
- 6.1 North America Product Stewardship Market Overview
- 6.2 Product Stewardship Market Revenue (US$ Million), 2021-2031
- 6.3 Product Stewardship Market Forecast Analysis
7. North America Product Stewardship Market Analysis - by Component
- 7.1 Services
- 7.1.1 Overview
- 7.1.2 Services: Product Stewardship Market - Revenue and Forecast to 2031 (US$ Million)
- 7.2 Software
- 7.2.1 Overview
- 7.2.2 Software: Product Stewardship Market - Revenue and Forecast to 2031 (US$ Million)
- 7.2.3 Cloud
- 7.2.3.1 Overview
- 7.2.3.2 Cloud: Product Stewardship Market - Revenue and Forecast to 2031 (US$ Million)
- 7.2.4 On Premises
- 7.2.4.1 Overview
- 7.2.4.2 On Premises: Product Stewardship Market - Revenue and Forecast to 2031 (US$ Million)
8. North America Product Stewardship Market Analysis - by Organization Size
- 8.1 Large Enterprises
- 8.1.1 Overview
- 8.1.2 Large Enterprises: Product Stewardship Market - Revenue and Forecast to 2031 (US$ Million)
- 8.2 SMEs
- 8.2.1 Overview
- 8.2.2 SMEs: Product Stewardship Market - Revenue and Forecast to 2031 (US$ Million)
9. North America Product Stewardship Market - Country Analysis
- 9.1 North America
- 9.1.1 North America: Product Stewardship Market Breakdown, by Key Countries, 2023 and 2031 (%)
- 9.1.1.1 North America: Product Stewardship Market - Revenue and Forecast Analysis - by Country
- 9.1.1.2 United States: Product Stewardship Market - Revenue and Forecast to 2031 (US$ Million)
- 9.1.1.2.1 United States: Product Stewardship Market Breakdown, by Component
- 9.1.1.2.2 United States: Product Stewardship Market Breakdown, by Deployment
- 9.1.1.2.3 United States: Product Stewardship Market Breakdown, by Organization Size
- 9.1.1.3 Canada: Product Stewardship Market - Revenue and Forecast to 2031 (US$ Million)
- 9.1.1.3.1 Canada: Product Stewardship Market Breakdown, by Component
- 9.1.1.3.2 Canada: Product Stewardship Market Breakdown, by Deployment
- 9.1.1.3.3 Canada: Product Stewardship Market Breakdown, by Organization Size
- 9.1.1.4 Mexico: Product Stewardship Market - Revenue and Forecast to 2031 (US$ Million)
- 9.1.1.4.1 Mexico: Product Stewardship Market Breakdown, by Component
- 9.1.1.4.2 Mexico: Product Stewardship Market Breakdown, by Deployment
- 9.1.1.4.3 Mexico: Product Stewardship Market Breakdown, by Organization Size
- 9.1.1 North America: Product Stewardship Market Breakdown, by Key Countries, 2023 and 2031 (%)
10. Competitive Landscape
- 10.1 Heat Map Analysis by Key Players
- 10.2 Company Positioning & Concentration
11. Industry Landscape
- 11.1 Overview
- 11.2 Market Initiative
- 11.3 Merger and Acquisition
- 11.2 New Product Development
12. Company Profiles
- 12.1 Eaton Corp Plc
- 12.1.1 Key Facts
- 12.1.2 Business Description
- 12.1.3 Products and Services
- 12.1.4 Financial Overview
- 12.1.5 SWOT Analysis
- 12.1.6 Key Developments
- 12.2 Anthesis Group Ltd
- 12.2.1 Key Facts
- 12.2.2 Business Description
- 12.2.3 Products and Services
- 12.2.4 Financial Overview
- 12.2.5 SWOT Analysis
- 12.2.6 Key Developments
- 12.3 CGI Inc
- 12.3.1 Key Facts
- 12.3.2 Business Description
- 12.3.3 Products and Services
- 12.3.4 Financial Overview
- 12.3.5 SWOT Analysis
- 12.3.6 Key Developments
- 12.4 ERM Group, Inc.
- 12.4.1 Key Facts
- 12.4.2 Business Description
- 12.4.3 Products and Services
- 12.4.4 Financial Overview
- 12.4.5 SWOT Analysis
- 12.4.6 Key Developments
- 12.5 Wolters Kluwer NV
- 12.5.1 Key Facts
- 12.5.2 Business Description
- 12.5.3 Products and Services
- 12.5.4 Financial Overview
- 12.5.5 SWOT Analysis
- 12.5.6 Key Developments
- 12.6 Intelex Technologies ULC
- 12.6.1 Key Facts
- 12.6.2 Business Description
- 12.6.3 Products and Services
- 12.6.4 Financial Overview
- 12.6.5 SWOT Analysis
- 12.6.6 Key Developments
- 12.7 SAP SE
- 12.7.1 Key Facts
- 12.7.2 Business Description
- 12.7.3 Products and Services
- 12.7.4 Financial Overview
- 12.7.5 SWOT Analysis
- 12.7.6 Key Developments
- 12.8 Sphera Solutions, Inc.
- 12.8.1 Key Facts
- 12.8.2 Business Description
- 12.8.3 Products and Services
- 12.8.4 Financial Overview
- 12.8.5 SWOT Analysis
- 12.8.6 Key Developments
- 12.9 Covestro AG
- 12.9.1 Key Facts
- 12.9.2 Business Description
- 12.9.3 Products and Services
- 12.9.4 Financial Overview
- 12.9.5 SWOT Analysis
- 12.9.6 Key Developments
- 12.10 Linde Plc
- 12.10.1 Key Facts
- 12.10.2 Business Description
- 12.10.3 Products and Services
- 12.10.4 Financial Overview
- 12.10.5 SWOT Analysis
- 12.10.6 Key Developments
- 12.11 Arcadis NV
- 12.11.1 Key Facts
- 12.11.2 Business Description
- 12.11.3 Products and Services
- 12.11.4 Financial Overview
- 12.11.5 SWOT Analysis
- 12.11.6 Key Developments
- 12.12 3E
- 12.12.1 Key Facts
- 12.12.2 Business Description
- 12.12.3 Products and Services
- 12.12.4 Financial Overview
- 12.12.5 SWOT Analysis
- 12.12.6 Key Developments
- 12.13 Benchmark Digital Partners LLC
- 12.13.1 Key Facts
- 12.13.2 Business Description
- 12.13.3 Products and Services
- 12.13.4 Financial Overview
- 12.13.5 SWOT Analysis
- 12.13.6 Key Developments
- 12.14 UL LLC
- 12.14.1 Key Facts
- 12.14.2 Business Description
- 12.14.3 Products and Services
- 12.14.4 Financial Overview
- 12.14.5 SWOT Analysis
- 12.14.6 Key Developments
- 12.15 Pace Analytical Services
- 12.15.1 Key Facts
- 12.15.2 Business Description
- 12.15.3 Products and Services
- 12.15.4 Financial Overview
- 12.15.5 SWOT Analysis
- 12.15.6 Key Developments
- 12.16 DuPont de Nemours Inc
- 12.16.1 Key Facts
- 12.16.2 Business Description
- 12.16.3 Products and Services
- 12.16.4 Financial Overview
- 12.16.5 SWOT Analysis
- 12.16.6 Key Developments
- 12.17 knoell
- 12.17.1 Key Facts
- 12.17.2 Business Description
- 12.17.3 Products and Services
- 12.17.4 Financial Overview
- 12.17.5 SWOT Analysis
- 12.17.6 Key Developments
- 12.18 Young & Global Partners
- 12.18.1 Key Facts
- 12.18.2 Business Description
- 12.18.3 Products and Services
- 12.18.4 Financial Overview
- 12.18.5 SWOT Analysis
- 12.18.6 Key Developments
- 12.19 Yordas Limited
- 12.19.1 Key Facts
- 12.19.2 Business Description
- 12.19.3 Products and Services
- 12.19.4 Financial Overview
- 12.19.5 SWOT Analysis
- 12.19.6 Key Developments
- 12.20 Phylmar Group
- 12.20.1 Key Facts
- 12.20.2 Business Description
- 12.20.3 Products and Services
- 12.20.4 Financial Overview
- 12.20.5 SWOT Analysis
- 12.20.6 Key Developments
13. Appendix
- 13.1 Word Index
- 13.2 About The Insight Partners


