|
|
市場調査レポート
商品コード
1764891
北米の緑内障治療薬市場の予測 (2031年まで) - 地域別分析 (薬剤クラス別、適応症別、流通チャネル別)North America Glaucoma Therapeutics Market Forecast to 2031 - Regional Analysis - by Drug Class, Indication, and Distribution Channel |
||||||
|
|||||||
| 北米の緑内障治療薬市場の予測 (2031年まで) - 地域別分析 (薬剤クラス別、適応症別、流通チャネル別) |
|
出版日: 2025年04月14日
発行: The Insight Partners
ページ情報: 英文 132 Pages
納期: 即納可能
|
全表示
- 概要
- 図表
- 目次
北米の緑内障治療薬市場は、2023年に26億3,452万米ドルと評価され、2031年には34億2,164万米ドルに達すると予測され、2023年から2031年までのCAGRは3.3%と推定されます。
緑内障疾患の増加により北米の緑内障治療薬市場が活性化
緑内障は、視神経の損傷によって引き起こされる眼疾患で、最終的には全盲に至る可能性があります。緑内障患者は神経組織が徐々に失われ、放置すると視力障害や失明に至る可能性があります。緑内障の患者は世界中で大幅に増加しています。緑内障研究財団によると、2040年までに世界中で推定2,200万人が緑内障により失明するとされています。さらに、世界保健機関(WHO)によれば、緑内障は世界における失明の主要な原因であり、6,000万人以上が罹患し、約450万人が失明しています。2021年1月にAssociation for Research in Vision and Ophthalmology(ARVO)Journalに掲載された論文によると、メキシコの緑内障患者数は、2030年末には250万人、2040年末には300万人、2050年末には340万人に達すると推定されています。世界人口の緑内障患者数の増加に伴い、緑内障治療に対する需要は増加しています。この疾患を管理するための内科的および外科的処置は、眼圧(IOP)を下げることに重点を置いています。プロスタグランジンアナログは、眼からの排出を促進することで眼圧を効果的に下げるために広く推奨されている薬剤のひとつです。これらの製品は、その有効性と限られた副作用により、緑内障治療の主流となっています。
北米の緑内障治療薬市場の概要
人口問題研究所2019によると、米国の65歳以上の高齢者数は2018年の5,200万人(総人口の16%)から倍増し、2060年には9,500万人近く(総人口の23%)になると推定されています。米国眼科学会が2019年に実施した調査によると、米国では2050年までに70~75歳の732万人近くが原発開放隅角緑内障(POAG)に罹患すると推定されています。したがって、米国における緑内障治療薬市場の成長は、特に老人人口における眼疾患の有病率の増加が主な要因となっています。米国は北米の緑内障治療薬市場で最大のシェアを占めています。
各企業が採用する様々な有機的および無機的な成長戦略も、米国の緑内障治療薬市場の発展に大きく貢献しています。そのような成長戦略のいくつかを以下に挙げます。
2023年10月、Stuart TherapeuticsとGlaukosは、緑内障の神経保護を目的として設計されたStuart TherapeuticsのST-113薬剤候補に関するライセンス契約を締結しました。2022年8月、アルコンはAerie Pharmaceuticals, Inc.を買収しました。この買収は、アルコンの眼科用医薬品分野へのコミットメントを確認するものであり、より広範な医薬品の研究開発能力を追加することで、既存の商業的専門性を強化し、多様なポートフォリオの価値を最大化することが期待されます。北米の緑内障治療薬市場の収益と2031年までの予測(金額)
北米の緑内障治療薬:市場区分
北米の緑内障治療薬市場は、薬剤クラス別、適応症別、流通チャネル別、国別に分類されます。
薬剤クラス別では、北米の緑内障治療薬市場はβ遮断薬、αアドレナリン作動薬、プロスタグランジン類似体、炭酸脱水酵素阻害薬、併用薬、その他に区分されます。2023年には、プロスタグランジン類似体セグメントが最大の市場シェアを占めています。
適応症の観点から、北米緑内障治療薬市場は開放隅角緑内障、閉塞隅角緑内障、その他に分類されます。開放隅角緑内障セグメントが2023年に最大の市場シェアを占めました。
流通チャネル別では、北米の緑内障治療薬市場は病院薬局、小売薬局、オンライン薬局に分類されます。病院薬局セグメントが2023年に最大の市場シェアを占めました。
国別では、北米の緑内障治療薬市場は米国、カナダ、メキシコに区分されます。2023年の北米緑内障治療薬市場シェアは米国が独占。
Alcon AG、AbbVie Inc、Bausch &Lomb Inc、Fera Pharmaceuticals, LLC、Viatris Inc、Novartis AG、Sun Pharmaceutical Industries Ltd、Teva Pharmaceuticals Industries Ltd、Thea Pharma Inc、Santen Pharmaceutical Co., Ltd.は、北米の緑内障治療薬市場で事業を展開している主要企業です。
目次
第1章 イントロダクション
第2章 エグゼクティブサマリー
- 主要洞察
- 市場の魅力
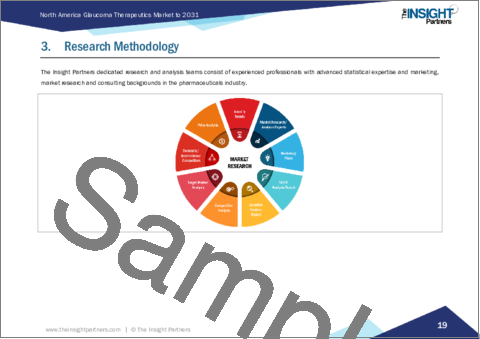
第3章 分析手法
- 二次調査
- 一次調査
- 仮説の策定
- マクロ経済要因分析
- 基礎数値の開発
- データの三角測量
- 国レベルのデータ
第4章 北米の緑内障治療薬市場の情勢
- 概観
- PEST分析
第5章 北米の緑内障治療薬市場:主な市場力学
- 緑内障治療薬市場:主な市場力学
- 市場促進要因
- 緑内障罹患率の増加
- 製品上市、提携、買収の増加
- 市場抑制要因
- 服薬コンプライアンスの問題
- 市場機会
- ウェアラブル技術の開発
- 今後の動向
- 新しいドラッグデリバリー法の開発
- 促進要因と抑制要因の影響
第6章 緑内障治療薬市場:北米市場の分析
- 緑内障治療薬市場の収益 (2021~2031年)
- 緑内障治療薬市場の予測・分析
第7章 北米の緑内障治療薬市場の分析:薬剤クラス別
- β遮断薬
- αアドレナリン作動薬
- プロスタグランジン類縁体
- 炭酸脱水酵素阻害薬
- 併用薬
- その他
第8章 北米の緑内障治療薬市場の分析:適応症別
- 開放隅角緑内障
- 閉塞隅角緑内障
- その他
第9章 北米の緑内障治療薬市場の分析:流通チャネル別
- 病院薬局
- 小売薬局
- オンライン薬局
第10章 北米の緑内障治療薬市場:国別分析
- 北米
- 米国
- カナダ
- メキシコ
第11章 緑内障治療薬市場:業界情勢
- 緑内障治療薬市場の成長戦略
- 有機的成長戦略
- 無機的成長戦略
第12章 企業プロファイル
- Alcon AG
- AbbVie Inc
- Bausch & Lomb Inc
- Fera Pharmaceuticals, LLC
- Viatris Inc
- Novartis AG
- Sun Pharmaceutical Industries Ltd
- Teva Pharmaceutical Industries Ltd
- Thea Pharma Inc
- Santen Pharmaceutical Co., Ltd.
第13章 付録
List Of Tables
- Table 1. North America Glaucoma Therapeutics Market Segmentation
- Table 2. Glaucoma Therapeutics Market - Revenue and Forecast to 2031 (US$ Million)
- Table 3. Glaucoma Therapeutics Market - Revenue and Forecast to 2031 (US$ Million) - by Drug Class
- Table 4. Glaucoma Therapeutics Market - Revenue and Forecast to 2031 (US$ Million) - by Indication
- Table 5. Glaucoma Therapeutics Market - Revenue and Forecast to 2031 (US$ Million) - by Distribution Channel
- Table 6. North America: Glaucoma Therapeutics Market - Revenue and Forecast to 2031 (US$ Million) - by Country
- Table 7. United States: Glaucoma Therapeutics Market - Revenue and Forecast to 2031 (US$ Million) - by Drug Class
- Table 8. United States: Glaucoma Therapeutics Market - Revenue and Forecast to 2031 (US$ Million) - by Indication
- Table 9. United States: Glaucoma Therapeutics Market - Revenue and Forecast to 2031 (US$ Million) - by Distribution Channel
- Table 10. Canada: Glaucoma Therapeutics Market - Revenue and Forecast to 2031 (US$ Million) - by Drug Class
- Table 11. Canada: Glaucoma Therapeutics Market - Revenue and Forecast to 2031 (US$ Million) - by Indication
- Table 12. Canada: Glaucoma Therapeutics Market - Revenue and Forecast to 2031 (US$ Million) - by Distribution Channel
- Table 13. Mexico: Glaucoma Therapeutics Market - Revenue and Forecast to 2031 (US$ Million) - by Drug Class
- Table 14. Mexico: Glaucoma Therapeutics Market - Revenue and Forecast to 2031 (US$ Million) - by Indication
- Table 15. Mexico: Glaucoma Therapeutics Market - Revenue and Forecast to 2031 (US$ Million) - by Distribution Channel
- Table 16. Recent Organic Growth Strategies in Glaucoma Therapeutics Market
- Table 17. Recent Inorganic Growth Strategies in the Glaucoma Therapeutics Market
- Table 18. Glossary of Terms
List Of Figures
- Figure 1. North America Glaucoma Therapeutics Market Segmentation, by Country
- Figure 2. PEST Analysis
- Figure 3. Glaucoma Therapeutics Market - Key Market Dynamics
- Figure 4. Impact Analysis of Drivers and Restraints
- Figure 5. Glaucoma Therapeutics Market Revenue (US$ Million), 2021-2031
- Figure 6. Glaucoma Therapeutics Market Share (%) - by Drug Class (2023 and 2031)
- Figure 7. Beta Blockers: Glaucoma Therapeutics Market - Revenue and Forecast to 2031 (US$ Million)
- Figure 8. Alpha Adrenergic Agonists: Glaucoma Therapeutics Market - Revenue and Forecast to 2031 (US$ Million)
- Figure 9. Prostaglandins Analogues: Glaucoma Therapeutics Market - Revenue and Forecast to 2031 (US$ Million)
- Figure 10. Carbonic Anhydrase Inhibitors: Glaucoma Therapeutics Market - Revenue and Forecast to 2031 (US$ Million)
- Figure 11. Combination Drugs: Glaucoma Therapeutics Market - Revenue and Forecast to 2031 (US$ Million)
- Figure 12. Others: Glaucoma Therapeutics Market - Revenue and Forecast to 2031 (US$ Million)
- Figure 13. Glaucoma Therapeutics Market Share (%) - by Indication (2023 and 2031)
- Figure 14. Open Angle Glaucoma: Glaucoma Therapeutics Market - Revenue and Forecast to 2031 (US$ Million)
- Figure 15. Angle Closure Glaucoma: Glaucoma Therapeutics Market - Revenue and Forecast to 2031 (US$ Million)
- Figure 16. Others: Glaucoma Therapeutics Market - Revenue and Forecast to 2031 (US$ Million)
- Figure 17. Glaucoma Therapeutics Market Share (%) - by Distribution Channel (2023 and 2031)
- Figure 18. Hospital Pharmacy: Glaucoma Therapeutics Market - Revenue and Forecast to 2031 (US$ Million)
- Figure 19. Retail Pharmacy: Glaucoma Therapeutics Market - Revenue and Forecast to 2031 (US$ Million)
- Figure 20. Online Pharmacy: Glaucoma Therapeutics Market - Revenue and Forecast to 2031 (US$ Million)
- Figure 21. North America Glaucoma Therapeutics Market, by Key Country - Revenue (2023) (US$ Million)
- Figure 22. North America: Glaucoma Therapeutics Market Breakdown, by Key Countries, 2023 and 2031 (%)
- Figure 23. United States: Glaucoma Therapeutics Market - Revenue and Forecast to 2031 (US$ Million)
- Figure 24. Canada: Glaucoma Therapeutics Market - Revenue and Forecast to 2031 (US$ Million)
- Figure 25. Mexico: Glaucoma Therapeutics Market - Revenue and Forecast to 2031 (US$ Million)
- Figure 26. Growth Strategies in Glaucoma Therapeutics Market
The North America glaucoma therapeutics market was valued at US$ 2,634.52 million in 2023 and is expected to reach US$ 3,421.64 million by 2031; it is estimated to register a CAGR of 3.3% from 2023 to 2031.
Mounting Incidence of Glaucoma Disease Fuels North America Glaucoma Therapeutics Market
Glaucoma is an eye disorder caused due to the damaged optic nerve, which can eventually lead to total blindness. Glaucoma patients may experience a gradual loss of nerve tissue, resulting in vision impairment or blindness if left untreated. Glaucoma cases are increasing significantly across the world. As per the Glaucoma Research Foundation, an estimated 22 million people worldwide would attain blindness due to glaucoma by 2040. Further, Glaucoma is a leading cause of blindness worldwide, affecting over 60 million people and leading to approximately 4.5 million cases of blindness, according to the World Health Organization. According to estimates provided in an article published in the Association for Research in Vision and Ophthalmology (ARVO) Journal in January 2021, the number of people suffering from glaucoma in Mexico would reach 2.5 million, 3 million, and 3.4 million by the end of 2030, 2040, and 2050, respectively. The demand for glaucoma treatments is increasing with the rising number of glaucoma cases in the global population. Medical and surgical procedures meant to manage this disease focus on lowering intraocular pressure (IOP). Prostaglandin analogs are among the drugs widely recommended for effectively reducing IOP by promoting better drainage from the eye. These products have been mainstream glaucoma treatment due to their efficacy and limited adverse effects.
North America Glaucoma Therapeutics Market Overview
As per the Population Reference Bureau 2019, the number of individuals aged 65 and above in the US is estimated to double from 52 million (16% of the total population) in 2018 to nearly 95 million (23% of the total population) by 2060. A study conducted by the American Academy of Ophthalmology in 2019 states that nearly 7.32 million people aged 70-75 is estimated to be affected by primary open-angle glaucoma (POAG) in the US by 2050. Thus, the glaucoma therapeutics market growth in the US is primarily driven by the increasing prevalence of eye diseases, especially in the geriatric population. The US accounts for the largest share of the glaucoma therapeutics market in North America.
Various organic and inorganic growth strategies adopted by market players also contribute notably to the glaucoma therapeutics market progress in the US. A few of such growth strategies are mentioned below.
In October 2023, Stuart Therapeutics and Glaukos signed a license agreement for Stuart Therapeutics' ST-113 drug candidate designed for neuroprotection in glaucoma. In August 2022, Alcon acquired Aerie Pharmaceuticals, Inc. This transaction confirms Alcon's commitment to the ophthalmic pharmaceutical space, and it is expected to enhance its existing commercial expertise by adding broader pharmaceutical R&D capabilities, thereby maximizing the value of its diversified portfolio. North America Glaucoma Therapeutics Market Revenue and Forecast to 2031 (US$ Million)
North America Glaucoma Therapeutics Market Segmentation
The North America glaucoma therapeutics market is categorized into drug class, indication, distribution channel, and country.
Based on drug class, the North America glaucoma therapeutics market is segmented into beta blockers, alpha adrenergic agonists, prostaglandins analogues, carbonic anhydrase inhibitors, combination drugs, and others. The prostaglandins analogues segment held the largest market share in 2023.
In terms of indication, the North America glaucoma therapeutics market is categorized into open angle glaucoma, angle closure glaucoma, and others. The open angle glaucoma segment held the largest market share in 2023.
By distribution channel, the North America glaucoma therapeutics market is segmented into hospital pharmacy, retail pharmacy, and online pharmacy. The hospital pharmacy segment held the largest market share in 2023.
By country, the North America glaucoma therapeutics market is segmented into the US, Canada, and Mexico. The US dominated the North America glaucoma therapeutics market share in 2023.
Alcon AG, AbbVie Inc, Bausch & Lomb Inc, Fera Pharmaceuticals, LLC, Viatris Inc, Novartis AG, Sun Pharmaceutical Industries Ltd, Teva Pharmaceuticals Industries Ltd, Thea Pharma Inc, and Santen Pharmaceutical Co., Ltd. are among the leading companies operating in the North America glaucoma therapeutics market.
Table Of Contents
1. Introduction
- 1.1 The Insight Partners Research Report Guidance
- 1.2 Market Segmentation
2. Executive Summary
- 2.1 Key Insights
- 2.2 Market Attractiveness
3. Research Methodology
- 3.1 Secondary Research
- 3.2 Primary Research
- 3.2.1 Hypothesis formulation:
- 3.2.2 Macro-economic factor analysis:
- 3.2.3 Developing base number:
- 3.2.4 Data Triangulation:
- 3.2.5 Country level data:
4. North America Glaucoma Therapeutics Market Landscape
- 4.1 Overview
- 4.2 PEST Analysis
5. North America Glaucoma Therapeutics Market - Key Market Dynamics
- 5.1 Market Drivers
- 5.1.1 Mounting Incidence of Glaucoma Disease
- 5.1.2 Increasing Number of Product Launches, Collaborations, and Acquisitions
- 5.2 Market Restraints
- 5.2.1 Medication Regimen Compliance Issues
- 5.3 Market Opportunities
- 5.3.1 Development of Wearable Technologies
- 5.4 Future Trends
- 5.4.1 Development of Novel Drug Delivery Methods
- 5.5 Impact of Drivers and Restraints:
6. Glaucoma Therapeutics Market - North America Analysis
- 6.1 Glaucoma Therapeutics Market Revenue (US$ Million), 2021-2031
- 6.2 Glaucoma Therapeutics Market Forecast Analysis
7. North America Glaucoma Therapeutics Market Analysis - by Drug Class
- 7.1 Beta Blockers
- 7.1.1 Overview
- 7.1.2 Beta Blockers: Glaucoma Therapeutics Market - Revenue and Forecast to 2031 (US$ Million)
- 7.2 Alpha Adrenergic Agonists
- 7.2.1 Overview
- 7.2.2 Alpha Adrenergic Agonists: Glaucoma Therapeutics Market - Revenue and Forecast to 2031 (US$ Million)
- 7.3 Prostaglandins Analogues
- 7.3.1 Overview
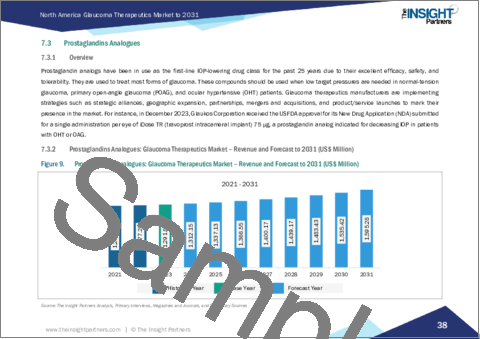
- 7.3.2 Prostaglandins Analogues: Glaucoma Therapeutics Market - Revenue and Forecast to 2031 (US$ Million)
- 7.4 Carbonic Anhydrase Inhibitors
- 7.4.1 Overview
- 7.4.2 Carbonic Anhydrase Inhibitors: Glaucoma Therapeutics Market - Revenue and Forecast to 2031 (US$ Million)
- 7.5 Combination Drugs
- 7.5.1 Overview
- 7.5.2 Combination Drugs: Glaucoma Therapeutics Market - Revenue and Forecast to 2031 (US$ Million)
- 7.6 Others
- 7.6.1 Overview
- 7.6.2 Others: Glaucoma Therapeutics Market - Revenue and Forecast to 2031 (US$ Million)
8. North America Glaucoma Therapeutics Market Analysis - by Indication
- 8.1 Open Angle Glaucoma
- 8.1.1 Overview
- 8.1.2 Open Angle Glaucoma: Glaucoma Therapeutics Market - Revenue and Forecast to 2031 (US$ Million)
- 8.2 Angle Closure Glaucoma
- 8.2.1 Overview
- 8.2.2 Angle Closure Glaucoma: Glaucoma Therapeutics Market - Revenue and Forecast to 2031 (US$ Million)
- 8.3 Others
- 8.3.1 Overview
- 8.3.2 Others: Glaucoma Therapeutics Market - Revenue and Forecast to 2031 (US$ Million)
9. North America Glaucoma Therapeutics Market Analysis - by Distribution Channel
- 9.1 Hospital Pharmacy
- 9.1.1 Overview
- 9.1.2 Hospital Pharmacy: Glaucoma Therapeutics Market - Revenue and Forecast to 2031 (US$ Million)
- 9.2 Retail Pharmacy
- 9.2.1 Overview
- 9.2.2 Retail Pharmacy: Glaucoma Therapeutics Market - Revenue and Forecast to 2031 (US$ Million)
- 9.3 Online Pharmacy
- 9.3.1 Overview
- 9.3.2 Online Pharmacy: Glaucoma Therapeutics Market - Revenue and Forecast to 2031 (US$ Million)
10. North America Glaucoma Therapeutics Market - Country Analysis
- 10.1 North America
- 10.1.1 North America: Glaucoma Therapeutics Market Breakdown, by Key Country, 2023 and 2031 (%)
- 10.1.1.1 North America: Glaucoma Therapeutics Market - Revenue and Forecast Analysis - by Country
- 10.1.1.2 United States: Glaucoma Therapeutics Market - Revenue and Forecast to 2031 (US$ Million)
- 10.1.1.2.1 United States: Glaucoma Therapeutics Market Breakdown, by Drug Class
- 10.1.1.2.2 United States: Glaucoma Therapeutics Market Breakdown, by Indication
- 10.1.1.2.3 United States: Glaucoma Therapeutics Market Breakdown, by Distribution Channel
- 10.1.1.3 Canada: Glaucoma Therapeutics Market - Revenue and Forecast to 2031 (US$ Million)
- 10.1.1.3.1 Canada: Glaucoma Therapeutics Market Breakdown, by Drug Class
- 10.1.1.3.2 Canada: Glaucoma Therapeutics Market Breakdown, by Indication
- 10.1.1.3.3 Canada: Glaucoma Therapeutics Market Breakdown, by Distribution Channel
- 10.1.1.4 Mexico: Glaucoma Therapeutics Market - Revenue and Forecast to 2031 (US$ Million)
- 10.1.1.4.1 Mexico: Glaucoma Therapeutics Market Breakdown, by Drug Class
- 10.1.1.4.2 Mexico: Glaucoma Therapeutics Market Breakdown, by Indication
- 10.1.1.4.3 Mexico: Glaucoma Therapeutics Market Breakdown, by Distribution Channel
- 10.1.1 North America: Glaucoma Therapeutics Market Breakdown, by Key Country, 2023 and 2031 (%)
11. Glaucoma Therapeutics Market - Industry Landscape
- 11.1 Growth Strategies in Glaucoma Therapeutics Market
- 11.2 Organic Growth Strategies
- 11.2.1 Overview
- 11.3 Inorganic Growth Strategies
- 11.3.1 Overview
12. Company Profiles
- 12.1 Alcon AG
- 12.1.1 Key Facts
- 12.1.2 Business Description
- 12.1.3 Products and Services
- 12.1.4 Financial Overview
- 12.1.5 SWOT Analysis
- 12.1.6 Key Developments
- 12.2 AbbVie Inc
- 12.2.1 Key Facts
- 12.2.2 Business Description
- 12.2.3 Products and Services
- 12.2.4 Financial Overview
- 12.2.5 SWOT Analysis
- 12.2.6 Key Developments
- 12.3 Bausch & Lomb Inc
- 12.3.1 Key Facts
- 12.3.2 Business Description
- 12.3.3 Products and Services
- 12.3.4 Financial Overview
- 12.3.5 SWOT Analysis
- 12.3.6 Key Developments
- 12.4 Fera Pharmaceuticals, LLC
- 12.4.1 Key Facts
- 12.4.2 Business Description
- 12.4.3 Products and Services
- 12.4.4 Financial Overview
- 12.4.5 SWOT Analysis
- 12.4.6 Key Developments
- 12.5 Viatris Inc
- 12.5.1 Key Facts
- 12.5.2 Business Description
- 12.5.3 Products and Services
- 12.5.4 Financial Overview
- 12.5.5 SWOT Analysis
- 12.5.6 Key Developments
- 12.6 Novartis AG
- 12.6.1 Key Facts
- 12.6.2 Business Description
- 12.6.3 Products and Services
- 12.6.4 Financial Overview
- 12.6.5 SWOT Analysis
- 12.6.6 Key Developments
- 12.7 Sun Pharmaceutical Industries Ltd
- 12.7.1 Key Facts
- 12.7.2 Business Description
- 12.7.3 Products and Services
- 12.7.4 Financial Overview
- 12.7.5 SWOT Analysis
- 12.7.6 Key Developments
- 12.8 Teva Pharmaceutical Industries Ltd
- 12.8.1 Key Facts
- 12.8.2 Business Description
- 12.8.3 Products and Services
- 12.8.4 Financial Overview
- 12.8.5 SWOT Analysis
- 12.8.6 Key Developments
- 12.9 Thea Pharma Inc
- 12.9.1 Key Facts
- 12.9.2 Business Description
- 12.9.3 Products and Services
- 12.9.4 Financial Overview
- 12.9.5 SWOT Analysis
- 12.9.6 Key Developments
- 12.10 Santen Pharmaceutical Co., Ltd.
- 12.10.1 Key Facts
- 12.10.2 Business Description
- 12.10.3 Products and Services
- 12.10.4 Financial Overview
- 12.10.5 SWOT Analysis
- 12.10.6 Key Developments
13. Appendix
- 13.1 About The Insight Partners
- 13.2 Glossary of Terms


