|
|
市場調査レポート
商品コード
1646505
刃先交換式インサート:市場規模と予測 (2021~2031年)、世界・地域シェア、動向、成長機会 - 分析範囲 (インサートの形状別、用途別、サイズ別、インサートの材料別、産業別、地域別)Indexable Inserts Market Size and Forecast 2021-2031, Global and Regional Share, Trend, and Growth Opportunity Analysis Report Coverage: By Insert Shape, Application, Size, Insert Material, Industry, and Geography |
||||||

|
|||||||
|
|||||||

| 刃先交換式インサート:市場規模と予測 (2021~2031年)、世界・地域シェア、動向、成長機会 - 分析範囲 (インサートの形状別、用途別、サイズ別、インサートの材料別、産業別、地域別) |
|
出版日: 2024年12月23日
発行: The Insight Partners
ページ情報: 英文 433 Pages
納期: 即納可能
|

全表示
- 概要
- 図表
- 目次
刃先交換式インサートの市場規模は、2023年に90億2,000万米ドルで、2031年には145億7,000万米ドルに達すると予測され、2023年から2031年までのCAGRは6.2%を記録すると予測されています。
刃先交換式インサート市場は、北米、欧州、アジア太平洋 (APAC)、中東・アフリカ (MEA)、南米の主要5地域に区分されます。2023年はアジア太平洋が市場を独占し、欧州、北米がそれぞれ続く。アジア太平洋地域の刃先交換式インサート市場は、オーストラリア、中国、日本、韓国、インド、その他アジア太平洋地域に区分されます。この地域は、インド、中国、タイ、ベトナム、シンガポール、台湾、ニュージーランドなどの新興経済諸国で構成されています。これらの国々では、高度な製造技術の採用が徐々に増加しています。さらに、低い人件費、低い税金と関税、強力なビジネス・エコシステムが利用可能なため、製造業界の国際的な企業がこの地域で生産施設を拡大するよう誘致されています。2022年11月、Kennametal Inc.はインドのベンガルールに新しい金属切削インサート製造施設を開設すると発表しました。この戦略的開発により、同社はアジア太平洋の刃先交換式インサート市場の需要拡大に対応する能力と生産能力の強化を目指します。
さらに、自動化とデジタル化の進展がアジア太平洋地域の近代化・標準化された製造業の成長を後押ししており、金属加工機械と切削工具の需要に拍車がかかると予想されます。このように、アジア太平洋地域における製造業の成長は、金属加工機械と切削工具に主要な有利な機会を提供し、それによって今後数年間の刃先交換式インサート市場の成長を促進すると予測されます。さらに、エレクトロニクス、電気自動車、航空、製造、その他の産業の急成長は、上記の産業におけるねじ切り、切断、溝加工、その他の作業における切削工具の需要を促進すると予測されています。
世界鉄鋼協会 (World Steel Association-AISBL) によると、中国は2023年に10億1,910万トンの生産量で世界最大の鉄鋼生産国となりました。中国には、江龍集団、中国宝武集団、沙鋼集団、首鋼集団など、金属生産産業の主要企業が本社を構えており、金属生産産業の成長に大きく貢献しています。世界中のさまざまな企業が、輸送コストを削減し輸入手続きを容易にするため、中国の金属製造業に近接した場所で金属加工能力を拡大することに注力しています。したがって、中国における金属製造業の成長は、刃先交換式インサートなどの切削工具を含む金属加工機械の需要を強化しています。
インサートの形状に基づき、世界の刃先交換式インサート市場は円形、正方形、三角形、菱形、その他に二分されます。菱形セグメントは、アルミニウム合金ベースの製品の粗加工と仕上げのために、菱形刃先交換式インサートの加工や切削の利用が増加しているため、2023年のチップ形状で市場を独占しました。アルミニウム部品は、航空宇宙、自動車、重工業、エレクトロニクス、半導体など様々な産業で使用されており、それぞれの用途にアルミニウム合金が使用されています。さらに、さまざまな産業でアルミニウム/アルミニウム合金ベースの製品の採用が増加していることが、菱形セグメントの刃先交換式インサート市場の成長を促進する主な要因の1つです。さらに、三角形刃先交換式インサートは、旋削、フェーシング、中ぐり、倣い旋削、単純な成形などの加工に使用されます。様々なリード角のツールホルダーが存在します。三角形は、6つの切れ刃を持つため、費用対効果が高いです。また、T型チップは、ボーリングバーのポケットにしっかりと挿入され、チップとワーク内径の間のサイドクリアランスが大きいため、切りくず詰まりの可能性を最小限に抑えることができるため、一般的なボーリング加工に最適です。しかし、60°エッジを使用した加工は、80°ダイヤモンドチップを使用した加工ほど強くはなりません。
Sandvik AB、Kennametal Inc.、Iscar Ltd.、Paul Horn GmBH、Kyocera Corporation、Ingersoll、Zhuzhou Cemented Carbide Cutting Tools Co., Ltd.、MITSUBISHI MATERIALS Corporation、Guhring, Inc.、YG-1 Co., Ltd.、Ceratizit GroupBoehlerit GmbH &Co.KGが、刃先交換式インサートの市場調査でプロファイルされている主要な企業です。
全体的な刃先交換式インサートの市場規模は、一次情報と二次情報の両方を用いて導き出されています。徹底的な二次調査は、刃先交換式インサートの市場規模に関連する質的・量的情報を得るために、社内外の情報源を用いて実施しました。このプロセスは、すべての市場セグメントに関する市場の概要と予測を得るのにも役立ちます。また、データを検証し分析的洞察を得るために、業界関係者に複数の一次インタビューを実施しました。このプロセスには、副社長、市場開拓マネージャー、マーケットインテリジェンスマネージャー、国内営業マネージャーなどの業界専門家と、刃先交換式インサート市場を専門とする評価専門家、研究アナリスト、キーオピニオンリーダーなどの外部コンサルタントが参加しています。
目次
第1章 イントロダクション
第2章 エグゼクティブサマリー
- 主要洞察
- 市場の魅力
第3章 分析手法
- 二次調査
- 一次調査
- 仮説の策定
- マクロ経済要因分析
- 基礎数値の開発
- データの三角測量
- 国レベルのデータ
第4章 刃先交換式インサート市場情勢
- PEST分析
- エコシステム分析
- バリューチェーンのベンダー一覧
第5章 刃先交換式インサート市場:主な市場力学
- 刃先交換式インサート市場:主な市場力学
- 市場促進要因
- 金属加工・機械加工用途での使用の増加
- 産業用途における刃先交換式工具の需要増加
- 軍事インフラの開発と強化に対する政府支出の増加
- 市場抑制要因
- 原材料価格の変動
- 市場機会
- 製造オペレーションの技術進歩
- 今後の動向
- 先端コーティングと材料の活用による刃先交換式インサートの性能向上への取り組みの増加
- 促進要因と抑制要因の影響
第6章 刃先交換式インサート市場:世界市場分析
- 刃先交換式インサート市場の売上高 (2021~2031年)
- 刃先交換式インサート市場予測分析
第7章 刃先交換式インサート市場の分析:インサートの形状別
- 丸型
- 正方形
- 三角形
- 菱形
- その他
第8章 刃先交換式インサート市場の分析:用途別
- フライス加工
- ドリル加工
- 旋削
- ねじ切り
- その他
第9章 刃先交換式インサート市場の分析:サイズ別
- 10mmまで
- -20 mm
- 20mm以上
第10章 刃先交換式インサート市場分析:インサートの材料別
- 超硬
- セラミックと複合材料
- PCDインサート
- その他
第11章 刃先交換式インサートの市場の分析:産業別
- 航空宇宙・防衛
- 一般工業
- 石油・ガス
- 発電
- 自動車
- 電気・電子
- 医療
- その他
第12章 刃先交換式インサート市場:地域別分析
- 北米
- 米国
- カナダ
- メキシコ
- 欧州
- ドイツ
- フランス
- イタリア
- 英国
- ロシア
- その他欧州
- アジア太平洋
- オーストラリア
- 中国
- インド
- 日本
- 韓国
- その他アジア太平洋
- 中東・アフリカ
- 南アフリカ
- サウジアラビア
- アラブ首長国連邦
- その他中東・アフリカ
- 中南米
- ブラジル
- アルゼンチン
- その他中南米
第13章 競合情勢
- ヒートマップ分析
- 企業のポジショニングと集中度
第14章 業界情勢
- 製品開発
第15章 企業プロファイル
- Sandvik AB
- Kennametal Inc
- ISCAR LTD
年間収益 (100万米ドル)
- SWOT分析
- 主な発展
- Hartmetall-Werkzeugfabrik Paul Horn GmbH
- 主要データ
- 事業内容
- 製品とサービス
- 財務概要
- SWOT分析
- 主な発展
- Kyocera Corporation
- 主要データ
- 事業内容
- 製品・サービス
- 財務概要
- SWOT分析
- 主な発展
- Ingersoll Rand Inc
- 主要データ
- 事業内容
- 製品とサービス
- 財務概要
- SWOT分析
- 主な発展
- Zhuzhou Cemented Carbide Cutting Tools Co., Ltd
- 主要データ
- 事業内容
- 製品とサービス
- 財務概要
- SWOT分析
- 主な発展
- Mitsubishi Materials Corporation
- 主要データ
- 事業内容
- 製品とサービス
- 財務概要
- SWOT分析
- 主な発展
- Guhring KG
- 主要データ
- 事業内容
- 製品とサービス
- 財務概要
- SWOT分析
- 主な発展
- YG-1 Co., Ltd.
- 主要データ
- 事業内容
- 製品とサービス
- 財務概要
- SWOT分析
- 主な発展
- CERATIZIT S.A.
- 主要データ
- 事業内容
- 製品とサービス
- 財務概要
- SWOT分析
- 主な発展
- Boehlerit GmbH & Co.KG
- 主要データ
- 事業内容
- 製品とサービス
- 財務概要
- SWOT分析
- 主な発展
第16章 付録
List Of Tables
- Table 1. Indexable Inserts Market Segmentation
- Table 2. List of Vendors
- Table 3. Military Expenditure of Major Countries (2020-2023)
- Table 4. Indexable Inserts Market - Revenue and Forecast to 2031 (US$ Million)
- Table 5. Indexable Inserts Market - Revenue and Forecast to 2031 (US$ Million) - by Insert Shape
- Table 6. Indexable Inserts Market - Revenue and Forecast to 2031 (US$ Million) - by Application
- Table 7. Indexable Inserts Market - Revenue and Forecast to 2031 (US$ Million) - by Size
- Table 8. Indexable Inserts Market - Revenue and Forecast to 2031 (US$ Million) - by Insert Material
- Table 9. Indexable Inserts Market - Revenue and Forecast to 2031 (US$ Million) - by Industry
- Table 10. North America: Indexable Inserts Market - Revenue and Forecast to 2031(US$ Million) - by Insert Shape
- Table 11. North America: Indexable Inserts Market - Revenue and Forecast to 2031(US$ Million) - by Application
- Table 12. North America: Indexable Inserts Market - Revenue and Forecast to 2031(US$ Million) - by Size
- Table 13. North America: Indexable Inserts Market - Revenue and Forecast to 2031(US$ Million) - by Insert Material
- Table 14. North America: Indexable Inserts Market - Revenue and Forecast to 2031(US$ Million) - by Industry
- Table 15. North America: Indexable Inserts Market - Revenue and Forecast to 2031(US$ Million) - by Country
- Table 16. United States: Indexable Inserts Market - Revenue and Forecast to 2031(US$ Million) - by Insert Shape
- Table 17. United States: Indexable Inserts Market - Revenue and Forecast to 2031(US$ Million) - by Application
- Table 18. United States: Indexable Inserts Market - Revenue and Forecast to 2031(US$ Million) - by Size
- Table 19. United States: Indexable Inserts Market - Revenue and Forecast to 2031(US$ Million) - by Insert Material
- Table 20. United States: Indexable Inserts Market - Revenue and Forecast to 2031(US$ Million) - by Industry
- Table 21. Canada: Indexable Inserts Market - Revenue and Forecast to 2031(US$ Million) - by Insert Shape
- Table 22. Canada: Indexable Inserts Market - Revenue and Forecast to 2031(US$ Million) - by Application
- Table 23. Canada: Indexable Inserts Market - Revenue and Forecast to 2031(US$ Million) - by Size
- Table 24. Canada: Indexable Inserts Market - Revenue and Forecast to 2031(US$ Million) - by Insert Material
- Table 25. Canada: Indexable Inserts Market - Revenue and Forecast to 2031(US$ Million) - by Industry
- Table 26. Mexico: Indexable Inserts Market - Revenue and Forecast to 2031(US$ Million) - by Insert Shape
- Table 27. Mexico: Indexable Inserts Market - Revenue and Forecast to 2031(US$ Million) - by Application
- Table 28. Mexico: Indexable Inserts Market - Revenue and Forecast to 2031(US$ Million) - by Size
- Table 29. Mexico: Indexable Inserts Market - Revenue and Forecast to 2031(US$ Million) - by Insert Material
- Table 30. Mexico: Indexable Inserts Market - Revenue and Forecast to 2031(US$ Million) - by Industry
- Table 31. Europe: Indexable Inserts Market - Revenue and Forecast to 2031(US$ Million) - by Insert Shape
- Table 32. Europe: Indexable Inserts Market - Revenue and Forecast to 2031(US$ Million) - by Application
- Table 33. Europe: Indexable Inserts Market - Revenue and Forecast to 2031(US$ Million) - by Size
- Table 34. Europe: Indexable Inserts Market - Revenue and Forecast to 2031(US$ Million) - by Insert Material
- Table 35. Europe: Indexable Inserts Market - Revenue and Forecast to 2031(US$ Million) - by Industry
- Table 36. Europe: Indexable Inserts Market - Revenue and Forecast to 2031(US$ Million) - by Country
- Table 37. Germany: Indexable Inserts Market - Revenue and Forecast to 2031(US$ Million) - by Insert Shape
- Table 38. Germany: Indexable Inserts Market - Revenue and Forecast to 2031(US$ Million) - by Application
- Table 39. Germany: Indexable Inserts Market - Revenue and Forecast to 2031(US$ Million) - by Size
- Table 40. Germany: Indexable Inserts Market - Revenue and Forecast to 2031(US$ Million) - by Insert Material
- Table 41. Germany: Indexable Inserts Market - Revenue and Forecast to 2031(US$ Million) - by Industry
- Table 42. France: Indexable Inserts Market - Revenue and Forecast to 2031(US$ Million) - by Insert Shape
- Table 43. France: Indexable Inserts Market - Revenue and Forecast to 2031(US$ Million) - by Application
- Table 44. France: Indexable Inserts Market - Revenue and Forecast to 2031(US$ Million) - by Size
- Table 45. France: Indexable Inserts Market - Revenue and Forecast to 2031(US$ Million) - by Insert Material
- Table 46. France: Indexable Inserts Market - Revenue and Forecast to 2031(US$ Million) - by Industry
- Table 47. Italy: Indexable Inserts Market - Revenue and Forecast to 2031(US$ Million) - by Insert Shape
- Table 48. Italy: Indexable Inserts Market - Revenue and Forecast to 2031(US$ Million) - by Application
- Table 49. Italy: Indexable Inserts Market - Revenue and Forecast to 2031(US$ Million) - by Size
- Table 50. Italy: Indexable Inserts Market - Revenue and Forecast to 2031(US$ Million) - by Insert Material
- Table 51. Italy: Indexable Inserts Market - Revenue and Forecast to 2031(US$ Million) - by Industry
- Table 52. United Kingdom: Indexable Inserts Market - Revenue and Forecast to 2031(US$ Million) - by Insert Shape
- Table 53. United Kingdom: Indexable Inserts Market - Revenue and Forecast to 2031(US$ Million) - by Application
- Table 54. United Kingdom: Indexable Inserts Market - Revenue and Forecast to 2031(US$ Million) - by Size
- Table 55. United Kingdom: Indexable Inserts Market - Revenue and Forecast to 2031(US$ Million) - by Insert Material
- Table 56. United Kingdom: Indexable Inserts Market - Revenue and Forecast to 2031(US$ Million) - by Industry
- Table 57. Russia: Indexable Inserts Market - Revenue and Forecast to 2031(US$ Million) - by Insert Shape
- Table 58. Russia: Indexable Inserts Market - Revenue and Forecast to 2031(US$ Million) - by Application
- Table 59. Russia: Indexable Inserts Market - Revenue and Forecast to 2031(US$ Million) - by Size
- Table 60. Russia: Indexable Inserts Market - Revenue and Forecast to 2031(US$ Million) - by Insert Material
- Table 61. Russia: Indexable Inserts Market - Revenue and Forecast to 2031(US$ Million) - by Industry
- Table 62. Rest of Europe: Indexable Inserts Market - Revenue and Forecast to 2031(US$ Million) - by Insert Shape
- Table 63. Rest of Europe: Indexable Inserts Market - Revenue and Forecast to 2031(US$ Million) - by Application
- Table 64. Rest of Europe: Indexable Inserts Market - Revenue and Forecast to 2031(US$ Million) - by Size
- Table 65. Rest of Europe: Indexable Inserts Market - Revenue and Forecast to 2031(US$ Million) - by Insert Material
- Table 66. Rest of Europe: Indexable Inserts Market - Revenue and Forecast to 2031(US$ Million) - by Industry
- Table 67. Asia Pacific: Indexable Inserts Market - Revenue and Forecast to 2031(US$ Million) - by Insert Shape
- Table 68. Asia Pacific: Indexable Inserts Market - Revenue and Forecast to 2031(US$ Million) - by Application
- Table 69. Asia Pacific: Indexable Inserts Market - Revenue and Forecast to 2031(US$ Million) - by Size
- Table 70. Asia Pacific: Indexable Inserts Market - Revenue and Forecast to 2031(US$ Million) - by Insert Material
- Table 71. Asia Pacific: Indexable Inserts Market - Revenue and Forecast to 2031(US$ Million) - by Industry
- Table 72. Asia Pacific: Indexable Inserts Market - Revenue and Forecast to 2031(US$ Million) - by Country
- Table 73. Australia: Indexable Inserts Market - Revenue and Forecast to 2031(US$ Million) - by Insert Shape
- Table 74. Australia: Indexable Inserts Market - Revenue and Forecast to 2031(US$ Million) - by Application
- Table 75. Australia: Indexable Inserts Market - Revenue and Forecast to 2031(US$ Million) - by Size
- Table 76. Australia: Indexable Inserts Market - Revenue and Forecast to 2031(US$ Million) - by Insert Material
- Table 77. Australia: Indexable Inserts Market - Revenue and Forecast to 2031(US$ Million) - by Industry
- Table 78. China: Indexable Inserts Market - Revenue and Forecast to 2031(US$ Million) - by Insert Shape
- Table 79. China: Indexable Inserts Market - Revenue and Forecast to 2031(US$ Million) - by Application
- Table 80. China: Indexable Inserts Market - Revenue and Forecast to 2031(US$ Million) - by Size
- Table 81. China: Indexable Inserts Market - Revenue and Forecast to 2031(US$ Million) - by Insert Material
- Table 82. China: Indexable Inserts Market - Revenue and Forecast to 2031(US$ Million) - by Industry
- Table 83. India: Indexable Inserts Market - Revenue and Forecast to 2031(US$ Million) - by Insert Shape
- Table 84. India: Indexable Inserts Market - Revenue and Forecast to 2031(US$ Million) - by Application
- Table 85. India: Indexable Inserts Market - Revenue and Forecast to 2031(US$ Million) - by Size
- Table 86. India: Indexable Inserts Market - Revenue and Forecast to 2031(US$ Million) - by Insert Material
- Table 87. India: Indexable Inserts Market - Revenue and Forecast to 2031(US$ Million) - by Industry
- Table 88. Japan: Indexable Inserts Market - Revenue and Forecast to 2031(US$ Million) - by Insert Shape
- Table 89. Japan: Indexable Inserts Market - Revenue and Forecast to 2031(US$ Million) - by Application
- Table 90. Japan: Indexable Inserts Market - Revenue and Forecast to 2031(US$ Million) - by Size
- Table 91. Japan: Indexable Inserts Market - Revenue and Forecast to 2031(US$ Million) - by Insert Material
- Table 92. Japan: Indexable Inserts Market - Revenue and Forecast to 2031(US$ Million) - by Industry
- Table 93. South Korea: Indexable Inserts Market - Revenue and Forecast to 2031(US$ Million) - by Insert Shape
- Table 94. South Korea: Indexable Inserts Market - Revenue and Forecast to 2031(US$ Million) - by Application
- Table 95. South Korea: Indexable Inserts Market - Revenue and Forecast to 2031(US$ Million) - by Size
- Table 96. South Korea: Indexable Inserts Market - Revenue and Forecast to 2031(US$ Million) - by Insert Material
- Table 97. South Korea: Indexable Inserts Market - Revenue and Forecast to 2031(US$ Million) - by Industry
- Table 98. Rest of APAC: Indexable Inserts Market - Revenue and Forecast to 2031(US$ Million) - by Insert Shape
- Table 99. Rest of APAC: Indexable Inserts Market - Revenue and Forecast to 2031(US$ Million) - by Application
- Table 100. Rest of APAC: Indexable Inserts Market - Revenue and Forecast to 2031(US$ Million) - by Size
- Table 101. Rest of APAC: Indexable Inserts Market - Revenue and Forecast to 2031(US$ Million) - by Insert Material
- Table 102. Rest of APAC: Indexable Inserts Market - Revenue and Forecast to 2031(US$ Million) - by Industry
- Table 103. Middle East and Africa: Indexable Inserts Market - Revenue and Forecast to 2031(US$ Million) - by Insert Shape
- Table 104. Middle East and Africa: Indexable Inserts Market - Revenue and Forecast to 2031(US$ Million) - by Application
- Table 105. Middle East and Africa: Indexable Inserts Market - Revenue and Forecast to 2031(US$ Million) - by Size
- Table 106. Middle East and Africa: Indexable Inserts Market - Revenue and Forecast to 2031(US$ Million) - by Insert Material
- Table 107. Middle East and Africa: Indexable Inserts Market - Revenue and Forecast to 2031(US$ Million) - by Industry
- Table 108. Middle East and Africa: Indexable Inserts Market - Revenue and Forecast to 2031(US$ Million) - by Country
- Table 109. South Africa: Indexable Inserts Market - Revenue and Forecast to 2031(US$ Million) - by Insert Shape
- Table 110. South Africa: Indexable Inserts Market - Revenue and Forecast to 2031(US$ Million) - by Application
- Table 111. South Africa: Indexable Inserts Market - Revenue and Forecast to 2031(US$ Million) - by Size
- Table 112. South Africa: Indexable Inserts Market - Revenue and Forecast to 2031(US$ Million) - by Insert Material
- Table 113. South Africa: Indexable Inserts Market - Revenue and Forecast to 2031(US$ Million) - by Industry
- Table 114. Saudi Arabia: Indexable Inserts Market - Revenue and Forecast to 2031(US$ Million) - by Insert Shape
- Table 115. Saudi Arabia: Indexable Inserts Market - Revenue and Forecast to 2031(US$ Million) - by Application
- Table 116. Saudi Arabia: Indexable Inserts Market - Revenue and Forecast to 2031(US$ Million) - by Size
- Table 117. Saudi Arabia: Indexable Inserts Market - Revenue and Forecast to 2031(US$ Million) - by Insert Material
- Table 118. Saudi Arabia: Indexable Inserts Market - Revenue and Forecast to 2031(US$ Million) - by Industry
- Table 119. United Arab Emirates: Indexable Inserts Market - Revenue and Forecast to 2031(US$ Million) - by Insert Shape
- Table 120. United Arab Emirates: Indexable Inserts Market - Revenue and Forecast to 2031(US$ Million) - by Application
- Table 121. United Arab Emirates: Indexable Inserts Market - Revenue and Forecast to 2031(US$ Million) - by Size
- Table 122. United Arab Emirates: Indexable Inserts Market - Revenue and Forecast to 2031(US$ Million) - by Insert Material
- Table 123. United Arab Emirates: Indexable Inserts Market - Revenue and Forecast to 2031(US$ Million) - by Industry
- Table 124. Rest of Middle East and Africa: Indexable Inserts Market - Revenue and Forecast to 2031(US$ Million) - by Insert Shape
- Table 125. Rest of Middle East and Africa: Indexable Inserts Market - Revenue and Forecast to 2031(US$ Million) - by Application
- Table 126. Rest of Middle East and Africa: Indexable Inserts Market - Revenue and Forecast to 2031(US$ Million) - by Size
- Table 127. Rest of Middle East and Africa: Indexable Inserts Market - Revenue and Forecast to 2031(US$ Million) - by Insert Material
- Table 128. Rest of Middle East and Africa: Indexable Inserts Market - Revenue and Forecast to 2031(US$ Million) - by Industry
- Table 129. South and Central America: Indexable Inserts Market - Revenue and Forecast to 2031(US$ Million) - by Insert Shape
- Table 130. South and Central America: Indexable Inserts Market - Revenue and Forecast to 2031(US$ Million) - by Application
- Table 131. South and Central America: Indexable Inserts Market - Revenue and Forecast to 2031(US$ Million) - by Size
- Table 132. South and Central America: Indexable Inserts Market - Revenue and Forecast to 2031(US$ Million) - by Insert Material
- Table 133. South and Central America: Indexable Inserts Market - Revenue and Forecast to 2031(US$ Million) - by Industry
- Table 134. South and Central America: Indexable Inserts Market - Revenue and Forecast to 2031(US$ Million) - by Country
- Table 135. Brazil: Indexable Inserts Market - Revenue and Forecast to 2031(US$ Million) - by Insert Shape
- Table 136. Brazil: Indexable Inserts Market - Revenue and Forecast to 2031(US$ Million) - by Application
- Table 137. Brazil: Indexable Inserts Market - Revenue and Forecast to 2031(US$ Million) - by Size
- Table 138. Brazil: Indexable Inserts Market - Revenue and Forecast to 2031(US$ Million) - by Insert Material
- Table 139. Brazil: Indexable Inserts Market - Revenue and Forecast to 2031(US$ Million) - by Industry
- Table 140. Argentina: Indexable Inserts Market - Revenue and Forecast to 2031(US$ Million) - by Insert Shape
- Table 141. Argentina: Indexable Inserts Market - Revenue and Forecast to 2031(US$ Million) - by Application
- Table 142. Argentina: Indexable Inserts Market - Revenue and Forecast to 2031(US$ Million) - by Size
- Table 143. Argentina: Indexable Inserts Market - Revenue and Forecast to 2031(US$ Million) - by Insert Material
- Table 144. Argentina: Indexable Inserts Market - Revenue and Forecast to 2031(US$ Million) - by Industry
- Table 145. Rest of South and Central America: Indexable Inserts Market - Revenue and Forecast to 2031(US$ Million) - by Insert Shape
- Table 146. Rest of South and Central America: Indexable Inserts Market - Revenue and Forecast to 2031(US$ Million) - by Application
- Table 147. Rest of South and Central America: Indexable Inserts Market - Revenue and Forecast to 2031(US$ Million) - by Size
- Table 148. Rest of South and Central America: Indexable Inserts Market - Revenue and Forecast to 2031(US$ Million) - by Insert Material
- Table 149. Rest of South and Central America: Indexable Inserts Market - Revenue and Forecast to 2031(US$ Million) - by Industry
List Of Figures
- Figure 1. Indexable Inserts Market Segmentation, by Geography
- Figure 2. PEST Analysis
- Figure 3. Impact Analysis of Drivers and Restraints
- Figure 4. Indexable Inserts Market Revenue (US$ Million), 2021-2031
- Figure 5. Indexable Inserts Market Share (%) - by Insert Shape (2023 and 2031)
- Figure 6. Round: Indexable Inserts Market - Revenue and Forecast to 2031 (US$ Million)
- Figure 7. Square: Indexable Inserts Market - Revenue and Forecast to 2031 (US$ Million)
- Figure 8. Triangle: Indexable Inserts Market - Revenue and Forecast to 2031 (US$ Million)
- Figure 9. Rhombic: Indexable Inserts Market - Revenue and Forecast to 2031 (US$ Million)
- Figure 10. Others: Indexable Inserts Market - Revenue and Forecast to 2031 (US$ Million)
- Figure 11. Indexable Inserts Market Share (%) - by Application (2023 and 2031)
- Figure 12. Milling: Indexable Inserts Market - Revenue and Forecast to 2031 (US$ Million)
- Figure 13. Drilling: Indexable Inserts Market - Revenue and Forecast to 2031 (US$ Million)
- Figure 14. Turning: Indexable Inserts Market - Revenue and Forecast to 2031 (US$ Million)
- Figure 15. Threading: Indexable Inserts Market - Revenue and Forecast to 2031 (US$ Million)
- Figure 16. Others: Indexable Inserts Market - Revenue and Forecast to 2031 (US$ Million)
- Figure 17. Indexable Inserts Market Share (%) - by Size (2023 and 2031)
- Figure 18. Upto 10 mm: Indexable Inserts Market - Revenue and Forecast to 2031 (US$ Million)
- Figure 19.-20 mm: Indexable Inserts Market - Revenue and Forecast to 2031 (US$ Million)
- Figure 20. Above 20 mm: Indexable Inserts Market - Revenue and Forecast to 2031 (US$ Million)
- Figure 21. Indexable Inserts Market Share (%) - by Insert Material (2023 and 2031)
- Figure 22. Carbide: Indexable Inserts Market - Revenue and Forecast to 2031 (US$ Million)
- Figure 23. Ceramic and Composites: Indexable Inserts Market - Revenue and Forecast to 2031 (US$ Million)
- Figure 24. PCD Inserts: Indexable Inserts Market - Revenue and Forecast to 2031 (US$ Million)
- Figure 25. Others: Indexable Inserts Market - Revenue and Forecast to 2031 (US$ Million)
- Figure 26. Indexable Inserts Market Share (%) - by Industry (2023 and 2031)
- Figure 27. Aerospace and Defense: Indexable Inserts Market - Revenue and Forecast to 2031 (US$ Million)
- Figure 28. General Industry: Indexable Inserts Market - Revenue and Forecast to 2031 (US$ Million)
- Figure 29. Oil and Gas: Indexable Inserts Market - Revenue and Forecast to 2031 (US$ Million)
- Figure 30. Power Generation: Indexable Inserts Market - Revenue and Forecast to 2031 (US$ Million)
- Figure 31. Automotive: Indexable Inserts Market - Revenue and Forecast to 2031 (US$ Million)
- Figure 32. Electric and Electronics: Indexable Inserts Market - Revenue and Forecast to 2031 (US$ Million)
- Figure 33. Medical: Indexable Inserts Market - Revenue and Forecast to 2031 (US$ Million)
- Figure 34. Others: Indexable Inserts Market - Revenue and Forecast to 2031 (US$ Million)
- Figure 35. Indexable Inserts Market Breakdown by Region, 2023 and 2031 (%)
- Figure 36. North America: Indexable Inserts Market - Revenue and Forecast to 2031(US$ Million)
- Figure 37. North America: Indexable Inserts Market Breakdown, by Insert Shape (2023 and 2031)
- Figure 38. North America: Indexable Inserts Market Breakdown, by Application (2023 and 2031)
- Figure 39. North America: Indexable Inserts Market Breakdown, by Size (2023 and 2031)
- Figure 40. North America: Indexable Inserts Market Breakdown, by Insert Material (2023 and 2031)
- Figure 41. North America: Indexable Inserts Market Breakdown, by Industry (2023 and 2031)
- Figure 42. North America: Indexable Inserts Market Breakdown, by Key Countries, 2023 and 2031 (%)
- Figure 43. United States: Indexable Inserts Market - Revenue and Forecast to 2031(US$ Million)
- Figure 44. Canada: Indexable Inserts Market - Revenue and Forecast to 2031(US$ Million)
- Figure 45. Mexico: Indexable Inserts Market - Revenue and Forecast to 2031(US$ Million)
- Figure 46. Europe: Indexable Inserts Market - Revenue and Forecast to 2031(US$ Million)
- Figure 47. Europe: Indexable Inserts Market Breakdown, by Insert Shape (2023 and 2031)
- Figure 48. Europe: Indexable Inserts Market Breakdown, by Application (2023 and 2031)
- Figure 49. Europe: Indexable Inserts Market Breakdown, by Size (2023 and 2031)
- Figure 50. Europe: Indexable Inserts Market Breakdown, by Insert Material (2023 and 2031)
- Figure 51. Europe: Indexable Inserts Market Breakdown, by Industry (2023 and 2031)
- Figure 52. Europe: Indexable Inserts Market Breakdown, by Key Countries, 2023 and 2031 (%)
- Figure 53. Germany: Indexable Inserts Market - Revenue and Forecast to 2031(US$ Million)
- Figure 54. France: Indexable Inserts Market - Revenue and Forecast to 2031(US$ Million)
- Figure 55. Italy: Indexable Inserts Market - Revenue and Forecast to 2031(US$ Million)
- Figure 56. United Kingdom: Indexable Inserts Market - Revenue and Forecast to 2031(US$ Million)
- Figure 57. Russia: Indexable Inserts Market - Revenue and Forecast to 2031(US$ Million)
- Figure 58. Rest of Europe: Indexable Inserts Market - Revenue and Forecast to 2031(US$ Million)
- Figure 59. Asia Pacific: Indexable Inserts Market - Revenue and Forecast to 2031(US$ Million)
- Figure 60. Asia Pacific: Indexable Inserts Market Breakdown, by Insert Shape (2023 and 2031)
- Figure 61. Asia Pacific: Indexable Inserts Market Breakdown, by Application (2023 and 2031)
- Figure 62. Asia Pacific: Indexable Inserts Market Breakdown, by Size (2023 and 2031)
- Figure 63. Asia Pacific: Indexable Inserts Market Breakdown, by Insert Material (2023 and 2031)
- Figure 64. Asia Pacific: Indexable Inserts Market Breakdown, by Industry (2023 and 2031)
- Figure 65. Asia Pacific: Indexable Inserts Market Breakdown, by Key Countries, 2023 and 2031 (%)
- Figure 66. Australia: Indexable Inserts Market - Revenue and Forecast to 2031(US$ Million)
- Figure 67. China: Indexable Inserts Market - Revenue and Forecast to 2031(US$ Million)
- Figure 68. India: Indexable Inserts Market - Revenue and Forecast to 2031(US$ Million)
- Figure 69. Japan: Indexable Inserts Market - Revenue and Forecast to 2031(US$ Million)
- Figure 70. South Korea: Indexable Inserts Market - Revenue and Forecast to 2031(US$ Million)
- Figure 71. Rest of APAC: Indexable Inserts Market - Revenue and Forecast to 2031(US$ Million)
- Figure 72. Middle East and Africa: Indexable Inserts Market - Revenue and Forecast to 2031(US$ Million)
- Figure 73. Middle East and Africa: Indexable Inserts Market Breakdown, by Insert Shape (2023 and 2031)
- Figure 74. Middle East and Africa: Indexable Inserts Market Breakdown, by Application (2023 and 2031)
- Figure 75. Middle East and Africa: Indexable Inserts Market Breakdown, by Size (2023 and 2031)
- Figure 76. Middle East and Africa: Indexable Inserts Market Breakdown, by Insert Material (2023 and 2031)
- Figure 77. Middle East and Africa: Indexable Inserts Market Breakdown, by Industry (2023 and 2031)
- Figure 78. Middle East and Africa: Indexable Inserts Market Breakdown, by Key Countries, 2023 and 2031 (%)
- Figure 79. South Africa: Indexable Inserts Market - Revenue and Forecast to 2031(US$ Million)
- Figure 80. Saudi Arabia: Indexable Inserts Market - Revenue and Forecast to 2031(US$ Million)
- Figure 81. United Arab Emirates: Indexable Inserts Market - Revenue and Forecast to 2031(US$ Million)
- Figure 82. Rest of Middle East and Africa: Indexable Inserts Market - Revenue and Forecast to 2031(US$ Million)
- Figure 83. South and Central America: Indexable Inserts Market - Revenue and Forecast to 2031(US$ Million)
- Figure 84. South and Central America: Indexable Inserts Market Breakdown, by Insert Shape (2023 and 2031)
- Figure 85. South and Central America: Indexable Inserts Market Breakdown, by Application (2023 and 2031)
- Figure 86. South and Central America: Indexable Inserts Market Breakdown, by Size (2023 and 2031)
- Figure 87. South and Central America: Indexable Inserts Market Breakdown, by Insert Material (2023 and 2031)
- Figure 88. South and Central America: Indexable Inserts Market Breakdown, by Industry (2023 and 2031)
- Figure 89. South and Central America: Indexable Inserts Market Breakdown, by Key Countries, 2023 and 2031 (%)
- Figure 90. Brazil: Indexable Inserts Market - Revenue and Forecast to 2031(US$ Million)
- Figure 91. Argentina: Indexable Inserts Market - Revenue and Forecast to 2031(US$ Million)
- Figure 92. Rest of South and Central America: Indexable Inserts Market - Revenue and Forecast to 2031(US$ Million)
- Figure 93. Heat Map Analysis
- Figure 94. Company Positioning & Concentration
The indexable inserts market size was valued at US$ 9.02 billion in 2023 and is expected to reach US$ 14.57 billion by 2031; it is estimated to record a CAGR of 6.2% from 2023 to 2031.
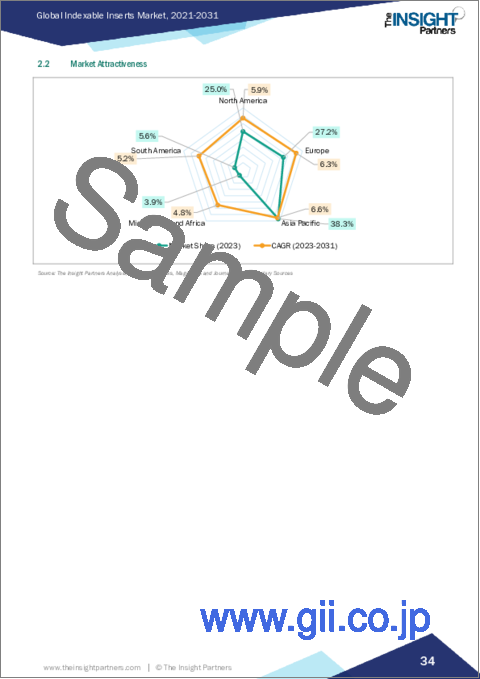
The indexable inserts market is segmented into five major regions-North America, Europe, Asia Pacific (APAC), the Middle East & Africa (MEA), and South America. Asia Pacific dominated the market in 2023, followed by Europe and North America, respectively. The indexable inserts market in Asia Pacific is segmented into the Australia, China, Japan, South Korea, India, and Rest of Asia Pacific. The region consists of various developing economies such as India, China, Thailand, Vietnam, Singapore, Taiwan, and New Zealand. These countries are experiencing a gradual increase in the adoption of advanced manufacturing technologies. Furthermore, the availability of low labor costs, low taxes and tariffs, and a strong business ecosystem are attracting international players in the manufacturing industry to expand their production facilities in this region. In November 2022, Kennametal Inc. announced the opening of its new metal cutting insert manufacturing facility in Bengaluru, India. With this strategic development, the company aims to enhance its capabilities and capacity to meet the growing demand in the Asia Pacific indexable inserts market.
In addition, the growing automation and digitalization are propelling the growth of the modernized and standardized manufacturing sector in Asia Pacific, which is expected to fuel the demand for metalworking machines and cutting tools. Thus, the growing manufacturing industry in Asia Pacific is projected to offer key lucrative opportunities for metalworking machinery and cutting tools, thereby fueling the indexable inserts market growth in the coming years. Moreover, the rapid growth of electronics, electric vehicles, aviation, manufacturing, and other industries is anticipated to fuel the demand for cutting tools in threading, cutting, grooving, and other operations in the industries mentioned above.
As per the World Steel Association - AISBL, China was the largest steel-producing country in the world in 2023, with 1,019.1 million tonnes of output. Several key players in the metal production industries are headquartered in the country; these include Jianglong Group, China Baowu Group, ShaGang Group, and Shougang Group, which contribute significantly to the growth of its metal production industry. Various enterprises across the world are focusing on expanding their metalworking capabilities in the proximity of metal manufacturing businesses in China to reduce costs of transportation and ease import procedures. The growing metal manufacturing industry in China thus bolsters the demand for metalworking machines, including cutting tools such as indexable inserts.
Based on insert shape, the global indexable inserts market is bifurcated into round, square, triangle, rhombic, and others. The rhombic segment dominated the market for insert shape in 2023 owing to rise in utilization of rhombic indexable inserts to fabricate or cut for roughing and finishing aluminum alloy-based products. Aluminum parts are used across a variety of industries, including aerospace, automotive, heavy industries, and electronics and semiconductors, which use aluminum alloys for their respective applications. Moreover, the increasing adoption of aluminum/aluminum alloy-based products across different industries is one of the major factors driving the growth of the indexable inserts market for the rhombic segment. In addition, triangle indexable inserts are used for operations such as turning, facing, boring, copy turning, and simple shaping. There exists a wide variety of tool holders with various lead angles. Triangles are cost-effective because they have six cutting edges. T-style inserts are also the best choice for general boring since they insert firmly into the pocket of the boring bar, and there is more side clearance between the insert and workpiece bore, which minimizes the chances of a chip jam. However, the work done using a 60° edge will not be as strong as work done using 80° diamond inserts.
Sandvik AB; Kennametal Inc.; Iscar Ltd.; Paul Horn GmBH; Kyocera Corporation; Ingersoll; Zhuzhou Cemented Carbide Cutting Tools Co., Ltd.; MITSUBISHI MATERIALS Corporation; Guhring, Inc.; YG-1 Co., Ltd.; Ceratizit Group; and Boehlerit GmbH & Co.KG are among the key indexable inserts market players that are profiled in this market study.
The overall indexable inserts market size has been derived using both primary and secondary sources. Exhaustive secondary research has been conducted using internal and external sources to obtain qualitative and quantitative information related to the indexable inserts market size. The process also helps obtain an overview and forecast of the market with respect to all the market segments. Also, multiple primary interviews have been conducted with industry participants to validate the data and gain analytical insights. This process includes industry experts such as VPs, business development managers, market intelligence managers, and national sales managers, along with external consultants such as valuation experts, research analysts, and key opinion leaders, specializing in the indexable inserts market.
Table Of Contents
1. Introduction
- 1.1 The Insight Partners Research Report Guidance
- 1.2 Market Segmentation
2. Executive Summary
- 2.1 Key Insights
- 2.2 Market Attractiveness
3. Research Methodology
- 3.1 Secondary Research
- 3.2 Primary Research
- 3.2.1 Hypothesis formulation:
- 3.2.2 Macro-economic factor analysis:
- 3.2.3 Developing base number:
- 3.2.4 Data Triangulation:
- 3.2.5 Country level data:
4. Indexable Inserts Market Landscape
- 4.1 Overview
- 4.2 PEST Analysis
- 4.3 Ecosystem Analysis
- 4.3.1 List of Vendors in the Value Chain
5. Indexable Inserts Market - Key Market Dynamics
- 5.1 Indexable Inserts Market - Key Market Dynamics
- 5.2 Market Drivers
- 5.2.1 Increasing Use in Metalworking and Machining Applications
- 5.2.2 Rising Demand for Indexable Tools in Industrial Applications
- 5.2.3 Growing Government Spending on Military Infrastructure Development and Reinforcement
- 5.3 Market Restraints
- 5.3.1 Raw Material Price Variations
- 5.4 Market Opportunities
- 5.4.1 Technological Advancements in Manufacturing Operations
- 5.5 Future Trends
- 5.5.1 Increasing Efforts to Improve Performance of Indexable Inserts with Utilization of Advanced Coatings and Materials
- 5.6 Impact of Drivers and Restraints:
6. Indexable Inserts Market - Global Market Analysis
- 6.1 Indexable Inserts Market Revenue (US$ Million), 2021-2031
- 6.2 Indexable Inserts Market Forecast Analysis
7. Indexable Inserts Market Analysis - by Insert Shape
- 7.1 Round
- 7.1.1 Overview
- 7.1.2 Round: Indexable Inserts Market - Revenue and Forecast to 2031 (US$ Million)
- 7.2 Square
- 7.2.1 Overview
- 7.2.2 Square: Indexable Inserts Market - Revenue and Forecast to 2031 (US$ Million)
- 7.3 Triangle
- 7.3.1 Overview
- 7.3.2 Triangle: Indexable Inserts Market - Revenue and Forecast to 2031 (US$ Million)
- 7.4 Rhombic
- 7.4.1 Overview
- 7.4.2 Rhombic: Indexable Inserts Market - Revenue and Forecast to 2031 (US$ Million)
- 7.5 Others
- 7.5.1 Overview
- 7.5.2 Others: Indexable Inserts Market - Revenue and Forecast to 2031 (US$ Million)
8. Indexable Inserts Market Analysis - by Application
- 8.1 Milling
- 8.1.1 Overview
- 8.1.2 Milling: Indexable Inserts Market - Revenue and Forecast to 2031 (US$ Million)
- 8.2 Drilling
- 8.2.1 Overview
- 8.2.2 Drilling: Indexable Inserts Market - Revenue and Forecast to 2031 (US$ Million)
- 8.3 Turning.
- 8.3.1 Overview
- 8.3.2 Turning: Indexable Inserts Market - Revenue and Forecast to 2031 (US$ Million)
- 8.4 Threading
- 8.4.1 Overview
- 8.4.2 Threading: Indexable Inserts Market - Revenue and Forecast to 2031 (US$ Million)
- 8.5 Others
- 8.5.1 Overview
- 8.5.2 Others: Indexable Inserts Market - Revenue and Forecast to 2031 (US$ Million)
9. Indexable Inserts Market Analysis - by Size
- 9.1 Upto 10 mm
- 9.1.1 Overview
- 9.1.2 Upto 10 mm: Indexable Inserts Market - Revenue and Forecast to 2031 (US$ Million)
- 9.2-20 mm
- 9.2.1 Overview
- 9.2.2-20 mm: Indexable Inserts Market - Revenue and Forecast to 2031 (US$ Million)
- 9.3 Above 20 mm
- 9.3.1 Overview
- 9.3.2 Above 20 mm: Indexable Inserts Market - Revenue and Forecast to 2031 (US$ Million)
10. Indexable Inserts Market Analysis - by Insert Material
- 10.1 Carbide
- 10.1.1 Overview
- 10.1.2 Carbide: Indexable Inserts Market - Revenue and Forecast to 2031 (US$ Million)
- 10.2 Ceramic and Composites
- 10.2.1 Overview
- 10.2.2 Ceramic and Composites: Indexable Inserts Market - Revenue and Forecast to 2031 (US$ Million)
- 10.3 PCD Inserts
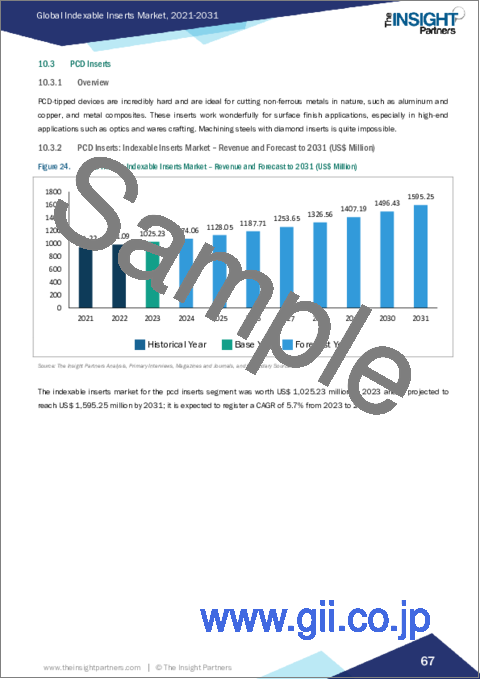
- 10.3.1 Overview
- 10.3.2 PCD Inserts: Indexable Inserts Market - Revenue and Forecast to 2031 (US$ Million)
- 10.4 Others
- 10.4.1 Overview
- 10.4.2 Others: Indexable Inserts Market - Revenue and Forecast to 2031 (US$ Million)
11. Indexable Inserts Market Analysis - by Industry
- 11.1 Aerospace and Defense
- 11.1.1 Overview
- 11.1.2 Aerospace and Defense: Indexable Inserts Market - Revenue and Forecast to 2031 (US$ Million)
- 11.2 General Industry
- 11.2.1 Overview
- 11.2.2 General Industry: Indexable Inserts Market - Revenue and Forecast to 2031 (US$ Million)
- 11.3 Oil and Gas
- 11.3.1 Overview
- 11.3.2 Oil and Gas: Indexable Inserts Market - Revenue and Forecast to 2031 (US$ Million)
- 11.4 Power Generation
- 11.4.1 Overview
- 11.4.2 Power Generation: Indexable Inserts Market - Revenue and Forecast to 2031 (US$ Million)
- 11.5 Automotive
- 11.5.1 Overview
- 11.5.2 Automotive: Indexable Inserts Market - Revenue and Forecast to 2031 (US$ Million)
- 11.6 Electric and Electronics
- 11.6.1 Overview
- 11.6.2 Electric and Electronics: Indexable Inserts Market - Revenue and Forecast to 2031 (US$ Million)
- 11.7 Medical
- 11.7.1 Overview
- 11.7.2 Medical: Indexable Inserts Market - Revenue and Forecast to 2031 (US$ Million)
- 11.8 Others
- 11.8.1 Overview
- 11.8.2 Others: Indexable Inserts Market - Revenue and Forecast to 2031 (US$ Million)
12. Indexable Inserts Market - Geographical Analysis
- 12.1 Overview
- 12.2 North America
- 12.2.1 North America Indexable Inserts Market Overview
- 12.2.2 North America: Indexable Inserts Market - Revenue and Forecast to 2031 (US$ Million)
- 12.2.3 North America: Indexable Inserts Market Breakdown, by Insert Shape
- 12.2.3.1 North America: Indexable Inserts Market - Revenue and Forecast Analysis - by Insert Shape
- 12.2.4 North America: Indexable Inserts Market Breakdown, by Application
- 12.2.4.1 North America: Indexable Inserts Market - Revenue and Forecast Analysis - by Application
- 12.2.5 North America: Indexable Inserts Market Breakdown, by Size
- 12.2.5.1 North America: Indexable Inserts Market - Revenue and Forecast Analysis - by Size
- 12.2.6 North America: Indexable Inserts Market Breakdown, by Insert Material
- 12.2.6.1 North America: Indexable Inserts Market - Revenue and Forecast Analysis - by Insert Material
- 12.2.7 North America: Indexable Inserts Market Breakdown, by Industry
- 12.2.7.1 North America: Indexable Inserts Market - Revenue and Forecast Analysis - by Industry
- 12.2.8 North America: Indexable Inserts Market - Revenue and Forecast Analysis - by Country
- 12.2.8.1 North America: Indexable Inserts Market - Revenue and Forecast Analysis - by Country
- 12.2.8.2 United States: Indexable Inserts Market - Revenue and Forecast to 2031 (US$ Million)
- 12.2.8.2.1 United States: Indexable Inserts Market Breakdown, by Insert Shape
- 12.2.8.2.2 United States: Indexable Inserts Market Breakdown, by Application
- 12.2.8.2.3 United States: Indexable Inserts Market Breakdown, by Size
- 12.2.8.2.4 United States: Indexable Inserts Market Breakdown, by Insert Material
- 12.2.8.2.5 United States: Indexable Inserts Market Breakdown, by Industry
- 12.2.8.3 Canada: Indexable Inserts Market - Revenue and Forecast to 2031 (US$ Million)
- 12.2.8.3.1 Canada: Indexable Inserts Market Breakdown, by Insert Shape
- 12.2.8.3.2 Canada: Indexable Inserts Market Breakdown, by Application
- 12.2.8.3.3 Canada: Indexable Inserts Market Breakdown, by Size
- 12.2.8.3.4 Canada: Indexable Inserts Market Breakdown, by Insert Material
- 12.2.8.3.5 Canada: Indexable Inserts Market Breakdown, by Industry
- 12.2.8.4 Mexico: Indexable Inserts Market - Revenue and Forecast to 2031 (US$ Million)
- 12.2.8.4.1 Mexico: Indexable Inserts Market Breakdown, by Insert Shape
- 12.2.8.4.2 Mexico: Indexable Inserts Market Breakdown, by Application
- 12.2.8.4.3 Mexico: Indexable Inserts Market Breakdown, by Size
- 12.2.8.4.4 Mexico: Indexable Inserts Market Breakdown, by Insert Material
- 12.2.8.4.5 Mexico: Indexable Inserts Market Breakdown, by Industry
- 12.3 Europe
- 12.3.1 Europe Indexable Inserts Market Overview
- 12.3.2 Europe: Indexable Inserts Market - Revenue and Forecast to 2031 (US$ Million)
- 12.3.3 Europe: Indexable Inserts Market Breakdown, by Insert Shape
- 12.3.3.1 Europe: Indexable Inserts Market - Revenue and Forecast Analysis - by Insert Shape
- 12.3.4 Europe: Indexable Inserts Market Breakdown, by Application
- 12.3.4.1 Europe: Indexable Inserts Market - Revenue and Forecast Analysis - by Application
- 12.3.5 Europe: Indexable Inserts Market Breakdown, by Size
- 12.3.5.1 Europe: Indexable Inserts Market - Revenue and Forecast Analysis - by Size
- 12.3.6 Europe: Indexable Inserts Market Breakdown, by Insert Material
- 12.3.6.1 Europe: Indexable Inserts Market - Revenue and Forecast Analysis - by Insert Material
- 12.3.7 Europe: Indexable Inserts Market Breakdown, by Industry
- 12.3.7.1 Europe: Indexable Inserts Market - Revenue and Forecast Analysis - by Industry
- 12.3.8 Europe: Indexable Inserts Market - Revenue and Forecast Analysis - by Country
- 12.3.8.1 Europe: Indexable Inserts Market - Revenue and Forecast Analysis - by Country
- 12.3.8.2 Germany: Indexable Inserts Market - Revenue and Forecast to 2031 (US$ Million)
- 12.3.8.2.1 Germany: Indexable Inserts Market Breakdown, by Insert Shape
- 12.3.8.2.2 Germany: Indexable Inserts Market Breakdown, by Application
- 12.3.8.2.3 Germany: Indexable Inserts Market Breakdown, by Size
- 12.3.8.2.4 Germany: Indexable Inserts Market Breakdown, by Insert Material
- 12.3.8.2.5 Germany: Indexable Inserts Market Breakdown, by Industry
- 12.3.8.3 France: Indexable Inserts Market - Revenue and Forecast to 2031 (US$ Million)
- 12.3.8.3.1 France: Indexable Inserts Market Breakdown, by Insert Shape
- 12.3.8.3.2 France: Indexable Inserts Market Breakdown, by Application
- 12.3.8.3.3 France: Indexable Inserts Market Breakdown, by Size
- 12.3.8.3.4 France: Indexable Inserts Market Breakdown, by Insert Material
- 12.3.8.3.5 France: Indexable Inserts Market Breakdown, by Industry
- 12.3.8.4 Italy: Indexable Inserts Market - Revenue and Forecast to 2031 (US$ Million)
- 12.3.8.4.1 Italy: Indexable Inserts Market Breakdown, by Insert Shape
- 12.3.8.4.2 Italy: Indexable Inserts Market Breakdown, by Application
- 12.3.8.4.3 Italy: Indexable Inserts Market Breakdown, by Size
- 12.3.8.4.4 Italy: Indexable Inserts Market Breakdown, by Insert Material
- 12.3.8.4.5 Italy: Indexable Inserts Market Breakdown, by Industry
- 12.3.8.5 United Kingdom: Indexable Inserts Market - Revenue and Forecast to 2031 (US$ Million)
- 12.3.8.5.1 United Kingdom: Indexable Inserts Market Breakdown, by Insert Shape
- 12.3.8.5.2 United Kingdom: Indexable Inserts Market Breakdown, by Application
- 12.3.8.5.3 United Kingdom: Indexable Inserts Market Breakdown, by Size
- 12.3.8.5.4 United Kingdom: Indexable Inserts Market Breakdown, by Insert Material
- 12.3.8.5.5 United Kingdom: Indexable Inserts Market Breakdown, by Industry
- 12.3.8.6 Russia: Indexable Inserts Market - Revenue and Forecast to 2031 (US$ Million)
- 12.3.8.6.1 Russia: Indexable Inserts Market Breakdown, by Insert Shape
- 12.3.8.6.2 Russia: Indexable Inserts Market Breakdown, by Application
- 12.3.8.6.3 Russia: Indexable Inserts Market Breakdown, by Size
- 12.3.8.6.4 Russia: Indexable Inserts Market Breakdown, by Insert Material
- 12.3.8.6.5 Russia: Indexable Inserts Market Breakdown, by Industry
- 12.3.8.7 Rest of Europe: Indexable Inserts Market - Revenue and Forecast to 2031 (US$ Million)
- 12.3.8.7.1 Rest of Europe: Indexable Inserts Market Breakdown, by Insert Shape
- 12.3.8.7.2 Rest of Europe: Indexable Inserts Market Breakdown, by Application
- 12.3.8.7.3 Rest of Europe: Indexable Inserts Market Breakdown, by Size
- 12.3.8.7.4 Rest of Europe: Indexable Inserts Market Breakdown, by Insert Material
- 12.3.8.7.5 Rest of Europe: Indexable Inserts Market Breakdown, by Industry
- 12.4 Asia Pacific
- 12.4.1 Asia Pacific Indexable Inserts Market Overview
- 12.4.2 Asia Pacific: Indexable Inserts Market - Revenue and Forecast to 2031 (US$ Million)
- 12.4.3 Asia Pacific: Indexable Inserts Market Breakdown, by Insert Shape
- 12.4.3.1 Asia Pacific: Indexable Inserts Market - Revenue and Forecast Analysis - by Insert Shape
- 12.4.4 Asia Pacific: Indexable Inserts Market Breakdown, by Application
- 12.4.4.1 Asia Pacific: Indexable Inserts Market - Revenue and Forecast Analysis - by Application
- 12.4.5 Asia Pacific: Indexable Inserts Market Breakdown, by Size
- 12.4.5.1 Asia Pacific: Indexable Inserts Market - Revenue and Forecast Analysis - by Size
- 12.4.6 Asia Pacific: Indexable Inserts Market Breakdown, by Insert Material
- 12.4.6.1 Asia Pacific: Indexable Inserts Market - Revenue and Forecast Analysis - by Insert Material
- 12.4.7 Asia Pacific: Indexable Inserts Market Breakdown, by Industry
- 12.4.7.1 Asia Pacific: Indexable Inserts Market - Revenue and Forecast Analysis - by Industry
- 12.4.8 Asia Pacific: Indexable Inserts Market - Revenue and Forecast Analysis - by Country
- 12.4.8.1 Asia Pacific: Indexable Inserts Market - Revenue and Forecast Analysis - by Country
- 12.4.8.2 Australia: Indexable Inserts Market - Revenue and Forecast to 2031 (US$ Million)
- 12.4.8.2.1 Australia: Indexable Inserts Market Breakdown, by Insert Shape
- 12.4.8.2.2 Australia: Indexable Inserts Market Breakdown, by Application
- 12.4.8.2.3 Australia: Indexable Inserts Market Breakdown, by Size
- 12.4.8.2.4 Australia: Indexable Inserts Market Breakdown, by Insert Material
- 12.4.8.2.5 Australia: Indexable Inserts Market Breakdown, by Industry
- 12.4.8.3 China: Indexable Inserts Market - Revenue and Forecast to 2031 (US$ Million)
- 12.4.8.3.1 China: Indexable Inserts Market Breakdown, by Insert Shape
- 12.4.8.3.2 China: Indexable Inserts Market Breakdown, by Application
- 12.4.8.3.3 China: Indexable Inserts Market Breakdown, by Size
- 12.4.8.3.4 China: Indexable Inserts Market Breakdown, by Insert Material
- 12.4.8.3.5 China: Indexable Inserts Market Breakdown, by Industry
- 12.4.8.4 India: Indexable Inserts Market - Revenue and Forecast to 2031 (US$ Million)
- 12.4.8.4.1 India: Indexable Inserts Market Breakdown, by Insert Shape
- 12.4.8.4.2 India: Indexable Inserts Market Breakdown, by Application
- 12.4.8.4.3 India: Indexable Inserts Market Breakdown, by Size
- 12.4.8.4.4 India: Indexable Inserts Market Breakdown, by Insert Material
- 12.4.8.4.5 India: Indexable Inserts Market Breakdown, by Industry
- 12.4.8.5 Japan: Indexable Inserts Market - Revenue and Forecast to 2031 (US$ Million)
- 12.4.8.5.1 Japan: Indexable Inserts Market Breakdown, by Insert Shape
- 12.4.8.5.2 Japan: Indexable Inserts Market Breakdown, by Application
- 12.4.8.5.3 Japan: Indexable Inserts Market Breakdown, by Size
- 12.4.8.5.4 Japan: Indexable Inserts Market Breakdown, by Insert Material
- 12.4.8.5.5 Japan: Indexable Inserts Market Breakdown, by Industry
- 12.4.8.6 South Korea: Indexable Inserts Market - Revenue and Forecast to 2031 (US$ Million)
- 12.4.8.6.1 South Korea: Indexable Inserts Market Breakdown, by Insert Shape
- 12.4.8.6.2 South Korea: Indexable Inserts Market Breakdown, by Application
- 12.4.8.6.3 South Korea: Indexable Inserts Market Breakdown, by Size
- 12.4.8.6.4 South Korea: Indexable Inserts Market Breakdown, by Insert Material
- 12.4.8.6.5 South Korea: Indexable Inserts Market Breakdown, by Industry
- 12.4.8.7 Rest of APAC: Indexable Inserts Market - Revenue and Forecast to 2031 (US$ Million)
- 12.4.8.7.1 Rest of APAC: Indexable Inserts Market Breakdown, by Insert Shape
- 12.4.8.7.2 Rest of APAC: Indexable Inserts Market Breakdown, by Application
- 12.4.8.7.3 Rest of APAC: Indexable Inserts Market Breakdown, by Size
- 12.4.8.7.4 Rest of APAC: Indexable Inserts Market Breakdown, by Insert Material
- 12.4.8.7.5 Rest of APAC: Indexable Inserts Market Breakdown, by Industry
- 12.5 Middle East and Africa
- 12.5.1 Middle East and Africa Indexable Inserts Market Overview
- 12.5.2 Middle East and Africa: Indexable Inserts Market - Revenue and Forecast to 2031 (US$ Million)
- 12.5.3 Middle East and Africa: Indexable Inserts Market Breakdown, by Insert Shape
- 12.5.3.1 Middle East and Africa: Indexable Inserts Market - Revenue and Forecast Analysis - by Insert Shape
- 12.5.4 Middle East and Africa: Indexable Inserts Market Breakdown, by Application
- 12.5.4.1 Middle East and Africa: Indexable Inserts Market - Revenue and Forecast Analysis - by Application
- 12.5.5 Middle East and Africa: Indexable Inserts Market Breakdown, by Size
- 12.5.5.1 Middle East and Africa: Indexable Inserts Market - Revenue and Forecast Analysis - by Size
- 12.5.6 Middle East and Africa: Indexable Inserts Market Breakdown, by Insert Material
- 12.5.6.1 Middle East and Africa: Indexable Inserts Market - Revenue and Forecast Analysis - by Insert Material
- 12.5.7 Middle East and Africa: Indexable Inserts Market Breakdown, by Industry
- 12.5.7.1 Middle East and Africa: Indexable Inserts Market - Revenue and Forecast Analysis - by Industry
- 12.5.8 Middle East and Africa: Indexable Inserts Market - Revenue and Forecast Analysis - by Country
- 12.5.8.1 Middle East and Africa: Indexable Inserts Market - Revenue and Forecast Analysis - by Country
- 12.5.8.2 South Africa: Indexable Inserts Market - Revenue and Forecast to 2031 (US$ Million)
- 12.5.8.2.1 South Africa: Indexable Inserts Market Breakdown, by Insert Shape
- 12.5.8.2.2 South Africa: Indexable Inserts Market Breakdown, by Application
- 12.5.8.2.3 South Africa: Indexable Inserts Market Breakdown, by Size
- 12.5.8.2.4 South Africa: Indexable Inserts Market Breakdown, by Insert Material
- 12.5.8.2.5 South Africa: Indexable Inserts Market Breakdown, by Industry
- 12.5.8.3 Saudi Arabia: Indexable Inserts Market - Revenue and Forecast to 2031 (US$ Million)
- 12.5.8.3.1 Saudi Arabia: Indexable Inserts Market Breakdown, by Insert Shape
- 12.5.8.3.2 Saudi Arabia: Indexable Inserts Market Breakdown, by Application
- 12.5.8.3.3 Saudi Arabia: Indexable Inserts Market Breakdown, by Size
- 12.5.8.3.4 Saudi Arabia: Indexable Inserts Market Breakdown, by Insert Material
- 12.5.8.3.5 Saudi Arabia: Indexable Inserts Market Breakdown, by Industry
- 12.5.8.4 United Arab Emirates: Indexable Inserts Market - Revenue and Forecast to 2031 (US$ Million)
- 12.5.8.4.1 United Arab Emirates: Indexable Inserts Market Breakdown, by Insert Shape
- 12.5.8.4.2 United Arab Emirates: Indexable Inserts Market Breakdown, by Application
- 12.5.8.4.3 United Arab Emirates: Indexable Inserts Market Breakdown, by Size
- 12.5.8.4.4 United Arab Emirates: Indexable Inserts Market Breakdown, by Insert Material
- 12.5.8.4.5 United Arab Emirates: Indexable Inserts Market Breakdown, by Industry
- 12.5.8.5 Rest of Middle East and Africa: Indexable Inserts Market - Revenue and Forecast to 2031 (US$ Million)
- 12.5.8.5.1 Rest of Middle East and Africa: Indexable Inserts Market Breakdown, by Insert Shape
- 12.5.8.5.2 Rest of Middle East and Africa: Indexable Inserts Market Breakdown, by Application
- 12.5.8.5.3 Rest of Middle East and Africa: Indexable Inserts Market Breakdown, by Size
- 12.5.8.5.4 Rest of Middle East and Africa: Indexable Inserts Market Breakdown, by Insert Material
- 12.5.8.5.5 Rest of Middle East and Africa: Indexable Inserts Market Breakdown, by Industry
- 12.6 South and Central America
- 12.6.1 South and Central America Indexable Inserts Market Overview
- 12.6.2 South and Central America: Indexable Inserts Market - Revenue and Forecast to 2031 (US$ Million)
- 12.6.3 South and Central America: Indexable Inserts Market Breakdown, by Insert Shape
- 12.6.3.1 South and Central America: Indexable Inserts Market - Revenue and Forecast Analysis - by Insert Shape
- 12.6.4 South and Central America: Indexable Inserts Market Breakdown, by Application
- 12.6.4.1 South and Central America: Indexable Inserts Market - Revenue and Forecast Analysis - by Application
- 12.6.5 South and Central America: Indexable Inserts Market Breakdown, by Size
- 12.6.5.1 South and Central America: Indexable Inserts Market - Revenue and Forecast Analysis - by Size
- 12.6.6 South and Central America: Indexable Inserts Market Breakdown, by Insert Material
- 12.6.6.1 South and Central America: Indexable Inserts Market - Revenue and Forecast Analysis - by Insert Material
- 12.6.7 South and Central America: Indexable Inserts Market Breakdown, by Industry
- 12.6.7.1 South and Central America: Indexable Inserts Market - Revenue and Forecast Analysis - by Industry
- 12.6.8 South and Central America: Indexable Inserts Market - Revenue and Forecast Analysis - by Country
- 12.6.8.1 South and Central America: Indexable Inserts Market - Revenue and Forecast Analysis - by Country
- 12.6.8.2 Brazil: Indexable Inserts Market - Revenue and Forecast to 2031 (US$ Million)
- 12.6.8.2.1 Brazil: Indexable Inserts Market Breakdown, by Insert Shape
- 12.6.8.2.2 Brazil: Indexable Inserts Market Breakdown, by Application
- 12.6.8.2.3 Brazil: Indexable Inserts Market Breakdown, by Size
- 12.6.8.2.4 Brazil: Indexable Inserts Market Breakdown, by Insert Material
- 12.6.8.2.5 Brazil: Indexable Inserts Market Breakdown, by Industry
- 12.6.8.3 Argentina: Indexable Inserts Market - Revenue and Forecast to 2031 (US$ Million)
- 12.6.8.3.1 Argentina: Indexable Inserts Market Breakdown, by Insert Shape
- 12.6.8.3.2 Argentina: Indexable Inserts Market Breakdown, by Application
- 12.6.8.3.3 Argentina: Indexable Inserts Market Breakdown, by Size
- 12.6.8.3.4 Argentina: Indexable Inserts Market Breakdown, by Insert Material
- 12.6.8.3.5 Argentina: Indexable Inserts Market Breakdown, by Industry
- 12.6.8.4 Rest of South and Central America: Indexable Inserts Market - Revenue and Forecast to 2031 (US$ Million)
- 12.6.8.4.1 Rest of South and Central America: Indexable Inserts Market Breakdown, by Insert Shape
- 12.6.8.4.2 Rest of South and Central America: Indexable Inserts Market Breakdown, by Application
- 12.6.8.4.3 Rest of South and Central America: Indexable Inserts Market Breakdown, by Size
- 12.6.8.4.4 Rest of South and Central America: Indexable Inserts Market Breakdown, by Insert Material
- 12.6.8.4.5 Rest of South and Central America: Indexable Inserts Market Breakdown, by Industry
13. Competitive Landscape
- 13.1 Heat Map Analysis
- 13.2 Company Positioning & Concentration
14. Industry Landscape
- 14.1 Overview
- 14.2 Product Development
15. Company Profiles
- 15.1 Sandvik AB
- 15.1.1 Key Facts
- 15.1.2 Business Description
- 15.1.3 Products and Services
- 15.1.4 Financial Overview
- 15.1.5 SWOT Analysis
- 15.1.6 Key Developments
- 15.2 Kennametal Inc
- 15.2.1 Key Facts
- 15.2.2 Business Description
- 15.2.3 Products and Services
- 15.2.4 Financial Overview
- 15.2.5 SWOT Analysis
- 15.2.6 Key Developments
- 15.3 ISCAR LTD
- 15.3.1 Key Facts
- 15.3.2 Business Description
- 15.3.3 Products and Services
- 15.3.4 Financial Overview
ANNUAL REVENUE ($ MN)
- 15.3.5 SWOT Analysis
- 15.3.6 Key Developments
- 15.4 Hartmetall-Werkzeugfabrik Paul Horn GmbH
- 15.4.1 Key Facts
- 15.4.2 Business Description
- 15.4.3 Products and Services
- 15.4.4 Financial Overview
- 15.4.5 SWOT Analysis
- 15.4.6 Key Developments
- 15.5 Kyocera Corporation
- 15.5.1 Key Facts
- 15.5.2 Business Description
- 15.5.3 Products and Services
- 15.5.4 Financial Overview
- 15.5.5 SWOT Analysis
- 15.5.6 Key Developments
- 15.6 Ingersoll Rand Inc
- 15.6.1 Key Facts
- 15.6.2 Business Description
- 15.6.3 Products and Services
- 15.6.4 Financial Overview
- 15.6.5 SWOT Analysis
- 15.6.6 Key Developments
- 15.7 Zhuzhou Cemented Carbide Cutting Tools Co., Ltd
- 15.7.1 Key Facts
- 15.7.2 Business Description
- 15.7.3 Products and Services
- 15.7.4 Financial Overview
- 15.7.5 SWOT Analysis
- 15.7.6 Key Developments
- 15.8 Mitsubishi Materials Corporation
- 15.8.1 Key Facts
- 15.8.2 Business Description
- 15.8.3 Products and Services
- 15.8.4 Financial Overview
- 15.8.5 SWOT Analysis
- 15.8.6 Key Developments
- 15.9 Guhring KG
- 15.9.1 Key Facts
- 15.9.2 Business Description
- 15.9.3 Products and Services
- 15.9.4 Financial Overview
- 15.9.5 SWOT Analysis
- 15.9.6 Key Developments
- 15.10 YG-1 Co., Ltd.
- 15.10.1 Key Facts
- 15.10.2 Business Description
- 15.10.3 Products and Services
- 15.10.4 Financial Overview
- 15.10.5 SWOT Analysis
- 15.10.6 Key Developments
- 15.11 CERATIZIT S.A.
- 15.11.1 Key Facts
- 15.11.2 Business Description
- 15.11.3 Products and Services
- 15.11.4 Financial Overview
- 15.11.5 SWOT Analysis
- 15.11.6 Key Developments
- 15.12 Boehlerit GmbH & Co.KG
- 15.12.1 Key Facts
- 15.12.2 Business Description
- 15.12.3 Products and Services
- 15.12.4 Financial Overview
- 15.12.5 SWOT Analysis
- 15.12.6 Key Developments
16. Appendix
- 16.1 About The Insight Partners

